 |
|
|
|
|
|
|
| ||||||||||
|
|
|
|
|
|
|
||||
| ||||||||||
|
|
|
|
|
Persons using assistive technology might not be able to fully access information in this file. For assistance, please send e-mail to: mmwrq@cdc.gov. Type 508 Accommodation and the title of the report in the subject line of e-mail. State-Specific Prevalence of Disability Among Adults --- 11 States and the District of Columbia, 1998Disability is a large public health problem in the United States (1), affecting an estimated 54 million persons who report disabling conditions (2). One of the national health goals for 2010 is to eliminate health disparities among different segments of the population, including among persons with disabilities (3). Although the development and implementation of public health policy and services relating to disability would be aided by public health surveillance (4), the lack of a brief case definition of disability limits efforts to obtain state-level prevalence to define the magnitude of disability. To assess state-level prevalence based on uniform criteria, CDC analyzed data from the Disability Module of the 1998 Behavioral Risk Factor Surveillance System (BRFSS). This report summarizes the results of the analyses, which indicated an overall prevalence consistent with national surveys and demonstrated wide variation in disability prevalence in states. BRFSS is a random-digit--dialed telephone survey of the noninstitutionalized U.S. population aged >18 years. The 1998 BRFSS Disability Module collected information on disability from 36,842 survey respondents (by sex and age group) in 11 states (Alabama, Arkansas, Iowa, Kansas, Massachusetts, Missouri, New Mexico, New York, North Carolina, Rhode Island, and South Carolina) and the District of Columbia (DC). Data from four states (Colorado, Oregon, Texas, and Washington) that also collected these data were not comparable and were excluded from analysis. Persons who had a disability were defined based on a qualifying response to either one of two questions: "Are you limited in any way in any activities because of an impairment or health problem?" or "If you use special equipment or help from others to get around, what type do you use?" Responses to type of assistance included wheelchair, walker, cane, or another person. Responses of "don't know" and "not sure" were coded as missing values; persons for whom responses to both questions were missing were excluded from the analyses. Sample estimates were weighted for age, sex, and race to represent the civilian population of each state, and SUDAAN was used to account for the multistage, stratified sampling of this survey. Response rates calculated using the CASRO method (5) ranged from 49.8% in Massachusetts to 65.1% in New Mexico (overall national median response rate: 59.2%). The total sample size of 36,842 respondents resulted in a weighted population of 39,247,649 persons. During 1998, the age-adjusted prevalence of disability ranged from 13.6% (DC) to 21.8% (Alabama) (median: 17.1%) (Table 1). Prevalence of disability was higher among women than among men (18.4% versus 15.7%). Among women, the prevalence ranged from 14.5% (Massachusetts) to 24.4% (Alabama); among men, the prevalence ranged from 10.4% (DC) to 20.3% (Arkansas). Among respondents aged 18--44 years, the prevalence of disability ranged from 6.3% (DC) to 12.8% (New Mexico), and the overall prevalence was 9.7%. The prevalence among respondents aged 45--64 years was 22.1%, ranging from 16.6% (Rhode Island) to 31.2% (Alabama). Prevalence of disability was highest among respondents aged >65 years (30.8%), ranging from 26.2% (Massachusetts) to 40.4% (Alabama). Reported by the following BRFSS coordinators: J Cook, Alabama; T Clark, J Senner, Arkansas; C Mitchell, District of Columbia; J Igbokwe, Iowa; J Tasheff, Kansas; D Brooks, N Wilber, Massachusetts; T Murayi, Missouri; W Honey, New Mexico; C Baker, New York; K Passaro, North Carolina; J Hesser, Rhode Island; T Aldrich, South Carolina. M Roth, North Carolina Office on Disability and Health; D Scandlin, Univ of North Carolina, Raleigh, North Carolina. Disability and Health Br, Div of Birth Defects, Child Development, and Disability and Health, National Center for Environmental Health, CDC. Editorial Note:This is the first report of state-level data generated from the BRFSS Disability Module in 11 participating states and DC. Surveys of national estimates of disability range from 15% in the National Health Interview Survey (6) to 20% in the Survey of Income and Program Participation (2). Activity limitation and use of assistive devices are generally accepted indicators of disability in surveys (2,6,7); however, it is not known whether these questions are valid measures of disability. Further analyses are needed to determine the validity of the specific questions in this report. In addition, analyses are needed to explain the variability of disability prevalence among states and to explain the health disparities between persons with and without disabilities and the risk factors for disability within states. Information about risk factors leading to disability may be available from the core module of BRFSS and from particular modules addressing other health concerns. The findings of this analysis are subject to at least seven limitations. First, because BRFSS does not sample persons aged <18 years or institutionalized persons, the findings might underestimate the true prevalence of disability in the United States. Second, the sample size for specific racial/ethnic groups is too small to make reliable generalizations about those populations. Third, BRFSS excludes persons without telephones. Fourth, the survey represents undocumented self-reported data; self-reported indicators of activity limitation and compensatory strategies have not been validated as measures of disability. Fifth, the case definition questions used in this analysis do not account for severity or duration of disability. Sixth, persons not included were those who are hearing impaired; have cognitive, speech, and other communication impairments; have limited physical stamina; or could not get to the telephone. Finally, the low response rate could affect the validity of the findings. The proportion of children and working-aged adults with disabilities is increasing (7); in comparison, the disability rate among older persons is declining each year. However, because the older population is increasing rapidly, the number of older persons with disabilities is increasing (8,9). Disability rates vary by age, sex, and race/ethnicity in national surveys, and surveillance data are needed to guide state-specific activities to meet the 2010 national health objectives. Various definitions of disability are mandated by approximately 50 federal acts and programs (10), and use of these multiple definitions result in varying prevalence estimates. Questions in surveys such as BRFSS should permit uniform surveillance and public health research at the state and national levels. References
Table 1 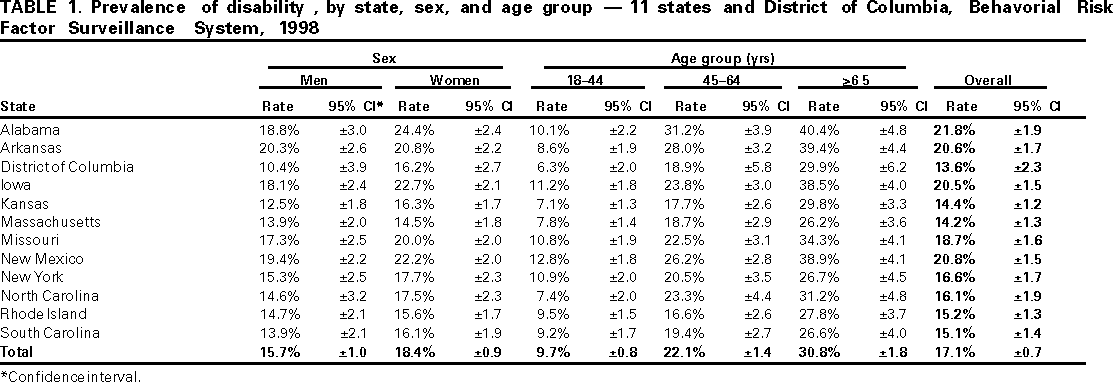 Return to top. Disclaimer All MMWR HTML versions of articles are electronic conversions from ASCII text into HTML. This conversion may have resulted in character translation or format errors in the HTML version. Users should not rely on this HTML document, but are referred to the electronic PDF version and/or the original MMWR paper copy for the official text, figures, and tables. An original paper copy of this issue can be obtained from the Superintendent of Documents, U.S. Government Printing Office (GPO), Washington, DC 20402-9371; telephone: (202) 512-1800. Contact GPO for current prices. **Questions or messages regarding errors in formatting should be addressed to mmwrq@cdc.gov.Page converted: 8/10/2000 |
|||||||||
This page last reviewed 5/2/01
|