
Persons using assistive technology might not be able to fully access information in this file. For assistance, please send e-mail to: mmwrq@cdc.gov. Type 508 Accommodation and the title of the report in the subject line of e-mail.
Assessment of Epidemiology Capacity in State Health Departments --- United States, 2009
Since 2001, the Council of State and Territorial Epidemiologists (CSTE) periodically has conducted a standardized national assessment of state health departments' core epidemiology capacity (1--3). During April--June 2009, CSTE sent a web-based questionnaire to the state epidemiologist in each of the 50 states and the District of Columbia. The assessment inquired into workforce capacity and technological advancements to support surveillance. Measures of capacity included total number of epidemiologists and self-assessment of the state's ability to carry out four essential services of public health (ESPH). This report summarizes the results of the assessment, which determined that in 2009, 10% fewer epidemiologists were working in state health departments than in 2006. Compared with 2006, the percentage of state health departments with substantial-to-full (>50%) epidemiology capacity decreased in three ESPH, including 1) capacities to monitor and detect health problems, 2) investigate them, and 3) evaluate the effectiveness of population-based services. The percentage of departments with substantial-to-full epidemiology capacity for bioterrorism/emergency response decreased slightly, from 76% in 2006 to 73% in 2009. More than 30% of states reported minimal-to-no (<25%) capacity to evaluate and conduct research and for five of nine epidemiology program areas, including environmental health, injury, occupational health, oral health, and substance abuse. Working together, federal, state, and local agencies should develop a strategy to address downward trends and major gaps in epidemiology capacity.
The main objectives of the periodic CSTE Epidemiology Capacity Assessment (ECA) are to count and characterize the state-employed epidemiologist workforce and measure current core epidemiology capacity. Standardized assessments began in 2001 (1) and were conducted in 2004, 2006, and 2009 (2,3). Some of the information sought by the assessments relate to the four most epidemiology-related ESPH.* These include 1) monitoring health status to identify and solve community health problems; 2) diagnosing and investigating health problems and health hazards in the community; 3) evaluating effectiveness, accessibility, and quality of personal and population-based health services; and 4) conducting and evaluating research for new insights and innovative solutions to health problems. The assessments also evaluate capacity in nine program areas: infectious diseases, bioterrorism/emergency response, chronic disease, maternal and child health, environmental health, injury, occupational health, oral health, and substance abuse. In 2009, questions were added to assess implementation of selected technological advancements to support surveillance.†
After pilot testing, CSTE made the 2009 ECA questionnaire available on-line to all states from April 1 through June 30, 2009. The state epidemiologist in each state was the designated key informant, and lead epidemiologists added information for program-specific questions. The state epidemiologist also distributed a worksheet on training experience and program areas of work to each enumerated epidemiologist. As follow-up, CSTE contacted each state epidemiologist to ensure the total number of epidemiologists reported on the ECA was correct. All 50 states and the District of Columbia participated. For this survey and past CSTE assessments, an epidemiologist was defined as any person who, regardless of job title, performed functions consistent with the definition of epidemiologist§ in A Dictionary of Epidemiology (4). Part-time positions and full-time positions in which epidemiologists did only part-time epidemiology work were reported as fractions of full-time equivalents. For each of the four ESPH, the state epidemiologist was asked whether the state health department had adequate epidemiology capacity to provide the services and to estimate the extent to which their department met the activity, knowledge, or resources for the ESPH.¶ Estimates were categorized as follows: full capacity = 100% of the activity, knowledge, or resources described within the question are met; almost full = 75%--99%; substantial = 50%--74%; partial = 25%--49%; minimal = some, but <25%; and none = 0. For each program area, the extent of epidemiology and surveillance capacity was assessed using the same scale.** For each program area, the state epidemiologist also was asked to provide the ideal number of epidemiologists needed to fully meet epidemiology and surveillance capacity. Population estimates from the U.S. Census for 2008 were used as denominators.
In 2009, a total of 2,193 epidemiologists worked for the 51 jurisdictions, for a rate of 0.72 epidemiologists per 100,000 population (state median: 0.77 per 100,000; range: 0.19--4.05), a 12% decrease from the 2,498 epidemiologists enumerated in 2004 and a 10% decrease from the 2,436 reported in 2006. Among respondents, 33 (65%) reported substantial-to-full capacity to monitor health status and solve community health problems, and 32 (63%) reported the same capacity to diagnose and investigate health problems and hazards in the community. In contrast, only seven (14%) reported substantial-to-full capacity to evaluate effectiveness, accessibility, and quality of personal and population-based health services, and nine (18%) to conduct research for new insights and innovative solutions to health problems (Figure 1). Except for the research ESPH, the percentage of states reporting substantial-to-full capacity decreased since 2006.
By program area, 47 states (92%) reported substantial-to-full capacity for infectious diseases, the only area with >75% of states reporting this level of capacity. For three program areas, the majority reported minimal-to-no capacity: occupational health (35, 69%), oral health (31, 61%), and substance abuse (39, 76%) (Figure 2). When compared with ECA results from the 51 jurisdictions from 2004 and 2006, four program areas showed progressive increases in substantial-to-full capacity: maternal-child health (43% to 47% to 55%), environmental health (27% to 34% to 38%), injury (18% to 25% to 34%), and occupational health (10% to 14% to 18%). Bioterrorism/emergency response was the only program area with a progressive decrease in substantial-to-full capacity, declining from 41 states (80%) in 2004 to 39 states (76%) in 2006 to 37 states (73%) in 2009. Based on responses from 36 state epidemiologists about additional needs, 1,490 additional epidemiologists (a 68% increase to 1.21 epidemiologists per 100,000 population nationally) are needed to achieve ideal epidemiology and surveillance capacity in all program areas, assuming the 15 nonrespondents had no additional need.
The assessment of technology capacity to support surveillance showed that 46 states (90%) had a National Electronic Disease Surveillance System--compliant database, but fewer had automated electronic laboratory reporting (27, 53%) or web-based provider reporting (21, 41%), used automated cluster detection software (12, 24%), or routinely geocoded reportable disease data (15, 29%) or deaths (21, 41%).
Among 2,193 enumerated epidemiologists, 1,544 (70%) completed worksheets describing their level of formal epidemiology training (Table). Of these, 885 (57%) had degrees in epidemiology, 452 (29%) had completed other formal training or academic coursework in epidemiology, and 207 (13%) had no formal training or academic coursework in epidemiology. Those with masters or higher level degrees in epidemiology increased steadily, from 49% in 2004 to 56% in 2009. The percentage with no formal training or academic coursework decreased steadily, from 29% in 2004 to 13% in 2009. State epidemiologists reported that 164 (8%) staff epidemiologists with advanced degrees retired or left their job during 2008; 17% of the current workforce anticipates leaving within 5 years.
Reported by: ML Boulton, MD, Univ of Michigan School of Public Health, Ann Arbor, Michigan. JL Hadler, MD, New Haven, Connecticut; L Ferland, MPH, E Chao, MPH, J Lemmings, MPH, Council of State and Territorial Epidemiologists, Atlanta, Georgia.
Editorial Note:
Epidemiology capacity is essential for detection, control, and prevention of major public health problems. Epidemiology provides information needed to perform four of the 10 ESPH. Healthy People 2010 objective 23-14 calls for the United States to "increase the proportion of tribal, state, and local public health agencies that provide or assure comprehensive epidemiology services to support essential public health services," so "they can quickly detect, investigate, and respond to diseases to prevent unnecessary transmission" (5). CSTE's periodic ECA is the major data source for measuring baseline and ongoing progress in this objective for state public health agencies.
The 2009 ECA revealed that the number of state-level epidemiologists has decreased since 2004, with a marked decline since 2006. The assessment also revealed a decrease in functional epidemiology capacity (even though the residual workforce appears to be increasingly well trained). Two potential explanations for the erosion in state epidemiology capacity are reduced federal terrorism preparedness and emergency response funding during the past 3--4 years and overall decline of state budgets. The 2004 assessment demonstrated that the number of epidemiologists in 39 responding states had increased by 25% from 2001 to 2004, a direct result of federal preparedness funding (2). As of 2006, such funding supported approximately 25% of state-based epidemiologists (3). However, annual awards of new grants to states through this funding stream decreased from a high of $1 billion in 2002 to approximately $698 million in 2008 (6), and bioterrorism/emergency epidemiology and surveillance capacity has decreased concurrently since peaking in 2004. Many states have adjusted their budgets to compensate for diminished revenues in 2008, resulting in workforce reduction. Recent efforts to improve public health workforce training and competence have resulted in progress. However, workforce development remains a challenge. The smaller, if more highly trained, epidemiology workforce is unable to fully compensate for current losses in personnel. Furthermore, the 2009 assessment suggests that nearly 20% of current public health epidemiologists anticipate retiring or changing careers in the next 5 years.
The findings of this report are subject to at least three limitations. First, the 2009 assessment only measured epidemiology capacity of state health departments. The capacity of local health departments was not measured. Second, the methods used by respondents to estimate their capacity to perform the essential services of public health, program-specific epidemiology and surveillance capacity, and the numbers needed to reach ideal capacity were subjective and likely varied by state and year. Finally, only 70% of respondents indicated training level, compared with 74% in 2004 and 94% in 2006, and results might have differed with more complete response.
Many states still do not have the technology capacity (e.g., automated electronic laboratory-based reporting, web-based provider reporting, and cluster-detection software) to conduct state-of-the-art surveillance for acute diseases. The result is less timely and complete reporting, reduced ability to rapidly detect outbreaks, and reduced ability to expand laboratory-based surveillance to monitor gaps in percentage of the population being adequately treated for conditions that affect large numbers of persons, such as human immunodeficiency virus and diabetes. In addition, states that do not routinely geocode address data cannot make use of geographic information systems to better describe and respond to disparities in health. State, federal, and local agencies should work together to address these downward trends and major gaps in capacity. Agencies should reach a consensus on optimal levels of epidemiology capacity and technology requirements, and then develop a strategy to achieve them.
Acknowledgments
The findings in this report are based, in part, on contributions by the 2009 ECA Workgroup, which included D Bixler, MD, West Virginia Dept of Health and Human Resources; C Hahn, MD, Idaho Dept of Health and Welfare; K Hedberg, MD, Oregon Dept of Health and Human Svcs; S Huston, PhD, North Carolina Dept of Health and Human Svcs; M Landen, MD, New Mexico Dept of Health; M Lichtveld, MD, Tulane Univ School of Public Health; S Ostroff, MD, Pennsylvania Dept of Health; W Sappenfield, MD, Florida Dept of Health; and D Thoroughman, PhD, Kentucky Dept for Public Health.
References
- CDC. Assessment of the epidemiologic capacity in state and territorial health departments---United Sates, 2001. MMWR 2003;52:1049--51.
- CDC. Assessment of epidemiologic capacity in state and territorial health departments---United States, 2004. MMWR 2005;54:457--59.
- Boulton ML, Lemmings J, Beck AJ. Assessment of epidemiology capacity in state health departments, 2001--2006. J Public Health Manag Pract 2009;15:328--36.
- Last JM, Spasoff RA, Harris SS, Thuriaux MC, eds. A dictionary of epidemiology. 4th ed. New York, NY: Oxford University Press; 2001.
- US Department of Health and Human Services. Public health infrastructure. Objective 23-14: (Developmental) Increase the proportion of tribal, state, and local health agencies that provide or assure comprehensive laboratory services to support essential public health services. Healthy people 2010 (conference ed, in 2 vols). Washington, DC: US Department of Health and Human Services; 2000. Available at http://www.healthypeople.gov/document/html/volume2/23phi.htm. Accessed December 11, 2009.
- CDC. Public health emergency preparedness (PHEP) cooperative agreement, budget period 9 announcement, May 29, 2008. Available at http://emergency.cdc.gov/cotper/coopagreement/08/pdf/fy08announcement.pdf. Accessed December 11, 2009.
* Additional information about the 10 essential services of public health is available at http://www.cdc.gov/od/ocphp/nphpsp/essentialphservices.htm.
† The questions included, "Do your reports enter into a National Electronic Disease Surveillance System compatible database? Does your state: have fully functional automated electronic laboratory (ELR) reporting?; have a formal web-based provider disease reporting system?; routinely use automated cluster detection software on reportable disease and laboratory finding case report data to look for disease clusters?; routinely geocode all births?, deaths?, reportable disease data?"
§ "An investigator who studies the occurrence of disease or other health-related conditions or events in defined populations. The control of disease in populations is often also considered to be a task for the epidemiologist, especially in speaking of certain specialized fields such as malaria epidemiology. Epidemiologists may study disease in populations of animals and plants, as well as among human populations."
¶ The question asked was, "Does your state health department have adequate epidemiologic capacity to provide the following four essential public health services?"
** The question asked was, "What is the extent of the epidemiology and surveillance capacity in the following program areas in your state health department? If needed, please seek the guidance of other state health department staff within program specific areas when completing this question."
|
What is already known on this topic? Data on state-level epidemiology capacity from surveys conducted by the Council of State and Territorial Epidemiologists (CSTE) since 2001 indicate that capacity overall is <50% in many areas, but that it increased substantially from 2001 to 2004 after the appropriation of federal funding for public health preparedness. What is added by this report? Data from the most recent CSTE survey indicate that overall state-level epidemiology capacity remains below 50% in many areas and has deteriorated since 2006, in part as a consequence of diminishing public health preparedness funding. What are the implications for public health practice? State, federal, and local agencies should work together to address downward trends and major gaps in capacity by determining optimal epidemiology capacity and technology requirements, and developing a strategy for achieving them. |
FIGURE 1. Number of state health departments reporting substantial-to-full (>50%) capacity in four essential services of public health --- Council of State and Territorial Epidemiologists Epidemiology Capacity Assessment, United States,* 2006 and 2009
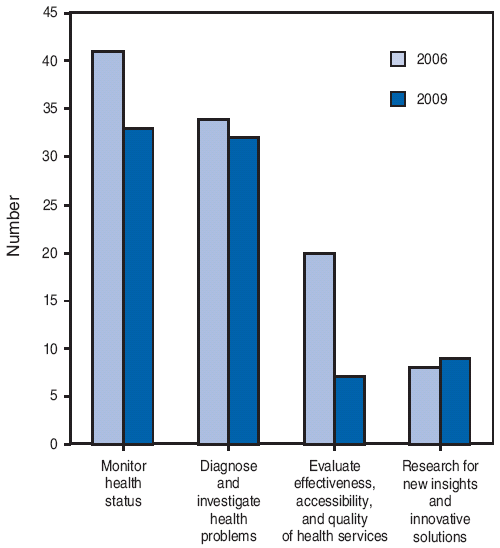
* 50 states and the District of Columbia.
Alternate Text: : The figure above shows the number of U.S. state health departments reporting substantial-to-full (>50%) capacity in four essential services of public health in 2006 and 2009. Among respondents to the 2009 Epidemiology Capacity Assessment survey of the Council of State and Territorial Epidemiologists, 33 (65%) reported substantial-to-full capacity to monitor health status and solve community health problems, and 32 (63%) reported the same capacity to diagnose and investigate health problems and hazards in the community. In contrast, only seven (14%) reported substantial-to-full capacity to evaluate effectiveness, accessibility, and quality of personal and population-based health services, and nine (18%) to conduct research for new insights and innovative solutions to health problems. Except for research, the percentage of states reporting substantial-to-full capacity decreased since 2006.
FIGURE 2. Percentage of state health departments reporting substantial-to-full (50%--100%) and minimal-to-no (<25%) capacity in epidemiology and surveillance programs, by program area --- Council of State and Territorial Epidemiologists Epidemiology Capacity Assessment, United States,* 2009
![The figure shows the percentage of state health departments reporting substantial-to-full (50–100%) and minimal-to-no (less than 25%) capacity in epidemiology and surveillance programs, by program area, from the Council of State and Territorial Epidemiologists Epidemiology Capacity Assessment survey for the United States in 2009. By program area, 47 states (92%) reported substantial-to-full capacity for infectious diseases, the only area with >75% of states reporting this level of capacity. For three program areas, the majority reported minimal-to-no capacity: occupational health (35 [69%]), oral health (31 [61%]), and substance abuse (39 [76%]).](figures/m849a1f2.gif)
* 50 states and the District of Columbia.
Alternate Text: The figure above shows the percentage of state health departments reporting substantial-to-full (50–100%) and minimal-to-no (less than 25%) capacity in epidemiology and surveillance programs, by program area, from the Council of State and Territorial Epidemiologists Epidemiology Capacity Assessment survey for the United States in 2009. By program area, 47 states (92%) reported substantial-to-full capacity for infectious diseases, the only area with >75% of states reporting this level of capacity. For three program areas, the majority reported minimal-to-no capacity: occupational health (35 [69%]), oral health (31 [61%]), and substance abuse (39 [76%]).
Use of trade names and commercial sources is for identification only and does not imply endorsement by the U.S. Department of
Health and Human Services. |
All MMWR HTML versions of articles are electronic conversions from typeset documents. This conversion might result in character translation or format errors in the HTML version. Users are referred to the electronic PDF version (http://www.cdc.gov/mmwr) and/or the original MMWR paper copy for printable versions of official text, figures, and tables. An original paper copy of this issue can be obtained from the Superintendent of Documents, U.S. Government Printing Office (GPO), Washington, DC 20402-9371; telephone: (202) 512-1800. Contact GPO for current prices.
**Questions or messages regarding errors in formatting should be addressed to mmwrq@cdc.gov.Date last reviewed: 12/17/2009