|
|
|
|
|
|
|
| ||||||||||
|
|
|
|
|
|
|
||||
| ||||||||||
|
|
|
|
|
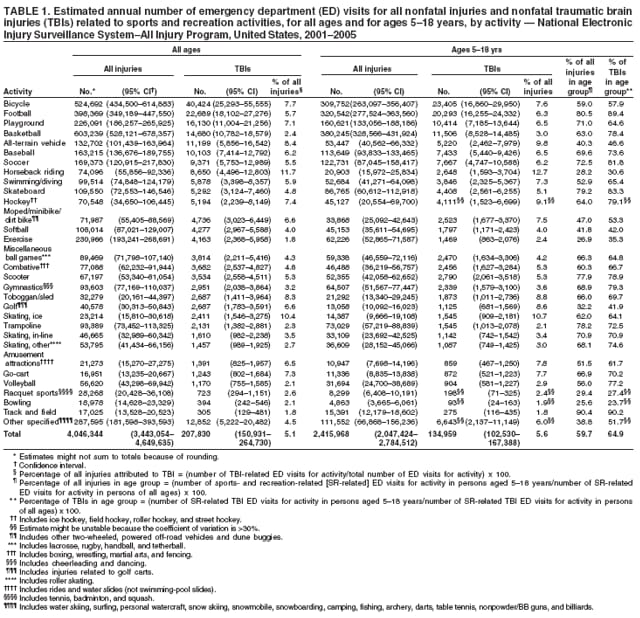
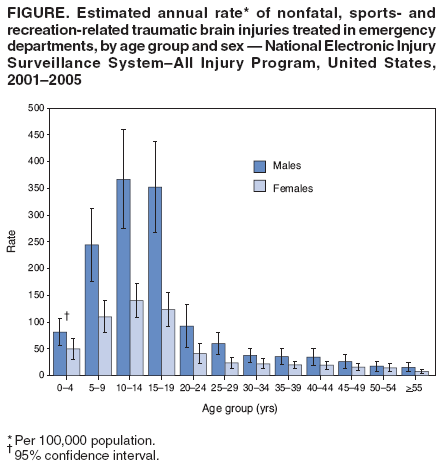
Persons using assistive technology might not be able to fully access information in this file. For assistance, please send e-mail to: mmwrq@cdc.gov. Type 508 Accommodation and the title of the report in the subject line of e-mail. Nonfatal Traumatic Brain Injuries from Sports and Recreation Activities --- United States, 2001--2005Each year in the United States, an estimated 38 million children and adolescents participate in organized sports (1), and approximately 170 million adults participate in some type of physical activity not related to work (2). The health benefits of these activities are tempered by the risk for injury, including traumatic brain injury (TBI). CDC estimates that 1.1 million persons with TBIs are treated and released from U.S. hospital emergency departments (EDs) each year, and an additional 235,000 are hospitalized for these injuries (3). TBIs can result in long-term, negative health effects (e.g., memory loss and behavioral changes) (3). To characterize sports- and recreation-related (SR-related) TBIs among patients treated in U.S. hospital EDs, CDC analyzed data from the National Electronic Injury Surveillance System--All Injury Program (NEISS-AIP) for the period 2001--2005. This report summarizes the results of that analysis, which indicated that an estimated 207,830 patients with nonfatal SR-related TBIs were treated in EDs each year during this period. The highest rates of SR-related TBI ED visits for both males and females occurred among those aged 10--14 years. Increased awareness of TBI risks, prevention strategies, and the importance of timely identification and management is essential for reducing the incidence, severity, and long-term negative health effects of this type of injury. NEISS-AIP is operated by the U.S. Consumer Product Safety Commission (CPSC) and contains data on initial visits for all types and causes of injuries in patients treated in U.S. EDs. NEISS-AIP data are drawn from a nationally representative subsample of 66 of 100 NEISS hospitals that are selected as a stratified probability sample of those hospitals in the United States and its territories with a minimum of six beds and a 24-hour ED. NEISS-AIP provides data on approximately 500,000 injury-related and consumer-product--related ED cases each year. For this analysis, SR-related injuries included those that occurred during organized and unorganized SR-related activities, regardless of whether they were work-related. Each case was initially classified into one of 39 mutually exclusive SR-related groups on the basis of an algorithm that considered both the consumer products involved (e.g., bicycles, swing sets, or in-line skating equipment) and the narrative description of the incident obtained from the medical record. These categories were combined for the analysis as necessary to produce stable estimates. SR-related cases were excluded if 1) the principal diagnosis was an illness, pain only, psychological harm only, contact dermatitis associated with consumer products or plants, or unknown; 2) the ED visit resulted from the adverse effects of therapeutic drugs or surgical care; or 3) the injury was violence-related, including intentional self-harm, assault, or legal intervention. Because not all deaths are counted by NEISS-AIP, persons who were dead on arrival or who died in the ED also were excluded. SR-related injury cases were then classified as TBI cases if the primary body part injured was the head and the principal diagnosis was within the categories of concussion or internal organ injury. Each case was assigned a sample weight on the basis of the inverse probability of selection; these weights were added to provide national estimates of SR-related injuries. Estimates were based on weighted data for 347,597 ED visits for SR-related injuries (of which 21,876 were for TBI) during 2001--2005. Confidence intervals were calculated using a direct variance estimation procedure that accounted for the sample weights and complex sample design (4). Rates were calculated using averaged 2001--2005 U.S. Census bridged-race population estimates (5). During 2001--2005, an estimated 207,830 patients with SR-related TBIs were treated in U.S. hospital EDs each year, accounting for 5.1% of all SR-related ED visits (Table 1). Overall, males accounted for approximately 70.5% of SR-related TBI ED visits. The highest rates of SR-related TBI ED visits for both males and females occurred among those aged 10--14 years, followed by those aged 15--19 years (Figure). Activities associated with the greatest number of TBI-related ED visits included bicycling, football, playground activities, basketball, and riding all-terrain vehicles (ATVs). Activities for which TBI accounted for greater than 7.5% of ED visits for that activity included horseback riding (11.7%), ice skating (10.4%), riding ATVs (8.4%), tobogganing/sledding (8.3%), and bicycling (7.7%). Each year, an estimated 21,311 SR-related TBI ED visits occurred that involved patients who were either subsequently hospitalized or transferred to another facility for additional care (Table 2). Approximately 10.3% of patients with SR-related TBIs were hospitalized or transferred, compared with 3.1% of patients with SR-related injuries overall. Activities associated with the greatest proportion of TBI-related ED visits requiring either hospitalization or transfer included riding ATVs (30.2%), riding mopeds/minibikes/dirt bikes (21.9%), bicycling (15.6%), golfing (13.6%), and riding scooters (10.5%). During 2001--2005, children aged 5--18 years accounted for an estimated 2.4 million (59.7%) SR-related ED visits, of which approximately 134,959 (5.6%) were categorized as TBI-related (Table 1). Approximately 17.9% of SR-related hospitalizations in this age group were attributed to TBIs (Table 2). Activities associated with the greatest number of TBI-related ED visits in this age group included bicycling, football, basketball, playground activities, and soccer. For all ages, activities for which TBI accounted for the greatest proportion of ED visits for that activity and the activities associated with the greatest number of TBI-related ED visits resulting in hospitalization were similar. Reported by: J Gilchrist, MD, Div of Unintentional Injury Prevention; KE Thomas, MPH, M Wald, MPH, J Langlois, ScD, Div of Injury Response, National Center for Injury Prevention and Control, CDC. Editorial Note:The findings in this report indicate that an estimated 207,830 patients with SR-related TBIs were treated in U.S. EDs each year during 2001--2005. TBIs can occur during any of these SR-related activities, at any age, and among persons of either sex. Previous research has demonstrated that the majority of TBIs are categorized initially as mild on the basis of signs and symptoms; however, even mild TBI can affect a person's ability to return to school or work and can result in long-term cognitive or other problems (3). Repeated or more severe TBIs can result in physical, cognitive, behavioral, or emotional problems (6). A previous national estimate of 300,000 SR-related TBIs included only those TBIs involving loss of consciousness (7). However, two studies have reported that only 8%--19% of SR-related TBIs involve loss of consciousness (8,9). An extrapolation based on these parameters suggests that 1.6--3.8 million SR-related TBIs occur each year, including those not treated by a health-care provider (3). Based on this estimate and the results of the analysis described in this report, an estimated 5.5%--13.0% of SR-related TBIs might result in hospital ED visits each year. Data on ED visits provide the most available national estimates for tracking this public health problem; however, the actual burden is underrepresented by use of these data. Although the information derived from NEISS-AIP in this report reflects only a limited portion of all SR-related TBIs (i.e., those resulting in ED visits), the information is useful because it enables the classification of types of SR-related activities. Other injury-classification systems (e.g., International Classification of Diseases, Ninth Revision, Clinical Modification) do not enable coding of the specific SR-related activity involved at the time of injury. The findings in this report indicate that persons aged 5--18 years account for an estimated 60% of ED visits for SR-related injuries and 65% of ED visits for SR-related TBIs. Persons in this age group are at increased risk for concussion during SR-related activities and for long-term sequelae, delayed recovery, and cumulative consequences of multiple TBIs (e.g., increased severity of future TBIs and increased risk for depression and dementia) (3,10). Therefore, prevention measures should be targeted to this age group. To improve diagnosis and management of mild TBIs, including concussions, CDC has developed a tool kit for physicians entitled "Heads Up: Brain Injury in your Practice." In addition, CDC recently released a new tool kit, "Heads Up: Concussion in Youth Sports," to accompany an existing tool kit, "Heads Up: Concussion in High School Sports." This new tool kit was developed to help youth sports coaches and administrators, parents, and athletes better understand how to prevent, recognize, and respond to concussion among young athletes. The tool kit contains 1) fact sheets for coaches, parents, and athletes; 2) a clipboard, magnet, and poster containing facts on concussion; and 3) a quiz for coaches, athletes, and parents to test their knowledge about concussion. Key components of TBI prevention in SR-related activities include 1) using protective equipment appropriate for the sport or activity (e.g., a helmet) that fits properly and is worn correctly and consistently, 2) following all appropriate safety policies, and 3) following the rules of the sport. In addition, all players, parents, and coaches should be aware of the signs and symptoms of TBIs, including concussion, and take appropriate action when such an injury is suspected. Additional information about the "Heads Up: Concussion in Youth Sports" tool kit (including information about ordering the kit free of charge) is available at http://www.cdc.gov/concussioninyouthsports. The findings in this report are subject to at least six limitations. First, injury rates for specific SR-related activities could not be calculated because of the lack of national data regarding the number of persons participating in SR-related activities. Therefore, these estimates cannot be used to calculate the risks for TBI associated with any particular sport or activity. Second, NEISS-AIP includes only injuries resulting in visits to hospital EDs; many persons with TBIs do not seek care in EDs. Third, because NEISS-AIP includes only the principal diagnosis and primary body part noted during the initial injury visit, some cases for which TBI was a secondary diagnosis might have been missed. Fourth, NEISS-AIP narrative descriptions do not provide detailed information about injury circumstances (e.g., whether the activity was organized, whether the injury occurred during training or competition, or whether protective equipment was used). Fifth, trends by year could not be calculated because small numbers would have resulted in unstable estimates. Finally, NEISS-AIP is designed to provide national estimates but not state or local estimates. These estimates highlight the need to improve the recognition, management, and prevention of SR-related TBIs and to better track the actual extent of this health problem. Additional information and resources on TBI, including all tool kits, are available at http://www.cdc.gov/ncipc/tbi/tbi.htm. Acknowledgments This report was based, in part, on contributions by T Schroeder, MS, C Irish, MS, and other staff of the Div of Hazard and Injury Data Systems, US Consumer Product Safety Commission; JL Annest, PhD, and T Haileyesus, MS, Office of Statistics and Programming, and K Sarmiento, MPH, and J Mitchko, MEd, Div of Injury Response, National Center for Injury Prevention and Control, CDC. References
|
Use of trade names and commercial sources is for identification only and does not imply endorsement by the U.S. Department of
Health and Human Services. |
Disclaimer All MMWR HTML versions of articles are electronic conversions from ASCII text into HTML. This conversion may have resulted in character translation or format errors in the HTML version. Users should not rely on this HTML document, but are referred to the electronic PDF version and/or the original MMWR paper copy for the official text, figures, and tables. An original paper copy of this issue can be obtained from the Superintendent of Documents, U.S. Government Printing Office (GPO), Washington, DC 20402-9371; telephone: (202) 512-1800. Contact GPO for current prices.
**Questions or messages regarding errors in formatting should be addressed to mmwrq@cdc.gov.Date last reviewed: 7/26/2007
|
|
|||||
|
HOME |
ABOUT MMWR |
MMWR SEARCH |
DOWNLOADS |
RSS
|
CONTACT
|
|||||
|
|
|||||
|