|
|
|
|
|
|
|
| ||||||||||
|
|
|
|
|
|
|
||||
| ||||||||||
|
|
|
|
|
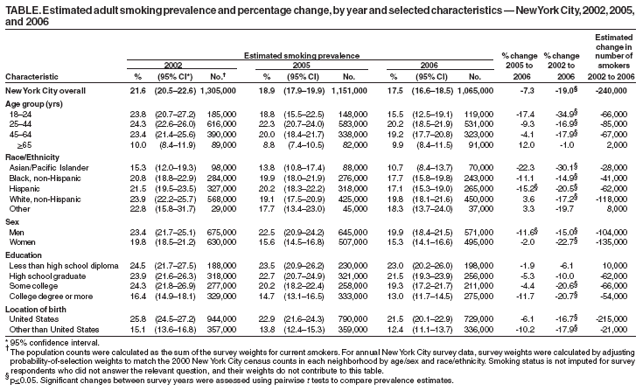
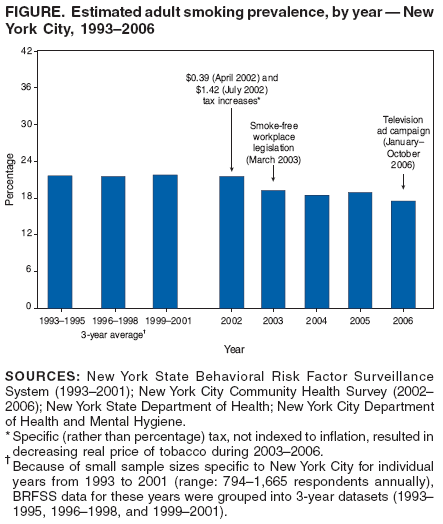
Persons using assistive technology might not be able to fully access information in this file. For assistance, please send e-mail to: mmwrq@cdc.gov. Type 508 Accommodation and the title of the report in the subject line of e-mail. Decline in Smoking Prevalence --- New York City, 2002--2006In 2002, after a decade with no decrease in smoking prevalence, New York City began implementation of a five-point tobacco-control program consisting of increased taxation in 2002, establishment of smoke-free workplaces in 2003 (1), public and health-care--provider education, cessation services, and rigorous evaluation, including annual cross-sectional, citywide telephone surveys using the same measures as CDC's state-based Behavioral Risk Factor Surveillance System (BRFSS).* During 2002--2004, estimated adult smoking prevalence decreased from 21.5% to 18.4%, representing nearly 200,000 fewer smokers (2,3). However, in 2005, no change in adult smoking prevalence occurred, either among New York City residents overall or among demographic subpopulations (3). In 2006, to further reduce smoking in New York City, the New York City Department of Health and Mental Hygiene (DOHMH) implemented an extensive, television-based anti-tobacco media campaign using graphic imagery of the health effects of smoking; the campaign aired simultaneously with a large New York state anti-tobacco media campaign. This report describes the two campaigns and analyzes citywide survey data before and after the campaigns. In 2006, during the first year of the media campaigns, adult smoking prevalence decreased significantly among men (11.6% decrease) and among Hispanics (15.2% decrease). These findings confirm the importance of comprehensive tobacco-control programs and suggest that this intensive, broad-based media campaign has reduced smoking prevalence among certain subgroups. The 2006 DOHMH media campaign, the first expanded component of the DOHMH tobacco-control program introduced since 2003, focused on increasing smokers' motivation to quit. Advertisements included testimonials from sick and dying smokers and graphic images of the effects of smoking on the lungs, arteries, and brains of smokers. Advertisements included diverse messages in both English and Spanish. The television campaign broadcast for 23 of 40 weeks during January--October 2006, with 100--600 gross ratings points (GRPs)† per week, for a total of approximately 6,500 GRPs. In 2006, the New York State Department of Health also aired a separate, simultaneous statewide television-based anti-tobacco media campaign that included New York City. The campaign included advertisements featuring graphic images of the effects of smoking and emphasizing the effects of secondhand smoke on children. The broadcasts equated to approximately 4,400 GRPs in New York City from January through December 2006. Thus, in total, New York City adult smokers were exposed to nearly 11,000 GRPs during this 1-year period, equating to the average viewer in NYC seeing an advertisement approximately 110 times over the year; this exposure is similar in magnitude to that of the highest exposure group in the American Legacy Foundation's 2000--2002 "truth" campaign,§ which equated to approximately 20,000 GRPs for the 2-year campaign period (4). To measure the annual prevalence of health conditions and risk behaviors, including smoking, DOHMH has conducted population-based, random-digit--dialed health surveys of approximately 10,000 adult New York City residents annually since 2002. Trained interviewers use computer-assisted telephone interviews to assess smoking status using the same measures as BRFSS; adult smoking is defined as adults who responded "yes" to the question "Have you smoked at least 100 cigarettes in your entire life?" and responded "every day" or "some days" to the question, "Do you now smoke cigarettes every day, some days, or not at all?" Smoking prevalence data for 1993--2001 were obtained through surveys of New York City residents, excerpted from the annual New York state BRFSS (5). Because of small sample sizes specific to New York City for individual years from 1993 to 2001 (range: 794--1,665 respondents annually), BRFSS data for these years were grouped into 3-year datasets (1993--1995, 1996--1998, and 1999--2001) (2). For annual New York City survey data, survey weights were calculated by adjusting probability-of-selection weights to match the 2000 New York City census counts in each neighborhood by age/sex and race/ethnicity. Smoking status was not imputed for survey respondents who did not answer the relevant questions. Significant changes between survey years were assessed using pairwise t tests to compare prevalence estimates of each group. A value of p<0.05 was considered significant. The smoking prevalence among New York City residents decreased significantly from 21.5% in 2002 to 18.4% in 2004 (p<0.001)¶; decreases were demonstrated in all major age, race/ethnicity, sex, and education subgroups and by location of birth. From 2004 to 2005, smoking prevalence did not change significantly among New York City residents overall, and no changes occurred within any subgroup. Although in 2006, the year during which television advertisements were aired, smoking prevalence did not change significantly among New York City residents overall (17.5% in 2006 compared with 18.9% in 2005, p=0.055) (Table), smoking prevalence decreased significantly among men (from 22.5% to 19.9%, p=0.021) and Hispanics (from 20.2% to 17.1%, p=0.027). The 17.5% prevalence among New York City residents in 2006 amounts to a 19% decrease from 2002 (Figure), representing 240,000 fewer adult smokers and an average annual rate of decrease of 5%. Young adults (aged 18--24 years) had the largest 2002--2006 decrease, 35%. Although the prevalence of smoking among men remained static from 2004 to 2005, it decreased 12% from 2005 to 2006 (p=0.021), with a statistically significant decrease among Hispanic men (from 24.6% to 19.3%; 22% decrease, p=0.024). Significant decreases occurred among Hispanics, both since 2002 (21% decrease, p=0.002) and since 2005 (15% decrease, p=0.027), after no change in the preceding year. The largest proportional 2002--2006 decrease among racial/ethnic groups was among Asians/Pacific Islanders (30% decrease, p=0.050). Although non-Hispanic whites did not demonstrate a significant decrease in smoking from 2005 to 2006, the smoking rate in this population has decreased 17% since 2002 (p=0.001), representing nearly half of the 2002--2006 decrease in the number of New York City adults who smoke (118,000 fewer non-Hispanic white smokers since 2002). Despite this progress, in 2006, the smoking prevalence among New York City men was significantly higher than among women (p<0.001). The smoking prevalence among those aged 25--44 years was higher than among adults aged 18--24 years (p=0.015); the prevalence among those aged 25--44 years and 45--64 years was higher than among those aged >65 years (p<0.001, both comparisons); and the smoking prevalence among those with less than a college education was higher than among those with more education (p<0.001). Reported by: JA Ellis, PhD, SB Perl, MPH, TR Frieden, MD, M Huynh, PhD, C Ramaswamy, MBBS, LS Gupta, MPH, BD Kerker, PhD, New York City Dept of Health and Mental Hygiene. Editorial Note:Tobacco use remains the leading preventable cause of death in the United States. Several measures are proven to reduce tobacco use. Foremost is taxation (6). In July 2002, New York City increased the excise tax on cigarettes from $0.08 to $1.50 per pack, which, combined with an April 2002 New York state excise tax increase from $1.11 to $1.50, resulted in the highest combined city/state tax in the United States at the time. The tax increases resulted in a 32% increase in the retail price of a pack of cigarettes (from $5.20 to $6.85), although an increase in tax-avoidant sales (e.g., purchasing through out-of-state sellers or American Indian reservations) resulted in only a 20% increase in the average actual price paid reported by smokers (from $4.60 to $5.50) (2). A second proven way to decrease smoking prevalence is through legislation that makes workplaces and other public areas smoke-free, protecting nonsmokers from secondhand smoke and reducing smoking prevalence among affected smokers (7). A comprehensive smoke-free workplace law covering virtually all indoor workplaces, including restaurants and bars, was implemented in New York City in 2003 (1). After implementation of these components of comprehensive tobacco control, overall smoking prevalence in New York City decreased, after a decade with no change in the smoking rate (2). The total decrease associated with New York City's comprehensive program from 2002 to 2006 was 19%, an average annual decrease of 5%. This decrease occurred more quickly than those documented by BRFSS in California (3%--4% annually during 1998--2005), Massachusetts (2% annually during 1995--2005), or the United States as a whole (2% annually during 1965--2004 and 3% annually during 2002--2006)** in any period since data were first collected in 1965. Although the effectiveness of anti-tobacco media campaigns has been evaluated previously (8), few evaluations have assessed the effect of media campaigns independent of other population-based tobacco-control measures in a comprehensive tobacco-control program. The annual survey data collected in New York City do not allow for causal interpretation of the relation between any decreases and any intervention, including the media campaign, and do not account for possible secular trends, but the implementation of the media campaign in New York City was the only major change initiated in the New York City program after 2003. Thus, the New York City data suggest that large-scale, intensive anti-tobacco media campaigns, when implemented in the context of existing comprehensive tobacco-control components such as taxation and smoke-free workplace legislation, can have a contributory effect on reducing smoking prevalence among certain subpopulations (2). Although the 2005--2006 New York City data provide important preliminary information about the potential for large-scale media campaigns to reduce smoking levels among men and Hispanics, additional smoking prevalence data from New York City are needed to confirm the broader effectiveness of such campaigns. In addition, the specific effects of the media campaign on smoking behaviors also might be documented through the use of a cohort or nested case-control study. The findings in this report are subject to at least three limitations. First, these data rely on self-reported smoking behaviors, which might be affected by social desirability bias. Second, telephone surveys such as the one described in this report exclude certain populations (e.g., military personnel residing on bases, institutionalized populations, and persons without landline telephones). Finally, the decrease in New York City since 2002 might parallel an overall national decrease during the same period; however, certain state decreases likely resulted in large part from more recent tax increases, whereas New York's tobacco tax increase occurred in 2002. The large decrease in smoking (34.9%) described among young adults (aged 18--24 years) since 2002 is consistent with data from the Youth Risk Behavior Survey in New York City, which indicated decreases among high school students through 2005, the most recent year the survey was administered (9). During 2003--2005, youth smoking in New York City decreased substantially from 14.8% to 11.2%, whereas youth smoking in the United States remained unchanged at approximately 23%.†† The aging of a cohort of adolescents with low smoking prevalence into the young adult category accounts for part of the observed decrease in smoking among adults aged 18--24 years. Although increased tobacco taxation is the most effective way to reduce smoking prevalence (6) and was cited in 2003 by New York City smokers as the primary reason for quitting or reducing tobacco use (2), this impact likely reaches its maximum effect after 1--2 years, after smokers adjust to the increased price by quitting, reducing quantities smoked, switching to less expensive brands, or purchasing through lower-cost sales channels. This is supported by data from the annual New York City phone survey, which indicates that, after increasing substantially from 2002 to 2003 (from 15.8% to 30.9% of sales), tax-avoidant sales decreased substantially among New York City smokers from 2003 to 2005 (i.e., 1--2 years after implementation, from 30.9% to 22.5%). The $10 billion spent by the tobacco industry annually on discounting the price of cigarettes (http://www.ftc.gov/reports/tobacco/2007cigarette2004-2005.pdf), which is focused in areas that have implemented higher excise taxes (10), further erodes the effect of increased taxes. No significant changes in price or place of purchase occurred from 2005 to 2006 in New York City, according to smokers' self-reports. In addition, because New York City's tobacco tax is a specific amount rather than a percentage, the inflation-adjusted price of cigarettes in New York City actually decreased steadily after implementation of the tax in 2002, indicating that the role of media might have been particularly important. Jurisdictions can make additional progress in reducing tobacco use, particularly by further increasing taxes, expanding smoke-free public places, and airing sustained, graphic, and pervasive anti-tobacco advertising. The most recent data on tobacco industry expenditures indicate that tobacco companies spent approximately $13 billion in the United States on marketing in 2005 (http://www.ftc.gov/reports/tobacco/2007cigarette2004-2005.pdf), which is more than $43 per capita. Funding of anti-tobacco media campaigns in New York City was approximately $2.70 per capita in 2006, with New York City and New York state each contributing approximately half; expenditures were within the range of $1 to $3 per capita as suggested by CDC's Best Practices for Comprehensive Tobacco Control Programs (http://www.cdc.gov/tobacco/tobacco_control_programs/stateandcommunity/best_practices/00_pdfs/bpchap6.pdf). The data presented in this report suggest that, in the context of increases in taxation and implementation of smoke-free workplace legislation, additional well-funded media campaigns that have graphic content and are aired with high frequency might further reduce smoking prevalence. References
* BRFSS is a state-based, random-digit--dialed telephone survey of the U.S. civilian, noninstitutionalized population aged >18 years. BRFSS is administered in all 50 states, the District of Columbia, and three U.S. territories (Guam, Puerto Rico, and the U.S. Virgin Islands). BRFSS prevalence data is available at http://apps.nccd.cdc.gov/brfss. † GRPs are an industry-specific standardized measure of the broadcast frequency and audience reach of a campaign. For example, 100 GRPs are equal to one exposure in the given period. § The "truth" campaign is a national antismoking campaign to discourage tobacco use among youths.
¶ Complete New York City survey data available at http://www.nyc.gov/health/epiquery. ** California and Massachusetts BRFSS smoking prevalence data are available at http://apps.nccd.cdc.gov/brfss. U.S. smoking prevalence data from the National Health Interview Survey are available at http://www.cdc.gov/tobacco/data_statistics/tables. †† CDC. Youth risk behavior surveillance---United States, 2005. MMWR 2006;55(No. SS-5). Table
Disclaimer All MMWR HTML versions of articles are electronic conversions from ASCII text into HTML. This conversion may have resulted in character translation or format errors in the HTML version. Users should not rely on this HTML document, but are referred to the electronic PDF version and/or the original MMWR paper copy for the official text, figures, and tables. An original paper copy of this issue can be obtained from the Superintendent of Documents, U.S. Government Printing Office (GPO), Washington, DC 20402-9371; telephone: (202) 512-1800. Contact GPO for current prices. **Questions or messages regarding errors in formatting should be addressed to mmwrq@cdc.gov.Date last reviewed: 6/21/2007 |
|||||||||
|