 |
|
|
|
|
|
|
| ||||||||||
|
|
|
|
|
|
|
||||
| ||||||||||
|
|
|
|
|
Persons using assistive technology might not be able to fully access information in this file. For assistance, please send e-mail to: mmwrq@cdc.gov. Type 508 Accommodation and the title of the report in the subject line of e-mail. Update: Syringe Exchange Programs --- United States, 2002Syringe exchange programs (SEPs) provide sterile syringes* in exchange for used syringes to reduce transmission of human immunodeficiency virus (HIV) and other bloodborne infections associated with reuse of contaminated syringes by injection-drug users (IDUs) (1). This report summarizes a survey of SEP activities in the United States for January--December 2002 and compares the results with those of previous surveys. The findings indicate that in 2002, for the first time in 8 years, the number of SEPs, the number of localities with SEPs, and public funding for SEPs decreased nationwide; however, the number of syringes exchanged and total budgets across all programs continued to increase. SEPs can help prevent bloodborne pathogen transmission by increasing access to sterile syringes among IDUs and enabling safe disposal of used syringes. Often, programs also provide other public health services, such as HIV testing, risk-reduction education, and referrals for substance-abuse treatment. In December 2002, staff from Beth Israel Medical Center (BIMC) in New York City and the North American Syringe Exchange Network (NASEN) mailed surveys about syringes exchanged and returned, services provided, and budgets and funding to the directors of all 148 SEPs known to NASEN (compared with 154 known SEPs for the 2000 survey, 131 for 1998, 113 for 1997, 101 for 1996, and 68 for 1994--95) (2--5; BIMC, unpublished data, 2000). Data for 2002 were collected from SEP directors during January--July 2003 through telephone interviews with BIMC staff, Internet-based questionnaires, or paper questionnaires returned by fax or mail. With the exception of the Internet-based option, the methods were similar to those used for previous surveys (2--5). Of 148 SEP directors contacted, 126 (85%) completed the survey. These 126 SEPs reported operating in 102 cities† in 31 states and the District of Columbia (DC).§ More than two-thirds (86) of SEPs were in seven states: California (25), Washington (15), New Mexico (14), New York (12), Wisconsin (eight), Massachusetts (six), and Oregon (six). SEP size was classified by the number of syringes exchanged (Table 1); 119 SEPs reported exchanging a total of 24,878,033 syringes; seven SEPs did not track the number of syringes exchanged. The 11 largest programs¶ exchanged 49% of all syringes. SEPs provided other services in addition to syringe exchange. One hundred ten (87%) SEPs provided male condoms, 96 (76%) female condoms, 111 (88%) alcohol pads, and 86 (68%) bleach; 97 (77%) provided referrals for substance-abuse treatment; 91 (72%) offered voluntary on-site counseling and testing for HIV, 54 (43%) for hepatitis C, and 37 (29%) for hepatitis B; 42 (33%) provided vaccination for hepatitis A and 45 (36%) for hepatitis B; 39 (31%) offered sexually transmitted disease (STD) screening; 29 (23%) provided on-site medical care; and 28 (22%) provided tuberculosis screening. Most programs provided risk-reduction and risk-elimination education to IDUs. One hundred fifteen (91%) programs provided education on hepatitis A, B, and C; 114 (90%) on HIV/AIDS prevention; 111 (88%) on safer injection practices; 104 (83%) on abscess prevention and care; 100 (79%) on vein care; 110 (87%) on STD prevention; 110 (87%) on male condom use; and 94 (75%) on female condom use. During 2002, a total of 126 SEPs maintained an average of six exchange sites each (median: 3.0; range: 1--47). SEPs served clients for an average of 26 hours/week (median: 18 hours/week; range: 1--202 hours/week). Buildings (e.g., storefronts, clinics, or health centers) were the most commonly reported sites; 68 total SEPs (54%) operated 156 sites/week for 1,334 hours/week). Forty-five (36%) programs served clients through health vans or car stops (203 sites/week for 616.5 hours/week), and 25 (20%) operated other types of fixed sites, such as at tables on streets, in private homes, or at shooting galleries (i.e., locations where persons inject drugs) (141 sites/week for 413.5 hours/week). Fifteen (12%) programs used mobile workers on foot or bicycle (81 sites/week for 202.0 hours/week). Of the 126 total SEPs in 2002, 69 (55%) had multiple types of exchange sites, 36 (29%) were entirely building-based, 14 (11%) were vehicle-based, five (4%) used other fixed sites, and two (2%) used mobile sites only. Delivery of syringes and other risk-reduction supplies to residences or meeting spots was reported by 62 (49%) SEPs. Secondary exchange (i.e., exchange of syringes on behalf of other persons) was allowed by 103 (82%) programs. One hundred ten of the 126 SEPs reported 2002 budget information. The reported budgets totaled $13.0 million. Individual fixed budgets ranged from $0 (nine SEPs) to $1,035,831 (mean: $118,273; median: $53,500) (Table 2). Thirty-one (28%) operated with budgets of less than $25,000, 41 (37%) with budgets of $25,000--$100,000, and 38 (35%) with budgets exceeding $100,000. SEPs reported multiple sources of financial support in 2002, including individual contributors, foundations, and state and local governments. In 2002, 58 (46%) of the 126 programs located in 15 states received public funding totaling approximately $7.3 million from city, county, and state governments.** In 2002, for the first time in 8 years, the number of SEPs, the number of localities with SEPs, and the amount of public funding for SEPs in the United States decreased; however, the total number of syringes exchanged and total budgets for all SEPs surveyed continued to increase. During 2000--2002, the number of SEPs known to NASEN decreased 3.8% (from 154 to 148), the number of states/territories with SEPs decreased 8.6% (from 35 to 32), and public funding of SEPs decreased 18% (from $8.9 million to $7.3 million). During the same period, the number of syringes exchanged increased 10.2% (from 22.6 million to 24.9 million) and total SEP budgets from public and private funds increased 7.4% (from $12.1 to $13.0 million). In addition, compared with data from 1998 (5), the proportion of SEPs in 2002 considered medium-sized (10,000--55,000 syringes exchanged) or large (55,001--499,000 syringes exchanged) increased 19%, whereas the proportion of small SEPs (<10,000 syringes exchanged) decreased 33%. Reported by: CA McKnight, MPH, DC Des Jarlais, PhD, T Perlis, PhD, K Eigo, Baron Edmond de Rothschild Chemical Dependency Institute, Beth Israel Medical Center, New York; M Krim, PhD, J Auerbach, PhD, American Foundation for AIDS Research, New York, New York. D Purchase, A Solberg, North American Syringe Exchange Network, Tacoma, Washington. TS Jones, RS Garfein, Div of HIV/AIDS Prevention, National Center for HIV, STD, and TB Prevention, CDC. Editorial Note:The results of the 2002 survey suggest that although some SEPs became more efficient at obtaining private funding to distribute more syringes, others were unable to maintain operations. As of June 2004, a total of 184 SEPS were known to NASEN, operating in 36 states, DC, Puerto Rico, and Indian Lands (D Purchase, NASEN, personal communication, 2004), indicating that trends might be changing and require additional monitoring. The findings in this report are subject to at least three limitations. First, the extent of SEP activity in the United States is probably underestimated because 22 (15%) SEPs known to NASEN did not participate in the survey, and others might exist but not be known to NASEN. Second, data collected were based on program director self-reports and were not verified independently. Third, because 26 (21%) SEPs requested that their survey data be kept confidential, some data are presented only as aggregate state-level or program-size information. Injections of illicit drugs have been estimated to represent approximately one-third of the estimated 2--3 billion injections occurring outside of health-care settings in the United States each year, second only to insulin injections by persons with diabetes (6). Improperly discarded syringes pose a serious risk for injury and infection to sanitation workers and the community (7). SEPs contribute to safe disposal of potentially infectious syringes used by IDUs by removing used syringes from the community, not only through direct exchange but also through supplemental collection programs. For example, in San Francisco in 2000, approximately 2 million syringes were recovered at SEPs, and an estimated 1.5 million syringes were collected through a pharmacy-based program that provided free-of-charge sharps containers and accepted filled containers for disposal. As a result, an estimated 3.5 million syringes were recovered from community syringe users and safely disposed of as infectious waste (8). Other SEPs offer methods for safe disposal of syringes after hours. For example, in Santa Cruz, California, the Santa Cruz Needle Exchange Program, in collaboration with the Santa Cruz Parks and Recreation Department, installed 12 steel sharps containers in public restrooms throughout the county (S Miller, Santa Cruz Needle Exchange Program, personal communication, 2004). SEPs provide health and social services to IDUs who might not otherwise be reached. They also remove syringes that are potentially contaminated with HIV and other bloodborne infections from the community. Continued monitoring of SEPs in the United States is necessary to evaluate the long-term effects of this public health intervention. References
* For this report, the term "syringes" refers to both syringes and needles. † Cities with more than one SEP: Albuquerque, New Mexico; Chicago, Illinois; Los Angeles, California; Madison, Wisconsin; New York, New York; Portland, Oregon; San Francisco, California; Seattle, Washington; and Tacoma, Washington. § States with SEPs: California (25); Washington (15); New Mexico (14); New York (12); Wisconsin (eight); Oregon and Massachusetts (six each); Connecticut and Illinois (five each); Michigan (three); Minnesota, North Carolina, Pennsylvania, Texas, and Vermont (two each); Alaska, Arizona, Colorado, DC, Georgia, Hawaii, Indiana, Kansas, Louisiana, Maine, Missouri, New Jersey, Ohio, Oklahoma, Rhode Island, Tennessee, and Utah (one each). ¶ Largest volume SEPs: Chicago Recovery Alliance (2.7 million syringes), Chicago, Illinois; San Francisco AIDS Foundation HIV Prevention Project (2.5 million), San Francisco, California; Seattle-King County Department of Public Health Needle Exchange Program, Seattle, Washington (1.0 million); Harm Reduction Institute, Indianapolis, Indiana (1.0 million); Point Defiance AIDS Project, Tacoma, Washington (0.9 million); San Diego Clean Needle Exchange Program, San Diego, California (0.9 million); Street Outreach Services, Seattle, Washington (0.8 million); Prevention Point Philadelphia, Pennsylvania (0.7 million); HIV Education and Prevention Project of Alameda, Oakland, California (0.6 million); Needle Exchange Emergency Distribution, Berkeley, California (0.5 million); and one SEP that wanted program information kept confidential. ** Public funding from state governments: California, Colorado, Connecticut, Hawaii, Illinois, Massachusetts, New Mexico, New York, Oregon, Rhode Island, Vermont, and Washington. Public funding from county governments: Clark, Cowlitz, King, Skagit, Snohomish, Spokane, Tacoma, and Thurston, Washington; Alameda, Santa Clara, and Santa Cruz, California; Dane and Milwaukee, Wisconsin; Boulder, Colorado; Cook, Illinois; and Multnomah, Oregon. Public funding from city governments: Berkeley, Los Angeles, Reseda, San Francisco, and Santa Monica, California; Coupeville and Seattle, Washington; Chicago, Illinois; Milwaukee, Wisconsin; Portland, Oregon; New York, New York; and Philadelphia, Pennsylvania.
Table 1 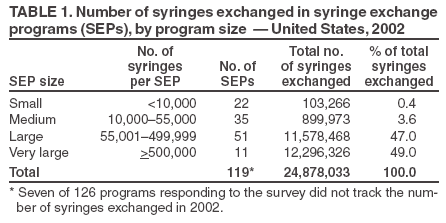 Return to top. Table 2 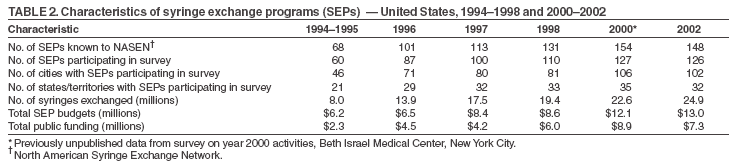 Return to top.
Disclaimer All MMWR HTML versions of articles are electronic conversions from ASCII text into HTML. This conversion may have resulted in character translation or format errors in the HTML version. Users should not rely on this HTML document, but are referred to the electronic PDF version and/or the original MMWR paper copy for the official text, figures, and tables. An original paper copy of this issue can be obtained from the Superintendent of Documents, U.S. Government Printing Office (GPO), Washington, DC 20402-9371; telephone: (202) 512-1800. Contact GPO for current prices. **Questions or messages regarding errors in formatting should be addressed to mmwrq@cdc.gov.Date last reviewed: 7/13/2005 |
|||||||||
|