 |
|
|
|
|
|
|
| ||||||||||
|
|
|
|
|
|
|
||||
| ||||||||||
|
|
|
|
|
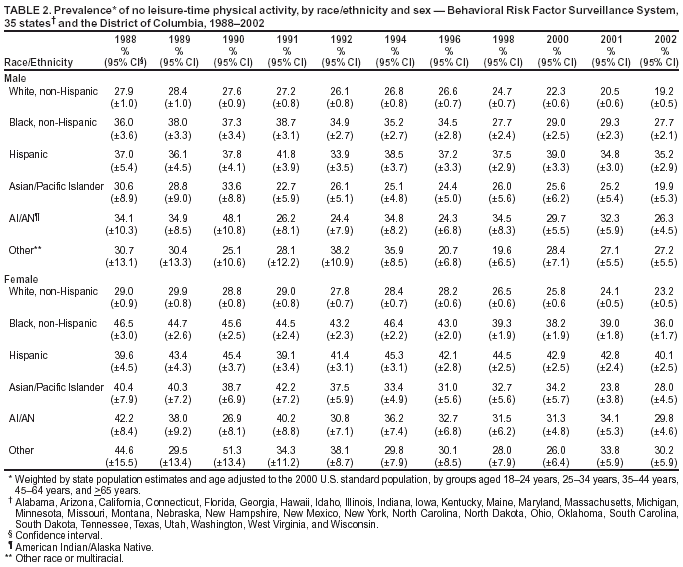
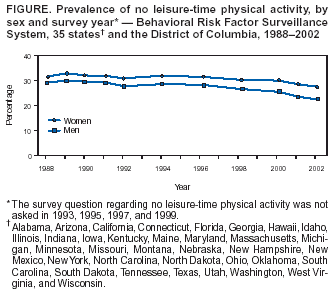
Persons using assistive technology might not be able to fully access information in this file. For assistance, please send e-mail to: mmwrq@cdc.gov. Type 508 Accommodation and the title of the report in the subject line of e-mail. Prevalence of No Leisure-Time Physical Activity --- 35 States and the District of Columbia, 1988--2002Physical inactivity is associated with obesity and increased risk for chronic diseases (e.g., cardiovascular disease, certain cancers, and diabetes mellitus) and premature mortality (1). A national health objective for 2010 is to reduce the prevalence of no leisure-time physical activity to 20% (objective 22.1) (2). Women, older adults, and the majority of racial/ethnic minority populations have the greatest prevalence of leisure-time physical inactivity (2). To examine trends in no leisure-time physical activity and further characterize them by sex, age group, and racial/ethnic population, CDC analyzed 1988--2002 data from the Behavioral Risk Factor Surveillance System (BRFSS) for 35 states* and the District of Columbia (DC). This report summarizes the results of that analysis, which indicated that leisure-time physical inactivity decreased during 1988--2002, especially after 1996, with declining trends among men and women, the majority of age groups, and the majority of racial/ ethnic populations. To promote further declines, state and local health departments and other organizations should adopt effective, evidence-based strategies to encourage more adults to be physically active in their leisure time. BRFSS is a state-based, random-digit--dialed telephone survey of the U.S. civilian, noninstitutionalized population aged >18 years. Data on leisure-time physical inactivity were collected from 11 surveys (conducted in 1988, 1989, 1990, 1991, 1992, 1994, 1996, 1998, 2000, 2001, and 2002). During 1988--2002, annual sample sizes increased from 54,685 to 170,423 persons. No leisure-time physical activity was defined as a "no" response to the survey question, "During the past month, other than your regular job, did you participate in any physical activities or exercise such as running, calisthenics, golf, gardening, or walking for exercise?" Although this survey question has been used since 1986, the wording of the reference time frame of the survey question was changed to "past 30 days" in 2001 and back to "past month" in 2002, and the phrase "other than your regular job" was added in 2001. Prevalence estimates by sex, age, and race/ethnicity were weighted to represent the populations of states included in the study, and sex and race/ethnicity estimates were age-adjusted to the 2000 U.S. population. The annual median response rate among the 35 states and DC ranged from 68.8% in 1993 to 59.9% in 2002. SUDAAN was used to account for complex sampling. Overall, the prevalence of no leisure-time physical activity peaked in 1989 at approximately 32% and was stable until 1996, after which it declined an average of 1% per year to 25% in 2002. By sex, the prevalence decreased from 29% to 22% among men and from 32% to 28% among women (Figure). By age group, no leisure-time physical activity was least prevalent among adults aged 18--29 years. During 1988--2002, prevalences in this age group ranged from 18%--21% among men and 24%--27% among women (Table 1); however, comparing 1988 survey results with those from 2002, the prevalences for men and women in that age group were unchanged. Since 1996, the prevalence of no leisure-time physical activity declined among all age groups, especially among persons in older groups. During 1988--2002, the prevalence of no leisure-time physical activity among persons aged 50--59 years decreased from 38% to 23% among men and from 35% to 28% among women. Among women aged 60--69 years, the prevalence of leisure-time physical inactivity decreased from 37% to 31%, and among women aged >70 years, the prevalence decreased from 47% to 39%. Among non-Hispanic whites, during 1988--2002, the prevalence of no leisure-time physical activity decreased from 28% to 19% among men and from 29% to 23% among women (Table 2). Among non-Hispanic blacks, the prevalence of no leisure-time physical activity decreased from 36% to 28% among men and from 47% to 36% among women. Among Hispanic men and women, prevalences for 1988 (37% and 40%, respectively) and 2002 (35% and 40%, respectively) were similar; yearly prevalences ranged from 34% to 42% among men and from 39% to 45% among women. Reported by: SA Ham, MS, MM Yore, MSPH, JE Fulton, PhD, HW Kohl III, PhD, Div of Nutrition and Physical Activity, National Center for Chronic Disease Prevention and Health Promotion, CDC. Editorial Note:The findings in this report indicate that, in 2002, the overall prevalence of no leisure-time physical activity in 35 states and DC was at the lowest level in 15 years. During 1988--2002, the overall prevalence declined approximately seven percentage points from its peak in 1989, including five percentage points since 1996. An estimated 8.3 million fewer adults reported being inactive in 2002 than in 1996. The causes are unknown for the overall decline in no leisure-time physical activity since 1996; however, the decline followed issuance of new national guidelines on physical activity in 1995 and 1996 (1,3). Findings through 1996 are consistent with a previous BRFSS trend analysis for 1990--1998 that indicated no change in prevalence (4), although prevalence during 1986--1990 declined (5). Analyses of National Health Interview Survey (NHIS) results show greater prevalence of no leisure-time physical activity than BRFSS and, since 1997, smaller declines (2%--3%) in multiple demographic groups (2). These variations might be due to differences in survey questions and sampling frames for the two surveillance systems. However, the majority of demographic groups measured by both BRFSS and NHIS have prevalences of no leisure-time activity greater than the 20% national health objective for 2010 (2). Despite the recent decline in no leisure-time physical activity, the prevalence of overweight and obese persons has increased (6). This disparity might be explained, in part, by nationally representative data indicating an increase in the caloric intake of the overall U.S. population (7). In addition, the declines in leisure-time physical inactivity might not have been accompanied by increases in physical activity sufficient to maintain or lose weight. This report is subject to at least five limitations. First, BRFSS is a telephone survey; data are self-reported, subject to both recall and social desirability bias, and provided only by those with telephones. Second, the survey question was changed slightly in 2001 and again in 2002. Third, small sample sizes among certain racial/ethnic populations can result in wide data variability and imprecise trends in these populations. Fourth, declines in survey response rates can affect the generalizability of the reported behaviors; however, an analysis for bias in generalizability of the results suggests this did not occur (8). Finally, these data are limited by coverage- and nonresponse-related errors. To promote their general health, adults are encouraged to meet or exceed recommendations of >30 minutes of moderate-intensity physical activity "most" days of the week (1,3). The majority of adults do not meet this recommendation (2,3,9). Continued efforts are needed to decrease inactivity during leisure time and increase overall physical activity among all U.S. adults (2). State and local public health departments and other organizations are encouraged to promote physical activity by using the following evidence-based strategies recommended by the Task Force on Community Preventive Services: 1) communitywide campaigns, 2) signs near elevators and escalators encouraging stair use, 3) individually adapted health-behavior change programs, 4) school physical education, 5) social support interventions in community settings, and 6) creation of, or enhanced access to, physical activity sites combined with informational outreach activities (10). References
* Alabama, Arizona, California, Connecticut, Florida, Georgia, Hawaii, Idaho, Illinois, Indiana, Iowa, Kentucky, Maine, Maryland, Massachusetts, Michigan, Minnesota, Missouri, Montana, Nebraska, New Hampshire, New Mexico, New York, North Carolina, North Dakota, Ohio, Oklahoma, South Carolina, South Dakota, Tennessee, Texas, Utah, Washington, West Virginia, and Wisconsin. Table 1  Return to top. Table 2  Return to top. Figure  Return to top.
Disclaimer All MMWR HTML versions of articles are electronic conversions from ASCII text into HTML. This conversion may have resulted in character translation or format errors in the HTML version. Users should not rely on this HTML document, but are referred to the electronic PDF version and/or the original MMWR paper copy for the official text, figures, and tables. An original paper copy of this issue can be obtained from the Superintendent of Documents, U.S. Government Printing Office (GPO), Washington, DC 20402-9371; telephone: (202) 512-1800. Contact GPO for current prices. **Questions or messages regarding errors in formatting should be addressed to mmwrq@cdc.gov.Page converted: 2/5/2004 |
|||||||||
This page last reviewed 2/5/2004
|