|
|
|
|
|
|
|
| ||||||||||
|
|
|
|
|
|
|
||||
| ||||||||||
|
|
|
|
|
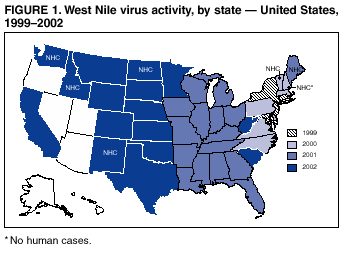
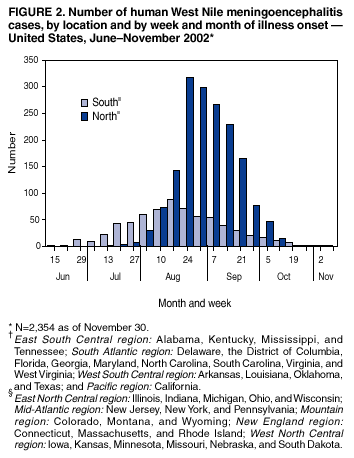
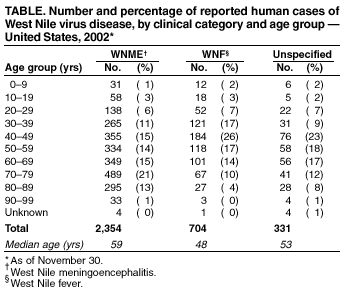
Persons using assistive technology might not be able to fully access information in this file. For assistance, please send e-mail to: mmwrq@cdc.gov. Type 508 Accommodation and the title of the report in the subject line of e-mail. Provisional Surveillance Summary of the West Nile Virus Epidemic --- United States, January--November 2002This report presents provisional summary surveillance data about West Nile virus (WNV) activity that were reported to CDC during January 1--November 30, 2002, through the ArboNET surveillance network. In 2002, the reported numbers of human and animal infections increased, and the geographic range of WNV activity expanded substantially. These data underscore the need for intensive surveillance to detect and quantify WNV activity in areas where humans are at risk, public education to teach persons how to prevent mosquito bites, and sustained and integrated mosquito-control activities. ArboNET is a web-based surveillance data network comprising 54 state and local public health departments and CDC. Specimens from ill humans and animals, dead birds, captive sentinel animals (mostly chickens), wild-caught birds, and mosquitoes were collected by state and local public health departments and other cooperating state and federal agencies and tested for WNV or WNV-specific antibody. Test results, the county and date of specimen collection or illness onset, and other data were entered into state and local public health department databases. Animal data were forwarded regularly to ArboNET through a secure data network; human cases were reported to CDC by telephone or facsimile only. In 2002, WNV activity was reported from 2,289 counties in 44 states and the District of Columbia (DC) (Figure 1) compared with 359 counties in 27 states and DC in 2001 (1), and WNV virus was detected for the first time in 1,929 U.S. counties and 16 states. In 2002, a total of 3,389 human cases* of WNV disease were reported, compared with 149 during 1999--2001, and large numbers of WNV-infected birds, equines, and mosquitoes also were reported. Human SurveillanceIn 2002, of the 3,389 reported cases of human WNV-associated illness, 2,354 (69%) persons had West Nile meningoencephalitis (WNME), 704 (21%) had West Nile fever (WNF), and 331 (10%) had an unspecified illness. Human cases were reported from 619 counties in 37 states and DC; five states (Illinois [774 cases], Michigan [475], Ohio [409], Louisiana [319], and Indiana [202]) accounted for 2,179 (64%) cases. Four of these five states (Illinois [492], Michigan [437], Ohio [277], and Louisiana [202]) together with Texas [164] accounted for 1,572 (67%) reported WNME cases. Illness onset dates ranged from June 10 to November 4 (Figure 2), and the epidemic peak of WNME cases occurred during the week ending August 24. Illness onset dates ranged from June 10 to November 4 in southern† states and from July 10 to October 28 in northern§ states. The epidemic peak of WNME cases occurred 1 week earlier in southern states (88 cases during the week ending August 17) than in northern states (317 cases during the week ending August 24). For all reported human cases, the median age of infected persons was 55 years (range: 1 month--99 years); for persons with WNME, the median age was 59 years (range: 1 month--99 years); and for persons with WNF, the median age was 48 years (range: 1--93 years) (Table). Of the 2,354 persons with WNME, 199 (9%) died; two (0.3%) of 704 persons with WNF died; both were age >80 years. The median age of the 201 decedents was 78 years (range: 24--99 years). Animal SurveillanceOf 2,289 counties reporting WNV activity, 1,719 (75%) counties in 42 states and DC reported 14,122 dead WNV-infected birds (7,719 crows, 4,948 blue jays, and 1,455 birds of 92 other species). Infected birds were collected from January 10 to November 7, and the peak number of infected birds occurred during the week ending August 10. Of 10,036 tested dead crows, 7,719 (77%) were WNV-positive compared with 6,403 (40%) of 16,132 birds from other species. In 2002, a total of 9,144 (99.9%) of 9,157 reported nonhuman mammal cases occurred in equines, and 13 occurred in other species (dogs [three], squirrels [eight], and unspecified species [two]). Cases were reported from 1,374 counties in 38 states, with illness onset dates ranging from January 3 to November 8. Six states (Illinois [1,116 cases], Texas [1,050], Minnesota [945], Indiana [704], Kansas [675], and South Dakota [653]) accounted for 56% of reported nonhuman mammal cases. A limited number of counties and states tested mosquitoes (639 counties in 37 states and DC), wild-caught birds (65 counties in eight states), and sentinel chickens (92 counties in eight states) as part of WNV surveillance. In 2002, approximately 1.3 million mosquitoes of 88 species were tested. WNV was detected in 4,943 pools (representing 26 species) from 315 counties in 28 states and DC. Culex mosquitoes (Cx. pipiens, Cx. restuans, Cx. salinarius, Cx. quinquefasciatus, and Cx. tarsalis) accounted for 2,717 (55%) WNV-positive pools. WNV was reported for the first time in seven mosquito species (Aedes aegypti, Anopheles walkeri, Cx. erraticus, Cx. tarsalis, Cx. territans, Culiseta inornata, and Psorophora ciliata). Since 1999, a total of 36 WNV-infected mosquito species have been reported to ArboNET. In 2002, a total of 144 seropositive wild-caught birds were reported from 25 counties in four states (Indiana, Kansas, Louisiana, and Ohio), and 366 seroconverting captive sentinel birds were reported from 47 counties in seven states (Florida, Iowa, Nebraska, New York, North Carolina, Pennsylvania, and Texas). First Indicators of WNV ActivityAmong 2,289 counties reporting WNV activity in 2002, the first indicator of activity was a WNV-infected dead bird in 1,420 (62%) counties, an equine case in 660 (29%) counties, a human case in 84 (4%) counties, a seroconverting sentinel bird in 18 (0.8%) counties, an infected mosquito pool in 77 (3%) counties, and a seropositive wild-caught bird in six (0.2%) counties. In 24 counties, WNV activity was first detected on the same date by at least two surveillance mechanisms. In 531 (86%) of 619 counties reporting human cases, the first human illness onset was preceded by reports of a dead WNV-infected bird, infected equine, seroconverting sentinel chicken, or infected mosquito pool by a median of 33 days (range: 1--252 days). Of the 2,289 counties with WNV activity, 1,670 (73%) counties detected enzootic WNV activity but no human infections. Reported by: CC Chow, MD, SP Montgomery, DVM, DR O'Leary, DVM, RS Nasci, PhD, GL Campbell, MD, AM Kipp, JA Lehman, K Olson, P Collins, AA Marfin, MD, Div of Vector-Borne Infectious Diseases, National Center for Infectious Diseases, CDC. Editorial Note:The 2002 WNV epidemic in the United States was the largest arboviral meningoencephalitis epidemic documented in the western hemisphere and the largest reported WNME epidemic. Epizootic and epidemic activity was most intense in the central United States, especially the Great Lakes region, and extended to the west coast. One human case reported in a Los Angeles County, California, resident with no known travel history (and with no other WNV activity found statewide) and a report of a WNV-infected horse in Island County, Washington, indicate the complete transcontinental movement of WNV within 3 years. In 2002, Canadian health authorities also documented WNV activity in five provinces (Manitoba, Nova Scotia, Ontario, Quebec, and Saskatchewan) (2). The 2002 WNV epidemic included the first documented cases of person-to-person WNV transmission through organ transplantation, blood and blood product transfusion, and possibly breastfeeding (3,4). Also in 2002, intrauterine infection was reported (5), and a poliomyelitis-like syndrome was first recognized in the United States among some WNME patients with acute flaccid paralysis (AFP) (6). Nationally, the epidemic peak of human WNV-associated illness during 2002 occurred in late August; human cases in southern states preceded those in northern states by approximately 1 month. In 2002, human cases also were reported from the New York City metropolitan area for the fourth consecutive year. This prolonged and continued widespread transmission to humans, including in areas of previous epidemic activity, underscores the importance of maintaining human surveillance programs from early June through November and the need to consider WNV disease in the differential diagnosis of encephalitis, meningitis, AFP, and nonspecific febrile illness before and after the late summer months in which arboviral outbreaks traditionally occur. The 2002 WNV epidemic is similar to the 1975 St. Louis encephalitis (SLE) epidemic, which produced approximately 2,100 reported human illnesses and 170 fatalities (case-fatality ratio: 8%), primarily in the Mississippi and Ohio River basins (7). WNV and SLE virus are closely related; both are transmitted primarily by Culex mosquitoes and amplified in birds. However, SLE virus is not an avian or equine pathogen. In 2002, the proportion of human cases reported with WNF was greater than in previous years. This change probably reflects increased testing and diagnosis of WNV infection in persons with milder illness. WNF patients tend to be younger than patients with WNME (8). The somewhat lower median age among persons with WNME reported in 2002 compared with those reported during 1999--2001 (59 years versus 66 years) could reflect the incorrect classification of some WNF cases as WNME cases. The median age among persons with fatal WNME reported in 2002 was similar to that in previous years. Although older persons are at higher risk for WNME and death, persons of any age might develop severe neurologic disease. Bird- and horse-based surveillance are important tools for monitoring the geographic spread of WNV and for signaling WNV activity in an area before the recognition of human illnesses. The number of counties reporting WNV-infected dead birds in 2002 was five times greater than that in 2001, and the number of reported WNV-infected dead birds doubled (1). In 2002, crows, blue jays, and other members of the family Corvidae accounted for 90% of WNV-infected birds, and crows had the highest rate of WNV infection. State and local health department surveillance programs should continue to emphasize the collection and testing of dead corvids. Because noncorvid bird species were the first indicator of WNV activity in 144 (6%) counties, surveillance programs should include these species when possible. From 2001 to 2002, equine cases reported to ArboNET increased 12-fold, and equine transmission occurred over a longer season and in nine new states (1). In 2002, the geographic and temporal distribution of equine cases closely paralleled the human epidemic in the midwestern and north-central states, suggesting that horses, although unlikely to contribute to the transmission cycle for WNV (9), might be useful indicators of increased human risk in those areas. The three Culex species that produced the most WNV-positive pools during 2002, Cx. pipiens, Cx. quinquefasciatus, and Cx. restuans, are among the most important WNV epizootic or epidemic vectors in the United States. During 1999--2002, an additional 33 mosquito species also were found infected with WNV. These include Cx. nigripalpus, the principal epidemic vector of SLE in Florida, and Cx. tarsalis, an important vector of SLE and western equine encephalitis in the western states. Although other species (e.g., Ochlerotatus triseriatus, Ae. albopictus, Ae. aegypti) might contribute to human WNV transmission, control of Culex mosquitoes continues to be the most important strategy to reduce the risk for WNV transmission to humans. The ArboNET data summarized in this report probably underestimate the actual geographic distribution and intensity of WNV virus transmission in the United States for at least three reasons. First, although dead bird surveillance is important in monitoring WNV activity, only 27% of reported dead birds in 2002 were submitted for testing, compared with 50% in 2001. Many state and local health departments were overwhelmed by the large numbers of samples submitted for WNV testing and discontinued dead bird testing during the transmission season. Second, because data provided by the 54 ArboNET coordinators are derived primarily from local health unit surveillance efforts, which vary according to local capacity and priorities, some animal and human surveillance data might not yet be reported and confirmed. Finally, states might vary in their interpretation of and adherence to the national surveillance case definition of arboviral encephalitis/meningitis, and no standard national case definition for WNF exists. The epidemic of 2002 underscores the continued need for intensive ecologic surveillance to detect early-season WNV activity. To decrease the risk for human WNV infection, the coordinated and phased public health response to detection of WNV activity in an area should include intensified mosquito-control activities that reduce the avian-mosquito amplification cycle. Prevention activities should continue to include 1) public education programs urging residential source reduction and personal protective measures to reduce mosquito exposure; 2) development of long-term, community-level, integrated mosquito surveillance and control programs (10); and 3) high-priority emphasis on the control of Culex mosquitoes, especially in urban and suburban areas. Acknowledgments This report is based on data prepared by ArboNET surveillance coordinators in local and state health departments and ArboNET technical staff, Div of Vector-Borne Infectious Diseases, National Center for Infectious Diseases, CDC. References
* Because surveillance data reported on state health department web sites but not yet reported to ArboNET are not included in this summary report, the number of human cases reported from 2002 in this summary might differ from those reported in preceding 2002 MMWR weekly updates. † East South Central region: Alabama, Kentucky, Mississippi, and Tennessee; South Atlantic region: Delaware, the District of Columbia, Florida, Georgia, Maryland, North Carolina, South Carolina, Virginia, and West Virginia; West South Central region: Arkansas, Louisiana, Oklahoma, and Texas; and Pacific region: California. § East North Central region: Illinois, Indiana, Michigan, Ohio, and Wisconsin; Mid-Atlantic region: New Jersey, New York, and Pennsylvania; Mountain region: Colorado, Montana, and Wyoming; New England region: Connecticut, Massachusetts, and Rhode Island; West North Central region: Iowa, Kansas, Minnesota, Missouri, Nebraska, and South Dakota.
|
Use of trade names and commercial sources is for identification only and does not imply endorsement by the U.S. Department of
Health and Human Services. |
Disclaimer All MMWR HTML versions of articles are electronic conversions from ASCII text into HTML. This conversion may have resulted in character translation or format errors in the HTML version. Users should not rely on this HTML document, but are referred to the electronic PDF version and/or the original MMWR paper copy for the official text, figures, and tables. An original paper copy of this issue can be obtained from the Superintendent of Documents, U.S. Government Printing Office (GPO), Washington, DC 20402-9371; telephone: (202) 512-1800. Contact GPO for current prices.
**Questions or messages regarding errors in formatting should be addressed to mmwrq@cdc.gov.Page converted: 12/19/2002
|
|
|||||
|
HOME |
ABOUT MMWR |
MMWR SEARCH |
DOWNLOADS |
RSS
|
CONTACT
|
|||||
|
|
|||||
|
This page last reviewed 12/19/2002