|
|
|
|
|
|
|
| ||||||||||
|
|
|
|
|
|
|
||||
| ||||||||||
|
|
|
|
|
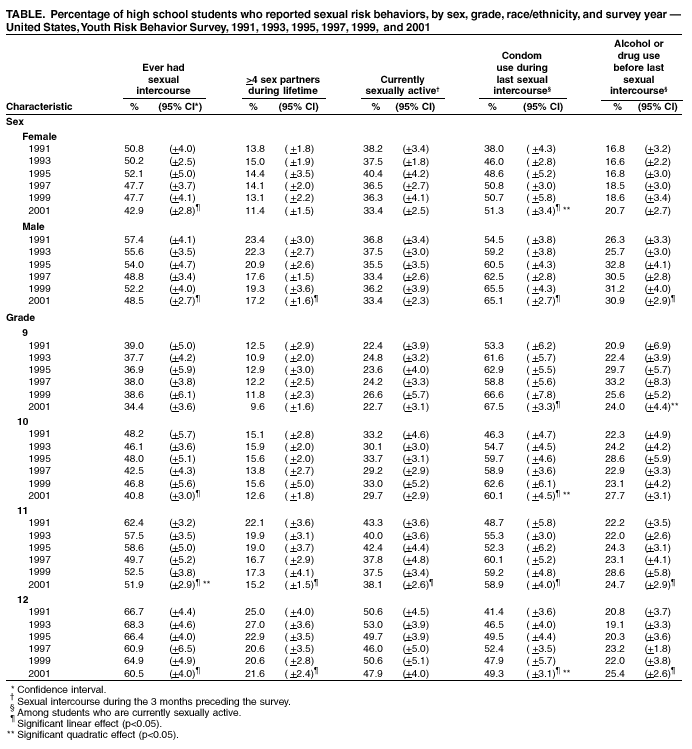
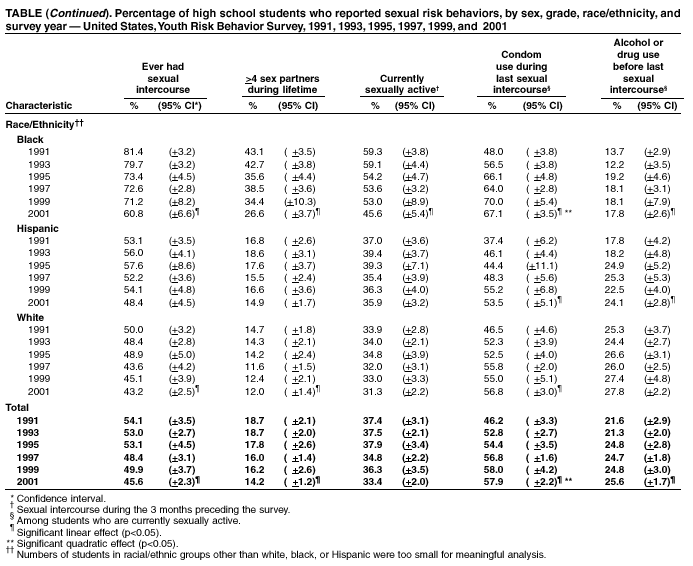
Persons using assistive technology might not be able to fully access information in this file. For assistance, please send e-mail to: mmwrq@cdc.gov. Type 508 Accommodation and the title of the report in the subject line of e-mail. Trends in Sexual Risk Behaviors Among High School Students --- United States, 1991--2001Unprotected sexual intercourse places young persons at risk for human immunodeficiency virus (HIV) infection, other sexually transmitted diseases (STDs), and unintended pregnancy. Responsible sexual behavior among adolescents is one of the 10 leading health indicators of the national health objectives for 2010 (objective 25.11) (1). To examine changes in sexual risk behavior that occurred among high school students in the United States during 1991--2001, CDC analyzed data from six national Youth Risk Behavior surveys (YRBS). This report summarizes the results of the analysis, which indicate that, during 1991--2001, the percentage of U.S. high school students who ever had sexual intercourse and the percentage who had multiple sex partners decreased. Among students who are currently sexually active, the prevalence of condom use increased, although it has leveled off since 1999. However, the percentage of these students who used alcohol or drugs before last sexual intercourse increased. Despite decreases in some sexual risk behaviors, efforts to prevent sexual risk behaviors will need to be intensified to meet the national health objective for responsible sexual behavior. YRBS, a component of CDC's Youth Risk Behavior Surveillance System, measures the self-reported prevalence of health risk behaviors among adolescents through representative national, state, and local surveys. The six biennial national surveys conducted during 1991--2001 used independent, three-stage cluster samples to obtain cross-sectional data representative of students in grades 9--12 in all 50 states and the District of Columbia. During 1991--2001, sample sizes ranged from 10,904 to 16,296 students, school response rates ranged from 70% to 79%, student response rates ranged from 83% to 90%, and overall response rates ranged from 60% to 70%. For each cross-sectional survey, students completed an anonymous, self-administered questionnaire, which included identically worded questions about sexual intercourse, number of sex partners, condom use, and alcohol or drug use before last sexual intercourse. Sexual experience was defined as ever having had sexual intercourse. Having multiple sex partners was defined as having had four or more sex partners during one's lifetime. Current sexual activity was defined as having had sexual intercourse during the 3 months preceding the survey. Condom use was defined as having used a condom at last sexual intercourse among currently sexually active students. Alcohol or drug use was defined as having used alcohol or drugs before last sexual intercourse among currently sexually active students. Race/ethnicity-specific trends are presented only for non-Hispanic black, non-Hispanic white, and Hispanic students because the numbers of students from other racial/ethnic groups were too small for meaningful analysis. Data were weighted to provide national estimates, and SUDAAN was used for all data analysis. Overall temporal changes were analyzed by using logistic regression analyses that assessed linear and quadratic time effects simultaneously and that controlled for sex, race/ethnicity, and grade. Similarly, temporal changes for sex, race/ethnicity, and grade subgroups were analyzed by using separate logistic regression analyses that assessed linear and quadratic time effects in one type of subgroup while holding the other two constant. Quadratic trends indicated a significant but nonlinear trend in the data over time. When a significant quadratic trend accompanied a significant linear trend, the data demonstrated some nonlinear variation (e.g., leveling off or change in direction) in addition to a linear trend. During 1991--2001, the prevalence of sexual experience decreased 16% among high school students. Logistic regression analysis indicated a significant linear decrease overall and among female, male, 10th-grade, 11th-grade, 12th-grade, black, and white students (Table). Among 11th-grade students, a significant quadratic trend also was detected, indicating that the prevalence of sexual experience declined during 1991--1997 and then leveled off. Prevalence of sexual experience did not decrease significantly among 9th-grade or Hispanic students. During 1991--2001, the prevalence of multiple sex partners decreased 24%. A significant linear decrease was detected overall and among male, 11th-grade, 12th-grade, black, and white students (Table). Prevalence of multiple sex partners did not show a significant linear decrease among female, 9th-grade, 10th-grade, or Hispanic students. During 1991--2001, the overall prevalence of current sexual activity did not change. However, the prevalence of current sexual activity decreased 12% among 11th-grade students and 23% among black students (Table). Among students who are currently sexually active, a significant linear and quadratic trend was observed in the overall prevalence of condom use, indicating an increase in condom use during 1991--1999 and then a leveling off by 2001. A similar pattern was detected among female, 10th-grade, 12th-grade, and black students with the prevalence of condom use peaking in 1997 or 1999 and then leveling off. A significant linear increase in condom use was detected among male, 9th-grade, 11th-grade, Hispanic, and white students. During 1991--2001, the prevalence of alcohol or drug use before last sexual intercourse among students who are currently sexually active increased 18%. Logistic regression analysis indicated a significant linear increase overall and among male, 11th-grade, 12th-grade, black, and Hispanic students (Table). Among 9th-grade students, a significant quadratic trend was detected, indicating that the prevalence of alcohol or drug use before last sexual intercourse increased during 1991--1997 and then decreased. Prevalence of alcohol or drug use before last sexual intercourse did not show a significant linear increase among female, 10th-grade, or white students. Reported by: N Brener, PhD, R Lowry, MD, L Kann, PhD, L Kolbe, PhD, Div of Adolescent and School Health; J Lehnherr, Div of Reproductive Health, National Center for Chronic Disease Prevention and Health Promotion; R Janssen, MD, Div of HIV/AIDS Prevention; H Jaffe, MD; Div of STD Prevention, National Center for HIV, STD, and TB Prevention, CDC. Editorial Note:During 1971--1979, the percentage of females aged 15--19 years living in metropolitan areas nationwide who ever had sexual intercourse increased from 30% to 50% (2); during 1982--1988, the percentage of females aged 15--19 years nationwide who ever had sexual intercourse increased from 47% to 53% (3). The findings in this report indicate that, during 1991--2001, the percentages of high school students who ever had sexual intercourse and multiple sex partners decreased, and the percentage of sexually active students who used a condom at last sexual intercourse increased and then leveled off. Overall, fewer high school students are engaging in behaviors that might result in pregnancy and STDs, including HIV infection. This decrease in health risk behaviors corresponds to a simultaneous decrease in gonorrhea, pregnancy, and birth rates among adolescents (4--7). These improvements in health outcomes probably resulted from the combined efforts of parents and families, schools, community organizations that serve young persons, health-care providers, religious organizations, the media, and government agencies to reduce sexual risks among young persons. For example, the percentage of high school students who received HIV-prevention education in school increased from 83% in 1991 to 92% in 1997 and then leveled off to 89% in 2001 (CDC, unpublished data, 2002). The findings in this report are subject to at least two limitations. First, these data pertain only to adolescents who attend high school. In 1998, 5% of those aged 16--17 years were not enrolled in a high school program and had not completed high school (8). Second, although the survey questions demonstrate good test-retest reliability (9), the extent of underreporting or overreporting in YRBS cannot be determined. One of the national health objectives for 2010 is to increase from 85% to 95% the proportion of adolescents in grades 9--12 who have never had sexual intercourse, have had sexual intercourse but not during the preceding 3 months, or used a condom the last time they had sexual intercourse during the preceding 3 months (1). In 2001, 86% of high school students met this objective, compared with 80% in 1991. Efforts to prevent sexual risk behaviors will need to be intensified to meet the 2010 objective; to sustain decreases in gonorrhea, pregnancy, and birth rates among adolescents; and to reduce HIV infections and other STDs among young persons. In 1998, the birth rate in the United States was 52.1 per 1,000 females aged 15--19 years, four times higher than the average rate among nations in the Organization for Economic Cooperation and Development (10). In addition, interventions are needed to reverse the increasing percentage of sexually active high school students who use alcohol or drugs before their last sexual intercourse. References
Table
Disclaimer All MMWR HTML versions of articles are electronic conversions from ASCII text into HTML. This conversion may have resulted in character translation or format errors in the HTML version. Users should not rely on this HTML document, but are referred to the electronic PDF version and/or the original MMWR paper copy for the official text, figures, and tables. An original paper copy of this issue can be obtained from the Superintendent of Documents, U.S. Government Printing Office (GPO), Washington, DC 20402-9371; telephone: (202) 512-1800. Contact GPO for current prices. **Questions or messages regarding errors in formatting should be addressed to mmwrq@cdc.gov.Page converted: 9/26/2002 |
|||||||||
This page last reviewed 9/26/2002
|