 |
|
|
|
|
|
|
| ||||||||||
|
|
|
|
|
|
|
||||
| ||||||||||
|
|
|
|
|
Persons using assistive technology might not be able to fully access information in this file. For assistance, please send e-mail to: mmwrq@cdc.gov. Type 508 Accommodation and the title of the report in the subject line of e-mail. Pregnancy-Related Mortality Surveillance -- United States, 1987-1990Lisa M. Koonin, M.N., M.P.H., Andrea P. MacKay, M.S.P.H., Cynthia J. Berg, M.D., M.P.H., Hani K. Atrash, M.D., M.P.H., Jack C. Smith, M.S. Division of Reproductive Health National Center for Chronic Disease Prevention and Health Promotion Abstract Problem/Condition: The Healthy People 2000: National Health Promotion and Disease Prevention Objectives specifies goals of no more than 3.3 maternal deaths per 100,000 live births overall and no more than 5.0 maternal deaths per 100,000 live births among black women; as of 1990, these goals had not been met. In addition, race-specific differences between black women and white women persist in the risk for pregnancy-related death. Reporting Period Covered: This report summarizes surveillance data for pregnancy-related deaths in the United States for 1987-1990. Description of System: The National Pregnancy Mortality Surveillance System was initiated in 1988 by CDC in collaboration with the CDC/American College of Obstetricians and Gynecologists Maternal Mortality Study Group. Health departments in the 50 states, the District of Columbia, and New York City provided CDC with copies of death certificates and available linked outcome records (i.e., birth certificates or fetal death records) of all identified pregnancy-related deaths. Results: During 1987-1990, 1,459 deaths were determined to be pregnancy-related. The overall pregnancy-related mortality ratio was 9.2 deaths per 100,000 live births. The pregnancy-related mortality ratio for black women was consistently higher than for white women for every risk factor examined by race. The disparity between pregnancy-related mortality ratios for black women and white women increased from 3.4 times greater in 1987 to 4.1 times greater in 1990. Older women, particularly women aged greater than or equal to 35 years, were at increased risk for pregnancy-related death. The gestational age-adjusted risk for pregnancy-related death was 7.7 times higher for women who received no prenatal care than for women who received "adequate" prenatal care. The distribution of the causes of death differed depending on the pregnancy outcome; for women who died following a live birth (i.e., 55% of the deaths), the leading causes of death were pregnancy-induced hypertension complications, pulmonary embolism, and hemorrhage. Interpretation: Pregnancy-related mortality ratios for black women continued, as noted in previously published surveillance reports, to be three to four times higher than those for white women. The risk factors evaluated in this analysis confirmed the disparity in pregnancy-related mortality between white women and black women, but the reason(s) for this difference could not be determined from the available information. Actions Taken: Continued surveillance and additional studies should be conducted to assess the magnitude of pregnancy-related mortality, to identify those differences that contribute to the continuing race-specific disparity in pregnancy-related mortality, and to provide information that policy makers can use to develop effective strategies to prevent pregnancy-related mortality for all women. INTRODUCTION The Healthy People 2000: National Health Promotion and Disease Prevention Objectives for the United States listed maternal mortality as a priority area for improvement, including specific goals of no more than 3.3 maternal deaths per 100,000 live births overall, and no more than 5.0 maternal deaths per 100,000 live births among black women (1). These goals have not yet been achieved. Moreover, there have been continuing disparities in the risk for pregnancy-related death between black women and white women (2). The pregnancy-related mortality ratios (i.e., pregnancy-related deaths per 100,000 live births) for black women are more than three times higher than for white women (3). The results of previous research have indicated that most pregnancy-related deaths are preventable (4-6). A reduction in pregnancy-related deaths continues to be a primary public health objective (1,7). To further understand and evaluate the risk factors for and leading causes of pregnancy-related death, the National Pregnancy Mortality Surveillance System was initiated in 1988 by CDC's Division of Reproductive Health, National Center for Chronic Disease Prevention and Health Promotion, in collaboration with the CDC/American College of Obstetricians and Gynecologists (ACOG) Maternal Mortality Study Group (8). This system provides ongoing surveillance of all pregnancy-related deaths identified through the individual state systems and through other sources of reporting. This report summarizes the analysis of identified pregnancy-related deaths in the United States from 1987 through 1990 (i.e., the year for which the most recent information is available). METHODS Health departments in the 50 states, the District of Columbia, New York City, and Puerto Rico provided CDC with copies of death certificates and available matched pregnancy-outcome records (i.e., birth certificates or fetal death records) for all identified pregnancy-related deaths during 1987-1990. A woman's death was classified as pregnancy-related if it occurred during pregnancy or within 1 year after the pregnancy and resulted from a) complications of the pregnancy, b) a chain of events that was initiated by the pregnancy, or c) the aggravation of an unrelated condition by the physiologic or pharmacologic effects of the pregnancy (8). A woman's death was considered to be a potential pregnancy-related death if a) a pregnancy check box was marked on the death certificate, b) the death certificate otherwise indicated that the woman was pregnant at the time of death, or c) the woman's death certificate was matched with a birth certificate or fetal death record for a delivery that occurred within 1 year before the woman's death. Information concerning each death was reviewed by experienced clinical epidemiologists to determine whether it was a pregnancy-related death. Deaths were classified using a system designed in collaboration with members of the CDC/ACOG Maternal Mortality Study Group (8). Several of the variables stated on the death certificate that were examined included the immediate and underlying causes of death, any associated obstetrical conditions or complications, and the outcome of pregnancy. Information was obtained from death certificates (including notes written on the margins of death certificates), maternal mortality review committee reports and autopsy reports, and matched birth and fetal death certificates. Pregnancy-related mortality ratios were calculated by using live-birth data obtained from the 1987-1990 national natality files compiled by CDC's National Center for Health Statistics (9-12). Although data regarding pregnancy-related deaths in Puerto Rico were available, published natality data included only the births that occurred in the 50 states, the District of Columbia, and New York City; therefore, pregnancy-related deaths in Puerto Rico were not included in this analysis. Cornfield's method was used to calculate risk ratios with 95% confidence intervals (13). To control for the effects of age, pregnancy-related mortality ratios for marital status were age-adjusted by direct standardization (14). The standard population comprised all women who had a live birth during 1987-1990 (9-12). Matched outcome certificates (i.e., birth certificates and fetal death certificates) were available for most women who delivered a live-born or stillborn infant. These outcome certificates provided data not available on the death certificate. No outcome certificates were available for women who had an ectopic pregnancy, women who had an abortion (i.e., either spontaneous or induced), and women who died before delivery (i.e., "undelivered"). The women's ages were grouped into standard 5-year intervals. Women aged 40-49 years were included in a single group, greater than or equal to 40 years. For the analysis of race, women were classified as white, black, or "other." Other races included Asian/Pacific Islander, American Indian/Alaskan Native, and those reported as "other." Because of the small number of women in the "other" category, most analyses by race were limited to white women and black women. Hispanic women were classified by their reported racial group. For both the numerator and denominator of pregnancy-related mortality ratios, race was defined as the race of the mother. The risk for pregnancy-related death by years of education was determined from information on matched outcome certificates for women whose pregnancy outcome was a live birth or a stillbirth. The analysis of education was further restricted to women aged greater than or equal to 20 years, an age by which most women would have had the opportunity to graduate from high school. The state of Washington did not report education on birth certificates during the 4-year surveillance period, and three other states -- California, New York (excluding New York City), and Texas -- did not report education on the birth certificate during some years of the surveillance period. Women who died in those four states during the specific years when education was not reported were excluded from the analysis of education. Information concerning the adequacy of prenatal care was limited to women who delivered a live-born infant, because the information about prenatal care that was recorded on fetal death certificates was insufficient for analysis. No information regarding prenatal care was available for women who had pregnancies with ectopic or abortive (spontaneous or induced) outcomes or who were undelivered at the time of death. Deaths that occurred in California during 1987-1988 also were excluded from the analysis of adequacy of prenatal care because all three components necessary to calculate prenatal care adequacy (i.e., gestational age, the month prenatal care began, and the number of prenatal visits) were not reported consistently for those years. The level of prenatal care was assessed by using a modification of the adequacy of prenatal care use (APCU) index developed by Kotelchuck (15). The APCU index measures the adequacy of prenatal care by a) the timing of the first prenatal visit and b) the appropriateness of the number of visits based on gestational age (i.e., at the first prenatal visit and at delivery). The modified index used for the purposes of this report classified the level of prenatal care into one of the following four categories (Table_1B): This index differs from the APCU index in that the "intermediate" category of prenatal care described by Kotelchuck was combined with the category for "inadequate" care, because both levels represented less than adequate prenatal care (15). A category also was included for women who received no prenatal care. To control for the confounding effect of gestational age, direct standardization (14) was used to calculate a gestational age-adjusted rate for adequacy of prenatal care. The standard population was based on the distribution of gestational age (in weeks) for women whose prenatal care was "adequate" and who died following a live birth. A gestational age-adjusted rate for the adequacy of prenatal care by race could not be calculated because of the small number of deaths and the large proportion of unknown values for some categories. The relationship between the size of the delivery hospital and pregnancy-related mortality was assessed by using the size of the hospital obstetric service (in terms of the number of live births per year {American Hospital Association, unpublished data}) as the determinant of hospital size. The hospital size groups were as follows: less than 300, 300-999, 1,000-1,999, 2,000-2,999, and greater than or equal to 3,000 live births per year. The analysis of hospital size was limited to women who died following a live birth or a stillbirth. If a matched outcome record was unavailable for a woman, then the size of the hospital in which the woman died, instead of the size of the delivery hospital, was used for this analysis. Live-birth order was assessed for women who died after delivering a live-born infant. Although birth and fetal death certificates provided information regarding past pregnancy outcomes, the natality files (used for denominators for ratio calculations) only provided information regarding live-birth order. The assessment of the time interval between delivery and death was restricted to women who had either a live birth or a stillbirth because information concerning the interval between termination of pregnancy and maternal death was not available for women who died after other pregnancy outcomes or who were undelivered at the time of death. All unknown, not stated, or missing information -- which accounted for less than or equal to 20% of the total for each variable -- were proportionally redistributed in known categories. RESULTS A total of 1,618 potential pregnancy-related deaths were reported to CDC for 1987-1990. Seven deaths, although causally related to pregnancy, were excluded from this analysis because the time period between delivery and death exceeded 1 year. In addition, the analysis excluded 151 deaths that occurred within 1 year after delivery (i.e., because the causes of death were not directly related to pregnancy) and one death that was classified as unknown as to whether the death was linked to a pregnancy. The remaining 1,459 deaths were used as the basis of this analysis. A matched birth certificate was available for 95% of deaths following a live birth, and a matched fetal death certificate was available for 86% of deaths following a stillbirth. The number of pregnancy-related deaths and the pregnancy-related mortality ratios in this analysis differed slightly from previously published reports (17) because of subsequently received or updated information. The overall pregnancy-related mortality ratio for the 4-year surveillance period was 9.2 deaths per 100,000 live births; the ratio increased sharply from 1987 (7.2 deaths per 100,000 live births) to 1988 (9.5 per 100,000), and then increased slightly to 10.0 per 100,000 over the following 2 years (Table_1). Women who were aged greater than or equal to 30 years had a higher risk for pregnancy-related death than younger women (Table_2). Women aged 35-39 years had a 2.6 times higher risk for death than women aged 25-29 years; this risk increased to 5.9 times higher for women aged greater than or equal to 40 years. Race was strongly associated with pregnancy-related mortality -- particularly for black women, who were almost four times more likely to die from pregnancy-related causes than were white women (Table_3). The difference between pregnancy-related mortality ratios for black women and white women increased from 3.4 in 1987 to 4.1 in 1990. The risk for pregnancy-related mortality was 1.6 times higher for women of other races than for white women. Age-specific pregnancy-related mortality ratios were higher for black women than for white women at all ages (Figure_1). The risk for pregnancy-related death was 10.2 times greater for black women aged greater than or equal to 40 years than the risk for black women aged 20-24 years; the risk was 5.0 times greater for white women aged greater than or equal to 40 years than the risk for white women aged 20-24 years. In comparison with pregnancy-related mortality ratios for white women, ratios for black women increased sharply with age, beginning with women aged 25-29 years. This difference was most pronounced at ages greater than or equal to 40 years (i.e., the ratio was 6.4 times higher for black women). The most common pregnancy outcome associated with a pregnancy-related death was a live birth (55%), followed by an ectopic pregnancy (11%), an undelivered pregnancy (7%), or a stillbirth (7%) (Figure_2). For white women, 58% of pregnancy-related deaths followed a live birth, compared with 49% for black women (Table_4). More pregnancy-related deaths followed ectopic pregnancies and abortions (spontaneous and induced) among black women (14% and 7%, respectively) than among white women (8% and 4%, respectively). In contrast, 70% of deaths among women of "other" races were associated with a live birth outcome; 7% of deaths among these women were associated with an ectopic pregnancy, and 6% were associated with an abortion. The risk for pregnancy-related death among unmarried women was almost twice the risk among married women. After adjustment for age, the pregnancy-related mortality ratio was 18.1 deaths per 100,000 live births for all unmarried women and 7.0 for all married women (Figure_3). The age-adjusted pregnancy-related mortality ratio for unmarried white women was 2.1 times greater than that for married white women (11.6 vs. 5.5 deaths per 100,000 live births), whereas this same ratio for unmarried black women was 1.3 times greater than that for married black women (29.0 vs. 23.1 deaths per 100,000 live births). For women of "other" races, the age-adjusted pregnancy-related mortality ratio for unmarried women differed slightly compared with that for married women (9.2 vs. 8.1 deaths per 100,000 live births). For all women, the risk for pregnancy-related death following a live birth or a stillbirth significantly decreased with increasing levels of education for women aged greater than or equal to 25 years (Figure_4). The educational level of women aged 20-24 years did not affect the risk for pregnancy-related death. Age-specific pregnancy-related mortality ratios for black women were consistently higher than ratios for white women at all levels of education. Among white women aged greater than or equal to 25 years, the risk for pregnancy-related death for those who had less than or equal to 12 years of education was almost twice that for women who had greater than 12 years of education. Regardless of educational level, however, the risk for pregnancy-related death among black women of all ages did not differ significantly. Of all the women who died following a live birth, 9% had not received prenatal care. The crude rate of pregnancy-related death was 7.7 times higher for women who received no prenatal care than for women who received "adequate" care (Table_5). When adjusted for gestational age, the rate declined to 6.2 times higher for women who received no prenatal care than for women who received "adequate" care (Figure_5). When compared with women who received some level of prenatal care, women who received no prenatal care were more likely to have had four or more previous live births and to be unmarried and less educated. After adjustment for gestational age, the risk for pregnancy-related death was slightly higher for women who received "inadequate" prenatal care than for women who received "adequate" care (relative risk {RR}=1.7). In addition, the gestational age-adjusted risk for pregnancy-related death was 1.8 times higher for women who received prenatal care categorized as "adequate plus" than for women who received "adequate" care. Mortality rates for all categories of prenatal care were higher for black women and women of other races than for white women (Table_5). Approximately 8% of white women and 11% of black women who died from pregnancy-related causes received no prenatal care. The risk associated with receiving no prenatal care compared with receiving "adequate" care was greater for white women (RR=7.8) and women of other races (RR=12.7) than for black women (RR=3.7). Of all women whose pregnancies resulted in a live birth, the risk for pregnancy-related death increased with increasing live-birth order, beginning with women delivering their third live-born infant (Table_6). The mortality rate was approximately three times greater for women following delivery of a fifth or higher-order live-born infant than for women following a second live birth. Although few pregnancy-related deaths were reported for adolescents (i.e., females aged less than 20 years), the risk for pregnancy-related death was 10-11 times higher for adolescents following delivery of a fourth live-born infant in comparison with those delivering a first through third live-born infant. For both white women and black women, the risk for pregnancy-related death for women who had a fifth or higher-order live birth was 2.6 times greater than that for women with the lowest rate of pregnancy-related death. For white women of all ages, this risk was lowest following the second live birth; for black women of all ages, the risk was lowest for women following the first live birth. Although the risk for death associated with live-birth order for all women was lowest after delivery of the second live-born infant, the disparity in the risk for death between black women and white women after delivery of the second live-born infant was greater than the risk for any other live-birth-order category. The leading causes of death differed by pregnancy outcome (Table_7). The leading causes of death for women who died after a live birth were pregnancy-induced hypertension complications, pulmonary embolism (mostly thrombotic and amniotic fluid embolism), hemorrhage (primarily from postpartum atony, complications from disseminated intravascular coagulation, and abruptio placentae), and infection. For women whose pregnancies ended in a stillbirth, the leading causes of death were hemorrhage (from abruptio placentae and uterine rupture), pregnancy-induced hypertension complications, and infection. Hemorrhage resulting from rupture of the ectopic site accounted for almost 95% of deaths associated with ectopic pregnancies. Among women whose pregnancies ended in a spontaneous or induced abortion, infection was the cause of death for almost half of the women; most of the remaining deaths resulted from hemorrhage, pulmonary embolism, and anesthesia complications. Women who had molar pregnancies died from a variety of causes. Women who were still pregnant (undelivered) at the time of death most frequently died from thrombotic and amniotic fluid embolism, hemorrhage from abruptio placentae, and infection. Hemorrhage was the immediate cause of death for 418 (29%) women regardless of pregnancy outcome; however, for an additional 83 (6%) women, hemorrhage was an associated condition contributing to death. Two hundred eighty-eight (20%) women died from pulmonary embolism; for another 67 (5%) women, embolism was an associated condition. Pregnancy-induced hypertension was the immediate cause of death for 257 (18%) women, and it was an associated condition for an additional 67 (5%) women. The cause-specific pregnancy-related mortality ratios for all causes of death were higher for black women than for white women or women of other races, with hemorrhage, pulmonary embolism, and pregnancy-induced hypertension the leading causes of death for each race group. The risk for pregnancy-related death for each cause of death was approximately three to four times greater for black women compared with white women. However, the risk for death as a result of cardiomyopathy and complications of anesthesia was six to seven times greater for black women than for white women. The risk for pregnancy-related death was highest for women who delivered a live-born or stillborn infant in a hospital with 2,000-2,999 live births per year (7.2 deaths per 100,000 live births) and lowest in hospitals with less than 300 live births per year (3.3 per 100,000) (Table_8). Cause-specific pregnancy-related mortality ratios differed for women by hospital size groups. The cause-specific pregnancy-related mortality ratios for deaths resulting from pulmonary embolism were highest for hospitals with less than 300 live births per year, and the ratios for deaths resulting from pregnancy-induced hypertension were highest for hospitals with greater than or equal to 2,000 live births per year. Information regarding the specific time interval between delivery and death was unknown for 38 of the 904 women who died following a live birth or stillbirth. Of the remaining 866 women, most (550 {64%}) died within the first week after delivery; more than half of these deaths occurred within 1 day after delivery (Figure_6). Overall, 803 (93%) of these deaths occurred within 42 days after delivery. Of the 63 (7%) women who died between 43 days and 1 year after delivery, 23 (37%) died as a result of cardiomyopathy, and nine (14%) as a result of pulmonary embolism. Approximately half of all deaths attributed to cardiomyopathy during the surveillance period occurred greater than 42 days after delivery. DISCUSSION Trends in Pregnancy-Related Mortality During 1987-1990, the projected Healthy People 2000 (1) goal that called for a reduction in maternal mortality was not met overall or for any racial/ethnic group. After a steady decline in the reported pregnancy-related mortality ratios from 1979 through 1986 (3), the reported mortality ratios increased from 7.2 pregnancy-related deaths per 100,000 live births in 1987 to 10.0 in 1990. This increase in the pregnancy-related mortality ratio probably reflected the improved surveillance system and reporting guidelines initiated in 1988 (8,17). Race-Specific Disparities Pregnancy-related mortality ratios continued to be three to four times higher for black women than for white women (2,3,17). The risk for pregnancy-related death was consistently higher among black women than among white women for every factor evaluated by race in this analysis. As noted in previously published reports, the risk for death associated with age differed for black women and white women. The difference in the risk for death between black women and white women widened with increasingly older maternal age; the pregnancy-related mortality ratios for black women aged greater than or equal to 35 years were particularly high in comparison with white women in the same age group (3,18). Higher levels of education were associated with decreased pregnancy-related mortality ratios among white women; however, among black women, the risk for pregnancy-related death did not differ significantly by educational level (3,4). Although the risk for pregnancy-related death was higher among unmarried white women than among married white women, marital status was not a significant factor in the risk for pregnancy-related death among black women and women of other races (19). Although the risk for pregnancy-related death among white women was lowest for those delivering their second live-born infant, the greatest difference between black women and white women in the risk for death occurred among women delivering their second live-born infant. Pregnancy-related mortality rates for women of black and other races were higher at all levels of prenatal care than rates for white women. The reduction in mortality rates for women who received prenatal care compared with women who received no prenatal care was greater among white women than among black women. The results of several studies have suggested that the content of prenatal care might differ for black women and white women (20-22). Furthermore, even though more intensive monitoring is recommended during late pregnancy (i.e., the eighth and ninth months of gestation) (16,23), black women make fewer prenatal-care visits during this time period than do white women (24). Researchers have determined that black women, in comparison with white women, often receive fewer services and insufficient health-promotion education during their prenatal visits (21,25). The proportion of pregnancy-related deaths associated with ectopic pregnancy or abortion (spontaneous and induced) was greater among black women than among white women. The risk associated with most causes of pregnancy-related death was approximately three to four times higher for black women than for white women; the risk for pregnancy-related death resulting from cardiomyopathy and complications of anesthesia both were more than six times higher for black women than for white women. The risk factors evaluated in this surveillance system confirmed the race-specific differences in pregnancy-related death, but the reasons for the disparities could not be determined from the available information. Factors other than race alone -- probably factors not measurable through routine surveillance -- most likely played an important role in contributing to the increased risk for pregnancy-related death among black women. It remains unclear whether the racial disparity might be related to differences in the seriousness of morbidity, differences in co-existing risk factors or other conditions, differences in diagnosis and treatment of pregnancy-related complications, or some combination of all these factors. Some researchers have suggested that race may serve as a marker for other sociodemographic risk factors and cultural differences (26,27). The sources from which data were obtained for this surveillance system did not provide information concerning socioeconomic indices, family and community conditions, and other factors that might be associated with the differences in pregnancy-related mortality between black women and white women. Age As reported previously, older women were at increased risk for pregnancy-related death (3,17). Women aged greater than or equal to 40 years had six times the risk for pregnancy-related death in comparison with women aged 25-29 years. The risks for both chronic disease and complications of pregnancy increase with age; women aged greater than or equal to 35 years are at greater risk than younger women for many adverse reproductive health outcomes, including pregnancy-related mortality (18,28). Education Overall, women with a limited education were at higher risk for pregnancy-related death than women with more education, a finding consistent with previous studies (3,4). The risk for pregnancy-related death among women who had less than a high school education was much greater for older women than younger women. Prenatal Care High-quality prenatal-care services can prevent or identify problems and complications that arise during pregnancy, labor and delivery, and the postpartum period (23). The absence of prenatal care should be regarded as a sentinel health event (29). Although it has been suggested that assessing prenatal care by a measure of the content and quality is preferable to measuring the quantity of care and the timing of visits (30), the modified APCU index used in this analysis did not evaluate the content or quality of care, and the sources of information (i.e., the vital records) did not provide information that would enable such an assessment. In comparison with all women who delivered a live-born infant during 1987-1990, a greater proportion of women who died from pregnancy-related causes after delivering a live-born infant had received no prenatal care (9% vs. 2%, respectively) (9-12). Women who received any level of prenatal care had a lower risk for pregnancy-related mortality in comparison with women who received no prenatal care. In this analysis and in other previously published reports, women who received no prenatal care were more likely to be older, black, and unmarried; to have a higher number of live-born infants (i.e., four or more births); and to be less educated than women who had pre-natal care, including women who initiated such care during the third trimester of pregnancy (31). In addition to an elevated risk for pregnancy-related death among women who received no prenatal care, the risk for death was higher among women whose prenatal care was categorized as "adequate plus" than among women who received "adequate" care. Previous studies have indicated that women who receive more than the recommended number of prenatal visits are more likely to be at "high risk" and to have complicated medical conditions and/or pregnancy complications that could contribute to an increased risk for pregnancy-related death (3,15). Causes of Death This surveillance system and previous reports (19,32) identified the same leading causes of pregnancy-related death: hemorrhage, pulmonary embolism, and pregnancy-induced hypertension complications. Pregnancy-induced hypertension and pulmonary embolism accounted for the greatest number of deaths among both white women and black women who delivered a live-born infant. Hospital Size In contrast with a study that indicated the risk for pregnancy-related death was highest in the smallest (i.e., less than or equal to 300 deliveries per year) and largest hospitals (i.e., greater than or equal to 3,001 deliveries per year) (32), the analysis of pregnancy-related mortality surveillance data for 1987-1990 indicated that women who delivered at the smallest hospitals had the lowest pregnancy-related mortality ratio. However, women who died after delivery at the smallest hospitals also had the highest pregnancy-related mortality ratio associated with pulmonary embolism. The diagnosis and management of pulmonary embolism in the pregnant woman or recently pregnant woman is complex, and resources for its diagnosis and treatment may not be readily available at small hospitals (33). Data Limitations Although this analysis examined the various risk factors for pregnancy-related mortality during 1987-1990, several limitations of the analysis should be considered. Pregnancy-related death encompasses a complex combination of etiologies and pregnancy outcomes, and the underlying risk factors associated with death might vary with cause of death and/or pregnancy outcome. Even though the availability of matched birth and fetal death records improved the quality and quantity of the available information, the assessment of the pathophysiology and circumstances leading to pregnancy-related death and the determination of associated risk factors were limited by the absence of detailed clinical information. Despite improved ascertainment methods by some states during the surveillance period, greater than 50% of pregnancy-related deaths possibly were misclassified and were, therefore, undetected by routine surveillance methods (34-36). Because a mention of pregnancy or recent pregnancy is not always included on a woman's death certificate, some states have established a system whereby information contained in the vital records links the records of deaths of reproductive-aged women with records of concomitant live births and stillbirths. This process improves ascertainment of pregnancy-related deaths associated with live-birth or fetal-death outcomes. However, linkage of vital records does not identify pregnancy-related deaths that do not generate a record of pregnancy outcome (37). Such records include deaths resulting from ectopic pregnancies, deaths associated with spontaneous and induced abortion, and deaths that occur during pregnancy before delivery. Most pregnancy-related deaths were identified and classified by using routine information on vital records; therefore, the numbers and ratios understate the actual number of pregnancy-related deaths that occurred during the surveillance period (38). Public Health Measures Ascertainment of pregnancy-related deaths can be improved by computerized linkage of death certificates of reproductive-aged women with birth and fetal death certificates, pregnancy check boxes on death certificates, periodic review of deaths of reproductive-aged women, and ongoing birth registries and medical audits (38,39). Additional sources of data, including family interviews, may be necessary to understand the effects of socioeconomic status, access to and content of prenatal care, and social environment and lifestyle on the sequence of events that lead to pregnancy-related deaths. The continuing disparity in pregnancy-related mortality between white women and black women emphasizes the need to identify those differences that contribute to excess mortality among black women. Specific interventions should be developed to reduce pregnancy-related mortality among black women. Improved surveillance and additional research are needed to assess the magnitude of pregnancy-related deaths, further identify potential risk groups, and provide information that policy makers can use to develop effective strategies to prevent pregnancy-related mortality for all women. References
Table_1B Note: To print large tables and graphs users may have to change their printer settings to landscape and use a small font size.
                                                            Percentage of recommended visits
Level of prenatal care      Month prenatal care began       for prenatal care *
===============================================================================================
Adequate plus               <=4th month of pregnancy        >=110%
Adequate                    <=4th month of pregnancy        80%-109%
Inadequate                  <=4th month of pregnancy        <80%
                                       or
                            >=5th month of pregnancy        not applicable
No care                     None                            None
-----------------------------------------------------------------------------------------------
* Based on the American College of Obstetricians and Gynecologists standard for month of
  gestation.
===============================================================================================
Return to top. Table_1 Note: To print large tables and graphs users may have to change their printer settings to landscape and use a small font size.
TABLE 1. Number of live births, number of pregnancy-related deaths,
and pregnancy-related mortality ratio (PRMR),* by year of death
-- United States, 1987-1990
======================================================================
Year of death   No. of live births  No. of deaths    PRMR
----------------------------------------------------------------------
    1987             3,809,394            276         7.2
    1988             3,909,510            371         9.5
    1989             4,040,958            395         9.8
    1990             4,158,212            417        10.0

    Total           15,918,074          1,459         9.2
----------------------------------------------------------------------
* Pregnancy-related deaths per 100,000 live births.
======================================================================
Return to top. Table_2 Note: To print large tables and graphs users may have to change their printer settings to landscape and use a small font size.
TABLE 2. Number of pregnancy-related deaths, pregnancy-related mortality
 ratio (PRMR), * and risk ratio, by age -- United States, 1987-1990
==========================================================================
Age group (yrs)   No. of deaths   PRMR   Risk ratio        95% CI +
--------------------------------------------------------------------------
      <20               157        7.8       1.1       (0.92-1.35)
    20-24               306        7.1       1.0       (0.86-1.18)
    25-29               351        7.0    Referent
    30-34               367       11.1       1.6       (1.37-1.84)
    35-39               206       18.2       2.6       (2.18-3.10)
     >=40                72       41.6       5.9       (4.55-7.68)

    Total             1,459        9.2
--------------------------------------------------------------------------
* Pregnancy-related deaths per 100,000 live births.
+ Confidence interval.
==========================================================================
Return to top. Table_3 Note: To print large tables and graphs users may have to change their printer settings to landscape and use a small font size. TABLE 3. Number of pregnancy-related deaths, pregnancy-related mortality ratio (PRMR), * and risk ratio, by race + -- United States, 1987-1990 ==================================================================== Race No. of deaths PRMR Risk ratio 95% CI & -------------------------------------------------------------------- White 794 6.3 Referent Black 598 22.9 3.7 (3.28-4.06) Other @ 67 9.8 1.6 (1.21-2.02) Total 1,459 9.2 -------------------------------------------------------------------- * Pregnancy-related deaths per 100,000 live births. + Hispanic women were classified by their reported racial group. & Confidence interval. @ Includes Asian/Pacific Islander, American Indian/Alaskan Native, and those reported as "other." ==================================================================== Return to top. Figure_1 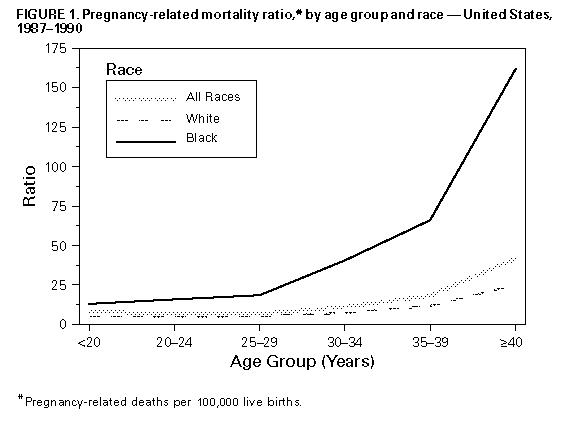 Return to top. Figure_2 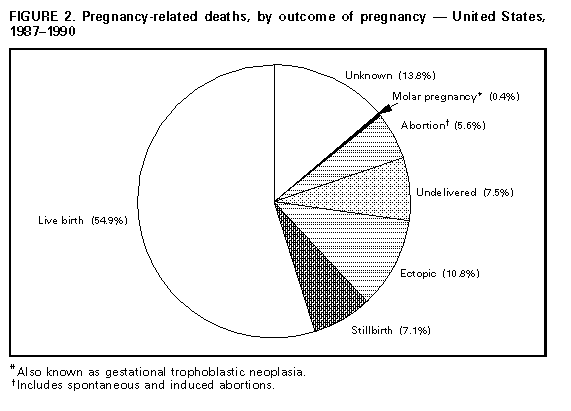 Return to top. Table_4 Note: To print large tables and graphs users may have to change their printer settings to landscape and use a small font size.
TABLE 4. Outcome of pregnancy and percentage of
pregnancy-related deaths, by race * -- United  States, 1987-1990
========================================================================
                             Race
                     -------------------------
Pregnancy outcome    White   Black    Other +
------------------------------------------------------------------------
Live birth            57.9    49.2     70.1
Stillbirth             8.2     5.5      7.5
Ectopic pregnancy      8.4    14.2      7.5
Abortion &             4.3     7.2      6.0
Undelivered            7.6     7.9      3.0
Molar pregnancy @      0.4     0.5      0.0
Unknown               13.2    15.6      6.0

Total **             100.0   100.0    100.0
------------------------------------------------------------------------
*  Hispanic women were classified by their reported racial group.
+  Includes Asian/Pacific Islander, American Indian/Alaskan Native,
   and those reported as "other."
&  Includes spontaneous and induced abortions.
@  Also known as gestational trophoblastic neoplasia.
** Percentages may not add to 100.0 due to rounding.
========================================================================
Return to top. Figure_3  Return to top. Figure_4 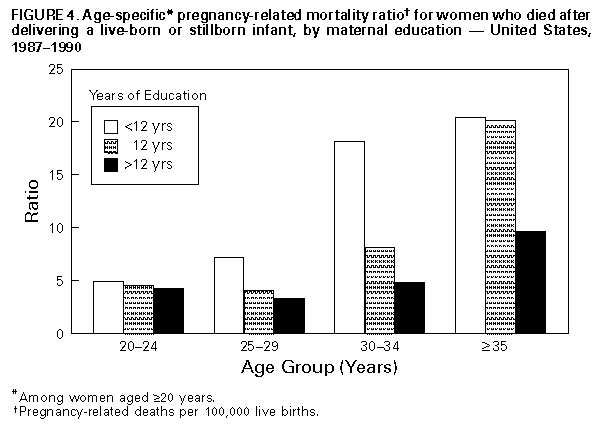 Return to top. Table_5 Note: To print large tables and graphs users may have to change their printer settings to landscape and use a small font size.
TABLE 5. Crude pregnancy-related mortality rate, * by race + and
adequacy of prenatal care & -- United States,@ 1987-1990
======================================================================
                               Race
Adequacy of         --------------------------
prenatal care        White    Black     Other **    All deaths
----------------------------------------------------------------------
No care               19.0     26.5      49.5 ++      23.0
Inadequate             3.3     10.3       6.6          5.0
Adequate               2.4      7.0       3.7          3.0
Adequate plus          5.5     14.8      10.7          7.3

All levels of care     3.6     11.2       7.1          5.1
----------------------------------------------------------------------
*  Pregnancy-related deaths among women who delivered a live-born
   infant per 100,000 live births.
+  Hispanic women were classified by their reported racial group.
   Levels of prenatal care were based on a modification of the
   adequacy of prenatal care use (APCU) index developed by Kotelchuck
   ( 15 ), and they were defined as follows: adequate plus -- care
   began at <=4 months of pregnancy, and >=110% of recommended
   prenatal care visits were made (i.e., in accordance with standards
   established by the American College of Obstetricians and
   Gynecologists); adequate -- care began at <=4 months of pregnancy,
   and 80%-90% of recommended visits were made; inadequate -- care
   began at <=4 months of pregnancy, and <80% of recommended visits
   were made, or care began at 35 months of pregnancy (recommended
   number of visits not applicable); and no care -- no prenatal
   care obtained.
&  Excludes California for 1987-1988.
** Includes Asian/Pacific Islander, American Indian/Alaskan
   Native, and those reported as "other."
++ This rate was based on fewer than five deaths and should be
   interpreted with caution.
======================================================================
Return to top. Figure_5  Return to top. Table_6 Note: To print large tables and graphs users may have to change their printer settings to landscape and use a small font size.
TABLE 6. Pregnancy-related mortality rate, * by age group, race, + and live-birth order -- United States, 1987-1990
=======================================================================================================================================================================================
                                                                                          Age group (yrs)/Race

                                                       <20 20-29>=30                        All ages
                                       -----------------------------------  ----------------------------     ----------------------------    ----------------------------
Live-birth order                       White           Black   All races &  White   Black    All races &     White   Black    All races &    White   Black    All races &
---------------------------------------------------------------------------------------------------------------------------------------------------------------------------------------
First live birth                         2.7             6.0         3.7      3.4     9.0          4.2         5.2    17.9          6.6        3.6     8.5          4.5
Second live birth                        2.7             6.2         3.9      2.0     7.1          2.8         4.6    26.0          6.7        2.9    10.4          4.1
Third live birth                         2.9 @           5.9         4.2      2.8     7.7          3.9         5.1    24.8          7.5        3.8    12.1          5.3
Fourth live birth                       23.1 @          61.4 @       44.0     4.5    11.0          6.0         7.0    24.8         10.1        5.9    17.4          8.5
Fifth or more                             -- **          -- **       -- **    9.1     9.6          9.1         6.8    33.5         13.7        7.5    21.7         12.1
---------------------------------------------------------------------------------------------------------------------------------------------------------------------------------------
*  Pregnancy-related deaths among women who delivered a live-born infant per 100,000 live births.
+  Hispanic women were classified by their reported racial group.
&  Includes Asian/Pacific Islander, American Indian/Alaskan Native, and those reported as "other."
@  These rates were based on fewer than five deaths and should be interpreted with caution.
** No pregnancy- related deaths.
=======================================================================================================================================================================================
Return to top. Table_7 Note: To print large tables and graphs users may have to change their printer settings to landscape and use a small font size.
TABLE 7. Percentage of pregnancy-related deaths by outcome of pregnancy and cause of death, percentage of all outcomes of pregnancy, and pregnancy-
related mortality ratio (PRMR)* -- United States, 1987-1990
=================================================================================================================================================================
                                                                                    Outcome of pregnancy (% distribution)                        All outcomes
                                            ----------------------------------------------------------------------------------------------     ------------------
Cause of death                               Live birth                 Stillbirth   Ectopic   Abortion +   Molar &   Undelivered   Unknown       %        PRMR
-----------------------------------------------------------------------------------------------------------------------------------------------------------------
Hemorrhage                                       21.1                       27.2       94.9       18.5      16.7        15.7        20.1         28.8       2.6
Embolism                                         23.4                       10.7        1.3       11.1       0.0        35.2        21.1         19.9       1.8
Pregnancy-induced hypertension                   23.8                       26.2        0.0        1.2       0.0         4.6        16.3         17.6       1.6
Infection                                        12.1                       19.4        1.3       49.4       0.0        13.0         9.0         13.1       1.2
Cardiomyopathy                                    6.1                        2.9        0.0        0.0       0.0         2.8        13.9          5.7       0.5
Anesthesia complications                          2.7                        0.0        1.9        8.6       0.0         1.8         1.0          2.5       0.2
Other/Unknown                                    11.1                       13.6        0.6       11.1      83.3        27.5        19.3         12.8       1.2

Total @                                         100.0                      100.0      100.0      100.0     100.0       100.0       100.0        100.0       9.2
-----------------------------------------------------------------------------------------------------------------------------------------------------------------
* Pregnancy-related deaths per 100,000 live births.
+ Includes spontaneous and induced abortions.
& Also known as gestational trophoblastic neoplasia.
@ Percentages may not add to 100.0 due to rounding.
=================================================================================================================================================================
Return to top. Table_8 Note: To print large tables and graphs users may have to change their printer settings to landscape and use a small font size.
TABLE 8. Pregnancy-related mortality ratio, * by size of hospital and cause of death -- United States, 1987-1990
=========================================================================================================================================
                                                                              Hospital size (no. of deliveries)
                                                             --------------------------------------------------------------
Cause of death                                               <300 300-999 1,000-1,999 2,000-2,999>=3,000   Total
-----------------------------------------------------------------------------------------------------------------------------------------
Hemorrhage                                                    0.6            1.0           1.3           1.3            1.4     1.2
Embolism                                                      1.8            0.9           1.6           1.2            1.0     1.2
Pregnancy-induced hypertension                                0.5            0.7           1.4           2.0            1.6     1.4
Infection                                                     0.1            0.4           0.7           1.2            0.8     0.7
Cardiomyopathy                                                0.0            0.2           0.4           0.4            0.4     0.3
Anesthesia complications                                      0.1            0.1           0.1           0.2            0.2     0.1
Other                                                         0.2            0.6           0.6           0.9            0.7     0.6

All causes                                                    3.3            4.0           6.0           7.2            6.0     5.7

Risk ratio                                               Referent            1.2           1.8           2.2            1.8
  (95% CI+)                                                              (0.77-1.86)   (1.18-2.76)   (1.41-3.32)    (1.20-2.77)
-----------------------------------------------------------------------------------------------------------------------------------------
* Prengnancy-related deaths among women who delivered a live-born or stillborn infant per 100,000 live births.
+ Confidence interval.
=========================================================================================================================================
Return to top. Figure_6 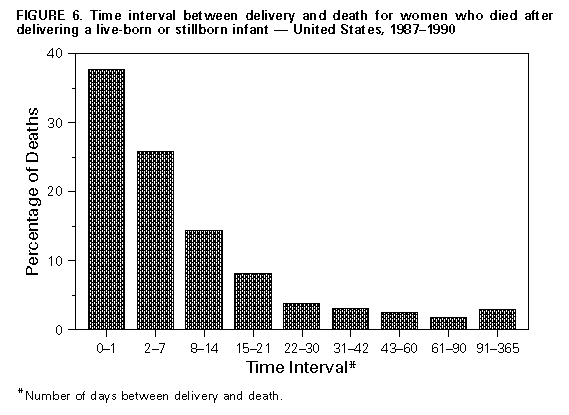 Return to top. Disclaimer All MMWR HTML versions of articles are electronic conversions from ASCII text into HTML. This conversion may have resulted in character translation or format errors in the HTML version. Users should not rely on this HTML document, but are referred to the electronic PDF version and/or the original MMWR paper copy for the official text, figures, and tables. An original paper copy of this issue can be obtained from the Superintendent of Documents, U.S. Government Printing Office (GPO), Washington, DC 20402-9371; telephone: (202) 512-1800. Contact GPO for current prices. **Questions or messages regarding errors in formatting should be addressed to mmwrq@cdc.gov.Page converted: 09/19/98 |
|||||||||
This page last reviewed 5/2/01
|