
|
|
Volume
3:
No. 1, January 2006
ORIGINAL RESEARCH
Using Concept Mapping to Develop a Logic Model for the Prevention Research Centers Program
Lynda A. Anderson, PhD, Margaret K. Gwaltney, MBA, Demia L. Sundra, MPH, Ross C. Brownson, PhD, Mary Kane, MS, Alan W. Cross, MD, Richard Mack, Jr, PhD, Randy Schwartz, MSPH, Tom Sims, MA, Carol R. White, MPH
Suggested citation for this article: Anderson LA, Gwaltney MK, Sundra DL, Brownson RC, Kane M, Cross AW, et al. Using concept mapping to develop a logic model for the Prevention Research Centers Program. Prev Chronic Dis [serial online] 2006 Jan [date cited]. Available from: URL:
http://www.cdc.gov/pcd/issues/2006/
jan/05_0153.htm.
PEER REVIEWED
Abstract
Introduction
Concept mapping is a structured conceptualization process that provides a visual representation of relationships among ideas.
Concept mapping was used to develop a logic model for the Centers for Disease Control and Prevention’s Prevention Research Centers Program, which has a large and diverse group of stakeholders throughout the United States.
No published studies have used concept mapping to develop a logic model for a
national program.
Methods
Two logic models were constructed using the data from the concept mapping process and program documents: one for the national level and one for the local level.
Concept mapping involved three phases: 1) developing questions to generate ideas about the program’s purpose and function, 2) gathering input from 145 national stakeholders and 135 local stakeholders and sorting ideas into
themes, and 3) using multivariate statistical analyses to generate concept maps. Logic models were refined using feedback received from stakeholders at regional meetings and conferences and from a structured feedback tool.
Results
The national concept map consisted of 9 clusters with 88 statements; the local concept map consisted of 11 clusters with 75
statements. Clusters were categorized into three logic model components: inputs, activities, and outcomes. Based on feedback, two draft logic models were combined
and finalized into one for the Prevention Research Centers Program.
Conclusion
Concept mapping provides a valuable data source, establishes a common view of a program, and identifies inputs, activities, and outcomes in a logic model. Our concept mapping process resulted in a logic model that is meaningful for stakeholders, incorporates input from the program’s partners, and establishes important program expectations.
Our methods may be beneficial for other programs that are developing logic
models for evaluation planning.
Back to top
Introduction
The Centers for Disease Control and Prevention’s (CDC’s) Framework for Program Evaluation in Public Health provides public health practitioners and evaluators with a practical, six-step approach for effective evaluation (1). The framework helps public health programs address increased accountability requirements, program improvement processes, and public health decision
making (1,2). The two initial steps in the CDC’s evaluation framework are
describing the program and engaging stakeholders. The program description step includes developing a logic model that visually depicts the hypothesized relationships among program resources, program activities, and the results the program hopes to achieve — in other words, the program’s underlying theory of
change (3). The CDC evaluation framework and other models recommend engaging stakeholders during the logic model development to increase the usefulness and validity of the resulting model (1,4-6). The logic model can then be used as the basis for future program evaluation efforts.
Examples are available of public health programs that have used participatory methods to develop logic models (3,7-9), but the methods
used by the programs to encourage stakeholder input are not the focus of those publications. In addition, participatory methods for developing logic models have typically involved small or single-site programs or engaged a small group of program
representatives. In this article, we detail the efforts of the CDC’s Prevention Research Centers (PRC) Program, in which concept mapping was used to develop a national program logic model.
Concept mapping can be used to identify key elements of a program and show their relationships to one another (10,11). Several projects have used concept mapping to set priorities,
plan programs, and evaluate programs (12-15). Although the methodology has been used previously to develop a logic model for a single program (16), we could find no published studies that used
concept mapping to develop a logic model for a national program. We describe the application of concept mapping in the
PRC Program, a large, multisite program with national, state, and local stakeholders distributed throughout the United States. These methods should be beneficial for individuals involved in programs that are
developing logic models for evaluation planning.
The PRC Program funds 33 university-based research centers to conduct community-based participatory research and training on chronic disease and health promotion issues facing communities today (17). The
PRC Program is the CDC’s largest extramural research program and encourages academic, community, and public health collaboration in conducting prevention research and applying research
in practice and policies (18). Stakeholders in the PRC Program include researchers in schools of public health, schools of medicine, and other academic departments; community members; community-based organizations; tribal organizations; public health practitioners in state, county, and city health departments; other government agencies; school administrators and teachers; national advocacy
organizations and public health associations; the CDC; Congress; and many others. During the first year of the logic model development project (2001), the
PRC Program funded 26 centers in 24 states.
To address the increased emphasis on accountability and meet the recommendations made in the 1997 Institute of Medicine (IOM) review of the
PRC Program (19), the program’s leaders decided to initiate a national evaluation strategy. Using the CDC evaluation framework as a guide (1), an evaluation planning project was funded, with the goal of engaging stakeholders to develop an overall
program description and logic model (steps 1 and 2 of the CDC evaluation framework). An external evaluation contractor was funded to facilitate a participatory process that would ensure the key stakeholders of the
PRC Program had a role in developing the logic model.
Back to top
Methods
The national logic model was developed in three stages. First, we constructed a logic model
draft using data from the concept mapping process. Second, we refined the draft through regional meetings with
PRC Program stakeholders. Third, we distributed the draft and written narrative to stakeholders and obtained suggestions through a structured
feedback tool designed to help revise the model.
A collaborative evaluation design team (CEDT) comprising representatives from major stakeholder groups was formed and oversaw all aspects of the project. This group included experts in community-based participatory research, public health, disease prevention, and program evaluation who worked in various settings, including universities, state health departments, voluntary health agencies, and
local organizations. The CEDT assisted with the concept mapping process and development of the PRC logic model, communicated with the constituency represented by each team member, and advised the evaluation contractor and
the CDC on all aspects of project implementation.
Concept mapping
We used concept mapping to develop our program framework, or logic model. Concept mapping provides a visual representation of the complex relationships among ideas and results and integrates qualitative processes with quantitative methods (20). Unlike other qualitative methods such as focus groups, concept mapping provides a structured approach that allows participants to identify issues and
participate in the actual interpretation of their group perceptions (21). Concept mapping also incorporates statistical tools that provide precise and credible data from
qualitative information. The method was selected because it can elicit ideas from large and diverse groups about an issue or
a topic within a short time and because its design enables it to
overcome geographic barriers (20,22).
The concept mapping process had three phases: 1) project planning, which included developing the focus prompt (i.e., the type of input desired) and identifying participants (November 2001–January 2002); 2) idea generation and structuring (February–March 2002), and 3) analysis and interpretation of the concept maps (April–June 2002). During each step, we
encouraged ongoing communication through committee meetings and conference calls to obtain stakeholder input and provide updates about each step of the concept mapping process.
Project planning phase
The evaluation contractor collaborated with the CEDT to develop the following two prompts to elicit ideas about the purpose and function of the
PRC Program, with one focusing on the national level and one on the local level:
- To ensure national excellence in prevention, a Prevention Research Center should have the following specific characteristic or function . . .
- To successfully promote health in a community, an effective Prevention Research Center should have the following specific characteristic or skill . . .
We compiled a list of 175 PRC Program stakeholders to participate in the concept mapping process using the nationally focused prompt. Stakeholders included representatives from national organizations, such as Chronic Disease Directors, Directors of Health
Promotion and Education, Association of Schools of Public Health, and Association of Teachers of Preventive Medicine; members selected from the IOM
report review committee (19); CDC leaders familiar with the PRC Program; CDC program staff members; the PRC national community committee, which is composed of representatives from each PRC community committee, who advise the program, facilitate training of community members, and educate about prevention research (23); and PRC leaders, such as principal investigators, directors, administrators,
and researchers from the PRCs. PRC leaders could invite other key stakeholders
such as university leaders to participate in the brainstorming process at the
national level.
We generated a similar list of 165 stakeholders to participate in the concept mapping process using the locally focused prompt. Participants were identified from the following groups: PRC community committees, research participants, health department partners, and PRC leaders such as principal investigators, directors, administrators, and researchers
from the PRCs. Because we knew that some stakeholders might not be able to respond online or by fax, and to ensure that the community’s input was obtained, we selected a community liaison in each PRC who assisted community representatives in the concept mapping process. We invited
some stakeholders who had national and local perspectives on the PRC Program to respond to both focus prompts.
Idea generation and structuring phase
We invited participants to submit up to 10 ideas in response to the focus prompt using a secure Web site or by mailing or faxing their ideas to the evaluation contractor. Because participants submitted their ideas anonymously, we could not calculate exact response rates or the average number of items submitted per respondent.
However, based on unique identifiers, we estimated that 145 stakeholders (83%) responded to the nationally focused prompt, and 135 responded (82%) to the locally focused prompt.
Members of the CEDT reviewed the statements that had been generated for each prompt and eliminated repetitive statements, yielding 88 unique statements for the national responses and 75 unique statements for the local responses. The statements were sorted into themes (24). The national and local statements were
then sorted independently by two subsets of participants who were selected for
their familiarity with PRCs. For the national statements, 35 stakeholders were
contacted, with 20 (57%) resulting participants. For the local statements, 30
stakeholders were contacted, with 17 (57%) resulting participants. The
individuals were asked to sort the statements into categories, or themes, based on similarity of ideas. Participants either used the project’s Web site to sort the statements into categories or manually sorted statements that
had been printed on cards. Participants were asked to create their own categories; they were told that each statement could be placed into only one category, and the sorting process should result in more than one category but fewer categories than the total number of statements.
Analysis and interpretation phase
We used a software tool designed for multiple stakeholder input (Concept
Systems, Inc, Ithaca, NY) to construct two separate concept maps (12). An expert in concept mapping conducted the analysis. First, a similarity matrix was constructed that represented the relative similarity of participants’ sorting statements. Second, the total similarity matrix
was analyzed using nonmetric multidimensional scaling analysis with a two-dimensional solution, which generated x and y coordinates in two-dimensional space for each statement based on its mathematical similarity to other statements. Configuring the multidimensional scaling of the statement points in two dimensions on a point map was the foundation for the final results. Third, statements were
combined into clusters using a hierarchical cluster analysis. The results of the hierarchical cluster analysis were superimposed on the multidimensional scaling results to create a map displaying the points graphically within each group, with polygonal boundaries surrounding the points in each cluster group. A hierarchical cluster analysis yields all possible cluster solutions, from each
statement in its own cluster to all statements in one cluster. A standardized, systematic process is applied to identify the most useful cluster number for
each project. The appropriate number of clusters is determined by working with subject experts who consider the range of issues represented, the purpose and intended uses of the resulting map, and the observed coherence of clusters
at different levels (21).
The CEDT reviewed the two PRC Program cluster maps and the statements associated with each cluster. The CEDT members then agreed on a theme and label for each cluster on both maps. These maps became the national- and local-level concept maps for the
PRC Program.
Developing the logic models
We developed a draft logic model diagram, showing PRC Program inputs, activities, and outcomes and incorporating data from the concept mapping process. This information was supplemented by information from program documents. We presented the draft logic models at regional meetings in May and June 2002 and distributed the logic model with a written narrative in a structured feedback tool in
September 2002. We used the feedback received through these mechanisms to make final revisions. The final logic model and narrative were then broadly distributed to the PRCs
and other stakeholders.
Back to top
Results
Concept maps
The national-level concept map had nine clusters (Figure 1):
- Diversity and sensitivity
- Community engagement
- Research methods
- Research agenda
- Core expertise and resources
- Active dissemination
- Technical assistance
- Training
- Relationships and recognition
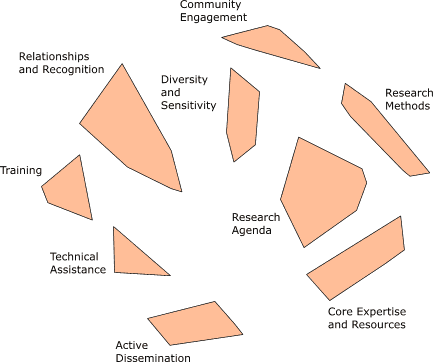
Figure 1. National concept map showing 9 clusters and 88 statements. (Place
your cursor over the cluster to see its associated statements.) PRC indicates Prevention Research Center; CDC, Centers for Disease Control and Prevention.
[A text description of this model is also
available.]
The local-level concept map had 11 clusters (Figure 2):
- Communication and dissemination
- Outreach
- Promotes community involvement
- Responsive to community input
- Builds community capacity
- Committed community advisory group
- Trust
- Defining and measuring community outcomes
- Training and mentoring
- Human resources
- Translation of research to practice
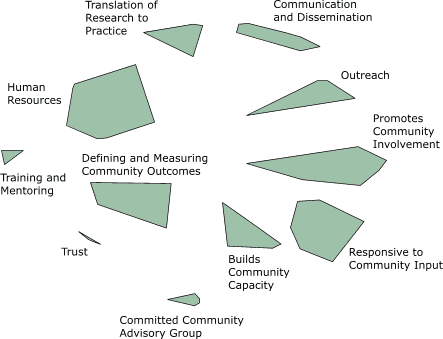
Figure 2. Local concept map showing 11 clusters and 75 statements.
(Place your cursor over the cluster to see its associated statements.) PRC indicates Prevention Research Center; CDC, Centers for Disease Control and Prevention.
[A text description of this model is also
available.]
Development of the program logic model
We placed the concept map data into the appropriate columns of the logic models: program input, activity, or outcome (Tables 1 and 2). For example, the core expertise and resources cluster from the concept map (Figure 1) was placed in the input column of the draft national logic model
(Table 1). Likewise, the community engagement cluster was placed in the activities column of the national
logic model. We continued this process until all clusters from the national concept map had been categorized into the columns of the national logic model. Using the same process for the local logic model, we placed the committed community advisory board cluster from the local concept map (Figure 2) into the input column of the local logic model
(Table 2) and the trust cluster from the
concept map into the outcome column of the model. The remaining cluster information from the local concept map was placed into the appropriate columns of the local logic model. We reviewed program documents, such as the IOM report (19), authorizing legislation (25), and PRC guiding principles (17), to identify other activities and outcomes relevant to the program. Information from these documents
augmented the concept mapping data.
We presented the draft logic models at three regional meetings. The meetings were attended by 57 participants representing academic, community, and public health
partners within the PRC Program. Based on comments received, we combined the two draft logic models into one logic model for the national
PRC Program. Meeting participants agreed that the single PRC Program logic model
should reflect the key clusters from the locally focused prompt that were not associated with the nationally focused prompt: community capacity building, trust, and translation of research to practice.
We distributed the single national logic model with a written narrative in a structured feedback tool. Representatives in 28 PRCs (rather than 26, because two additional PRCs
had been funded) received the feedback tool, including
members of the Chronic Disease Directors, the Directors of Health Promotion and Education, the PRC National Community Committee, and
the CDC program staff. We asked each PRC to gather
input from various respondents, including academic and community partners, and then provide a single response representing the individual PRC. The PRCs were asked to send their comments to the evaluation contractor; the response rate was 100%. As a result of the feedback, the logic model underwent minor revisions.
The PRC Program office at the CDC distributed the final logic model and accompanying narrative to program stakeholders and posted it on the
PRC Program Web site (http://www.cdc.gov/prc/). We have presented the logic model at several national evaluation, public health, and health education conferences and meetings, such as the National Conference on Chronic Disease Prevention and Control and meetings of
the American Public Health Association, American Evaluation Association, and Society of Public Health Educators.
Back to top
Discussion
Concept mapping can be a useful tool for constructing a logic model for a national program. We identified several benefits from our experiences with the
PRC Program. First, the most obvious benefit was that the logic model was based on a set of concepts that came directly from stakeholders. The concept map and underlying statements served as the foundation for the logic model refinement
process. In addition, components of the final logic model were easily linked to the original concept mapping ideas submitted by stakeholders. Second, compared with an initially proposed logic model
(available upon request) developed by a few CDC staff members and select partners, the logic model based on the concept mapping data was more comprehensive and representative of the processes and outcomes involved
in prevention research. For the first time, community representatives could see themselves visually represented in a program’s activities and outcomes. For example, their role in establishing a research agenda is clear, as is the intended outcome of enhanced community capacity for disease prevention.
Consistent with the CDC framework for evaluation recommendations, engaging
stakeholders in the development of the program logic model was worth the
investment of resources (1). Concept mapping encouraged participants to provide their opinions
about the PRC Program anonymously during the idea-generation phase. The ability
to provide anonymous input was important during the early project phases because
trust was being established among the various stakeholder groups. Combining concept mapping
with other methods for eliciting feedback throughout the project helped address the significant numbers of
stakeholders who expressed differing views or general skepticism about the process,
an issue that may be inherent in any large, multisite program. Overall, open discussions, compromise among
people with conflicting views, transparent use of feedback and decision making, inclusion of stakeholder perspectives, and repeated explanations of the process were important methods for keeping all participants positively engaged and supportive of the final product. Our experiences and challenges were similar to those reported in other participatory
evaluation process reports (26,27) and will be presented in another article.
Concept mapping has gained acceptance by researchers in the last 15 years; in the last 5 years, its use has been facilitated by Web applications for participant data collection and analysis. In addition, online data collection methods are more cost-effective and efficient than other participatory methods involving large groups. Another benefit of using a Web-based system is that the initial
maps can be presented to stakeholders quickly. In our experience, the process allowed us to gather data from stakeholders in numerous geographic areas and then present the concept maps to PRC representatives 1 month after the idea generation and structuring were completed.
Concept mapping as a tool for developing a logic model does have some shortcomings. First, a logic model derived from a concept map is based on stakeholder perspectives; it is not a tested theory of
how a program functions and arrives at intended outcomes. Therefore, it may not reflect some realities of program implementation and outcomes (4). Future evaluation efforts in the
PRC Program will clarify the concepts and logic in the national
model. Second, concept mapping was a new process for most stakeholders. Many who were not familiar with qualitative methods and terminology initially struggled to understand how the concept mapping activities would result in the construction of a logic model for the program. Finally, although many diverse perspectives are represented in the findings of the concept mapping process, they should not
be interpreted as representing the views of all stakeholders.
Given the challenges faced during the project, we recommend using three of the strategies we found most helpful. First, program evaluation experts should be used to obtain the information from the concept mapping statements and other program documents to construct an initial logic model. Second, stakeholders should be fully informed about the concept mapping process and given concept mapping
examples (such as this article) so that they can become familiar with the use of concept mapping as a tool for logic model development. Third, concept mapping data should be supplemented with program documents and stakeholder feedback, a strategy that is consistent with recommendations
for using multiple methods for developing a program theory (6). Future evaluation project planners should
consider using electronic methods for gathering feedback, such as Web-based conferencing and telephone focus groups.
Concept mapping is a valuable method for developing a logic model, particularly for a large program with a diverse group of stakeholders. Having a national logic model has permitted the
PRC Program to identify its centers’ outcomes and functions. The process and final logic model has incorporated the input of the
program’s national and community partners, engaged stakeholders,
and provided the PRC Program with a platform on which to design and implement a national evaluation strategy.
Back to top
Acknowledgments
This work was supported by the PRC Program, the CDC’s One-Percent Evaluation Program, and the National Center for Chronic Disease Prevention and Health Promotion. We thank Bobby Milstein for his initial input and
his help with defining the use of concept mapping for this evaluation project. We extend our appreciation to Robert
M. Goodman and Robert Hancock from the Collaborative Evaluation
Design Team, Jennifer Scherer of COSMOS Corporation, and Daniel McLinden of Concept Systems, Inc, for their contributions to the project. We are grateful to all the stakeholders who contributed their time and ideas to develop the
PRC Program logic model. The contractors for this project were COSMOS
Corporation and Concept Systems, Inc.
Back to top
Author Information
Corresponding Author: Demia L. Sundra, MPH, Centers for Disease Control and Prevention, Prevention Research Centers Program, 4770 Buford Hwy, Mail Stop K-45, Atlanta, GA 30341. Telephone: 770-488-5506. E-mail: dsundra@cdc.gov.
Author Affiliations: Lynda A. Anderson, PhD, Centers for Disease Control and Prevention, Atlanta, Ga, and Rollins School of Public Health, Emory University, Atlanta, Ga; Margaret K. Gwaltney,
MBA, COSMOS Corporation, Bethesda, Md.; Ross C. Brownson, PhD, Prevention Research Center, Saint Louis University School of
Public Health, St. Louis, Mo; Mary Kane, MS, Concept Systems, Inc, Ithaca, NY; Alan W. Cross, MD, University of North Carolina at Chapel Hill, Chapel Hill, NC; Richard Mack, Jr, PhD, Harlem Center for Health Promotion and Disease Prevention, Columbia University, New York, NY; Randy Schwartz, MSPH, American Cancer Society, New England Division, Framingham, Mass;
Tom Sims, MA, West Virginia Bureau for Public Health, Charleston, WV; Carol R. White, MPH, University of Kentucky, Lexington, Ky.
Ms Gwaltney is now with Abt Associates Inc, Bethesda, Md; Dr Mack is now a
consultant, New York, NY.
Back to top
References
- Centers for Disease Control and Prevention.
Framework for program evaluation in public health. MMWR Recomm
Rep 1999;48(No. RR-11):1-40.
- Milstein B, Wetterhall S; CDC Evaluation Working Group. A framework featuring steps and standards for program evaluation. Health Promot Pract 2000;1(3):221-8.
- WK Kellogg Foundation. Logic model development guide [Internet]. Battle Creek (MI): 2004
Jan. Available from:
URL: http://www.wkkf.org/Programming/ResourceOverview.aspx? CID=281&ID=3669*.
- Patton M. Utilization-focused evaluation. 3rd edition. Thousand Oaks (CA):
SAGE Publications; 1997.
- McLaughlin JA, Jordan GB. Logic models: a tool for telling your program’s performance story. Eval Program Plann 1999;22:65-72.
- Rossi PH, Freeman HF, Lipsey MW. Evaluation: a systematic approach. 6th edition. Thousand Oaks (CA):
SAGE Publications; 1999.
- Gilliam A, Davis D, Barrington T, Lacson R, Uhl G, Phoenix U.
The value of engaging stakeholders in planning and implementing evaluations. AIDS Educ Prev 2002;14(3 Suppl A):5-17.
- Cheadle A, Beery WL, Greenwald HP, Nelson GD, Pearson D, Senter S.
Evaluating the California Wellness Foundation’s health improvement initiative: a logic model approach. Health Promot Pract 2003;4(2)146-56.
- Lafferty CK, Mahoney CA.
A framework for evaluating comprehensive community initiatives. Health Promot Pract 2003;4(1):31-44.
- Trochim WM. An introduction to concept mapping for planning and evaluation. Eval Program Plann 1989;12(1):1-16.
- Shern DL, Trochim WM, LaComb CA. The use of concept mapping for assessing fidelity of model transfer: an example from psychiatric rehabilitation. Eval Program Plann 1995;18(2):143-53.
- Trochim WM, Cook JA, Setze RJ.
Using concept mapping to develop a conceptual framework of staff’s views of a supported employment program for individuals with severe mental illness. J Consult Clin Psychol 1994 Aug;62(4):766-75.
- Trochim WM, Milstein B, Wood BJ, Jackson S, Pressler V. Setting objectives for community and systems change: an application of concept mapping for planning a statewide health improvement initiative. Health Promot Pract 2004 Jan;5(1):8-19.
- Wheeler FC, Anderson LA, Boddie-Willis C, Price PH, Kane M.
The role of state public health agencies in addressing less prevalent chronic conditions. Prev Chronic Dis
[serial online] 2005 Jul [2005 Jul 7].
- Rosas SR. Concept mapping as a technique for program theory development: an illustration using family support
programs. Am J Eval 2005;26(3):389-401.
- Yampolskaya S, Nesman TM, Hernandez M, Koch D. Using concept mapping to develop a logic model and articulate a program theory: a case example. Am J Eval 2004;25(2):191-207.
- Prevention Research Centers Program [webpage on the Internet]. Atlanta (GA): Centers for Disease Control and Prevention [updated 2005 Jul 1; cited 2005 Jul 8]. Available from:
URL:
http://www.cdc.gov/prc.
- Doll L, Berkelman R, Rosenfield A, Baker E.
Extramural prevention research at the Centers for Disease Control and Prevention. Public Health Rep 2001;116 Suppl 1:10-19.
- Stoto MA, Green LW, Bailey LA, editors; Institute of Medicine. Linking research and public health practice: a review of CDC’s program of centers for research and demonstration of health promotion and disease prevention. Washington
(DC): National Academy of Sciences; 1997.
- Trochim W, Kane M.
Concept mapping: an introduction to structured conceptualization in health care. Int J Qual Health Care 2005;17(3):187-91.
- Southern DM, Batterham RW, Appleby NJ, Young D, Dunt D, Guibert R.
The concept mapping method: an alternative to focus group inquiry in general practice. Aust Fam Physician 1999; 28 Suppl 1:S35-40.
- Trochim W. Concept mapping: soft science or hard art? Eval Program Plann 1989;12:87-110.
- University of North Carolina Center for Health Promotion and Disease
Prevention. Prevention research centers national community committee [Internet]. Chapel Hill (NC): University of North Carolina Center for Health Promotion and Disease Prevention [cited 2005 Jul 8]. Available from:
URL:
http://www.hpdp.unc.edu/ncc/*.
- Rosenberg S, Kim MP. The method of sorting as a data gathering procedure in multivariate research. Multivariate Behav Res 1975;10:489-502.
- Health Promotion and Disease Prevention Amendments of 1984, Pub L No. 98-551 Stat. 771 (1984
Oct 30). Available from: URL: http://thomas.loc.gov/cgi-bin/bdquery/z?d098:SN00771:@@@L&summ2=m&.
- Green JC. Stakeholder participation in evaluation design: is it worth the effort? Eval Program Plann 1987;10:379-94.
- Springett J. Issues in participatory evaluation. In: Minkler M, Wallerstein N, editors. Community-based participatory research for health. San Francisco
(CA): Jossey-Bass; 2003. p. 263-88.
Back to top
*URLs for nonfederal organizations are provided solely as a
service to our users. URLs do not constitute an endorsement of any organization
by CDC or the federal government, and none should be inferred. CDC is
not responsible for the content of Web pages found at these URLs.
|
|
