 |
|
|
|
|
|
|
| ||||||||||
|
|
|
|
|
|
|
||||
| ||||||||||
|
|
|
|
|
Persons using assistive technology might not be able to fully access information in this file. For assistance, please send e-mail to: mmwrq@cdc.gov. Type 508 Accommodation and the title of the report in the subject line of e-mail. Prevalence of Four Developmental Disabilities Among Children Aged 8 Years --- Metropolitan Atlanta Developmental Disabilities Surveillance Program, 1996 and 2000Please note: An erratum has been published for this article. To view the erratum, please click here. Tanya Karapurkar Bhasin, MPH1
Corresponding author: Tanya Karapurkar Bhasin, MPH, Division of Birth Defects and Developmental Disabilities, National Center on Birth Defects and Developmental Disabilities, CDC, 1600 Clifton Rd., NE, MS E-86, Atlanta, GA 30333. Telephone: 404-498-3875; Fax: 404-498-3550; E-mail: tfk2@cdc.gov. AbstractProblem/Condition: In the United States, developmental disabilities affect approximately 17% of children aged <18 years, resulting in substantial financial and social costs. Reporting Period: 1996 and 2000. Description of System: The Metropolitan Atlanta Developmental Disabilities Surveillance Program (MADDSP) monitors the occurrence of mental retardation, cerebral palsy, hearing loss, vision impairment, and autism spectrum disorders among children aged 8 years in the five-county metropolitan Atlanta area (Clayton, Cobb, DeKalb, Fulton, and Gwinnett). MADDSP uses a multiple source ascertainment methodology. Results: During 1996, the prevalence of mental retardation was 15.5 per 1,000 children aged 8 years; it decreased to 12.0 per 1,000 in 2000. The overall prevalence of cerebral palsy was 3.6 per 1,000 in 1996 and 3.1 per 1,000 in 2000. The prevalence of mental retardation and cerebral palsy was highest among males and black children. The prevalence of hearing loss was 1.4 per 1,000 in 1996 and 1.2 per 1,000 in 2000; the prevalence of vision impairment during 1996 was 1.4 per 1,000 and 1.2 per 1,000 in 2000. Minimal differences by study year were observed in the prevalence of all four disabilities when examined by sex, race, and severity. Interpretation: The prevalence of these four select developmental disabilities in MADDSP was higher in 1996 than the annual average prevalence estimates for these disabilities during previous MADDSP study years (1991--1994) study years; the highest increase was observed among children with mental retardation. However, prevalence estimates during 2000 were more consistent with the estimates from the early 1990s. Data from additional surveillance years (2002 and beyond) are needed to determine if the prevalence for 1996 was an anomaly and to continue to monitor trends in the prevalence of developmental disabilities over time. Public Health Actions: MADDSP data will continue to be used to examine trends in the occurrence of these disabilities over time, facilitate the development and implementation of appropriate intervention programs, and provide a framework for conducting population-based etiologic studies. IntroductionIn 1991, CDC established the Metropolitan Atlanta Developmental Disabilities Surveillance Program (MADDSP) to monitor the occurrence of mental retardation, cerebral palsy, hearing loss, and vision impairment among children aged 3--10 years in the five-county metropolitan Atlanta area (Clayton, Cobb, DeKalb, Fulton, and Gwinnett). In 1996, autism spectrum disorders were added to the surveillance program to determine their prevalence and monitor trends in the prevalence over time. MADDSP continues to estimate the prevalence of these five disorders in the metropolitan Atlanta area and serves as a model surveillance program for 17 other states that conduct disability surveillance (i.e., Alabama, Alaska, Arizona Arkansas, California, Colorado, Florida, Georgia, Maryland, Missouri/Illinois, New Jersey, North Carolina, Pennsylvania, South Carolina, Utah, West Virginia, Wisconsin. The main objective of MADDSP is to provide regular, systematic monitoring of the prevalence for select developmental disabilities according to various demographic characteristics of children and their mothers. MADDSP data were used to measure the progress toward achieving the national health objectives for 2010 for the prevention of mental retardation, and the surveillance data will continue to be used to evaluate the Healthy People 2010 objectives for the prevention of mental retardation and cerebral palsy and the early identification of children with autism spectrum disorders (objective 16-14). This report provides prevalence estimates for mental retardation, cerebral palsy, hearing loss, and vision impairment for 1996 and 2000, according to specific demographic and severity characteristics. The prevalence of autism spectrum disorders for 1996 and 2000 is not included in this report. The rate for autism spectrum disorders in 1996 was 3.4 per 1,000 children aged 3--10 years (1), and a report describing the methodology and prevalence for autism spectrum disorders for the 2000 study year is under development. MethodsPrevalence estimates for children aged 3--10 years for 1991 through 1994 have been reported (2--4). MADDSP uses active surveillance methods to ascertain cases of the five select disabilities in the five-county metropolitan area (i.e., Clayton, DeKalb, Fulton, and Gwinnett). Since 1996, only children aged 8 years have been actively monitored by MADDSP. Previous developmental disabilities surveillance data indicated that prevalence rates were stable by age 8 years (CDC, unpublished data, 2005) because, by this age, the majority of children with a developmental disability will have been participating in a special education program, as mandated by Part B of the Individuals with Disabilities Education Act (5), and will have been identified by noneducation providers. Since 2000, MADDSP surveillance data collection has been conducted in 2-year intervals. In 1996, the population of metropolitan Atlanta was 2.2 million, with 40,753 births and 36,749 children aged 8 years. In 2000, the population increased to 2.9 million persons, with 49,966 births and 43,593 children aged 8 years. Since 1991, children identified through MADDSP have been linked to Georgia's vital statistics data and with CDC's Metropolitan Atlanta Congenital Defects Program (6), which monitor birth defects in the same geographic area. These linkages provide additional information concerning congenital and structural abnormalities and birth and maternal characteristics of the children who have been identified. Cases were identified by reviewing records at relevant educational and clinical sources. Nine public school systems and select psychoeducational programs for children with developmental disabilities that are part of the Georgia Department of Education participate as educational sources for MADDSP. Clinical sources include the Georgia Department of Human Resources facilities for children with developmental disabilities, area pediatric hospitals and associated clinics, diagnostic and evaluation centers, and select private clinicians. Case DefinitionsIn MADDSP, a case is defined as a child aged 8 years at any time during the study year of interest whose parent(s) or legal guardian(s) reside in the five-county metropolitan Atlanta area at any time during the study year of interest and who has one or more of the five developmental disabilities. The criteria for meeting each of the developmental disabilities case definition surveyed by MADDSP in 1996 and 2000 have been included in this report. Mental Retardation Mental retardation is defined as a condition marked by an intelligence quotient (IQ) of <70 on the most recently administered psychometric test. In the absence of an IQ score and in the context of testing, a written statement by a psychometrist that a child's intellectual functioning is within the range for severe or profound mental retardation is acceptable. The severity of mental retardation is defined according to the following categories in the International Classification of Diseases, Ninth Edition, Clinical Modification (7): mild (IQ: 50--70), moderate (IQ: 35--49), severe (IQ: 20--34), and profound (IQ: <20). Cerebral Palsy Cerebral palsy is defined as a group of nonprogressive, but frequently changing, motor impairment syndromes secondary to lesions or anomalies of the brain arising at any time during brain development. The impairment of motor function might result in paresis, involuntary movement, or incoordination. Children with postnatally acquired cerebral palsy are eligible to be patients in MADDSP, but children with motor disorders that are transient, resulting from progressive disease of the brain or from spinal cord abnormalities/injuries, are not considered cerebral palsy cases for MADDSP. Confirmed cases of cerebral palsy include children whose conditions are diagnosed as cerebral palsy by a qualified physician or who are identified by other qualified professionals as having this disability on the basis of physical findings noted in source records. A qualified professional is defined as a physician, physical therapist, occupational therapist, nurse practitioner, or physician's assistant. A determination is made by a developmental pediatrician affiliated with MADDSP that the physical findings are consistent with a diagnosis of cerebral palsy. The developmental pediatrician uses a set of rules for determining case status for cerebral palsy. These rules or criteria are based on their clinical knowledge of the disability. Hearing Loss Hearing loss is defined as a measured, bilateral, pure-tone hearing loss at frequencies of 500, 1,000, and 2,000 hertz averaging >40 decibels (dB), unaided, in the better ear. In the absence of a measured, bilateral hearing loss, the conditions of the children met the case definition if their source records include a description, by a licensed or certified audiologist or qualified physician, of a hearing loss of >40 dB in the better ear (e.g., profound sensorineural hearing loss). Severity is defined based on the following hearing impairment levels (measured in the better ear): moderate (hearing loss of 40--64 dB), severe (hearing loss of 65--84 dB), and profound (hearing loss of >85 dB) (8). Vision Impairment Vision impairment is defined as a measured visual acuity of 20/70 or worse, with correction, in the better eye. In the absence of a measured visual acuity, a child is considered a patient if a source record includes a functional description, by a qualified physician or vision professional, of visual acuity of 20/70 or worse (e.g., light perception only) or a statement by a qualified physician or vision professional that the child has low vision or blindness. Severity of visual impairment is defined based on the following vision impairment levels: low vision (visual acuity of 20/70 to 20/400) and blindness (visual acuity worse than 20/400). Data CollectionThe information collected for MADDSP during the 1996 and 2000 included demographic data, earliest and most recent evaluation data for the specific disability, and special education program data. Race categories used for MADDSP are consistent with the Office of Management and Budget Standards for the Classification of Federal Data on Race and Ethnicity (9). Race information was used to assess the differences in the prevalence by race and can provide data regarding differences that might be observed when the rate is examined by the severity level of a particular disability. Analytic ApproachPopulation-based administrative period prevalence estimates were calculated for 1996 and 2000. The numerators include children who met the case definition for one or more of the developmental disabilities and who were born in either 1988 (for inclusion in the 1996 surveillance) or 1992 (for inclusion in the 2000 surveillance). The denominators consisted of children aged 8 years who resided in the metropolitan Atlanta area, according to CDC's National Center for Health Statistics Bridged-Race Intercensal Population Estimates (10) for 1996 and the United States Bureau of Census (11) estimates for 2000. The bridged intercensal denominators were used to calculate the prevalence estimates for 1996 because the intercensal population estimates take into account information collected from the 1990 and 2000 census, whereas the postcensal estimates were based on population projections derived from the 1990 census only. Therefore, the intercensal estimates are considered to be more accurate. Prevalence estimates were calculated for each of the disabilities overall and by sex, race, and severity of the disability. Because of the limited sample size, only the specific estimates by sex, race, and severity for mental retardation can be reported. However, the overall findings by sex, race, and severity for the other disabilities have been provided. White, black, and "other" were the categories used for the race-specific rates. The white and black categories do not include children of Hispanic origin. Children in the other race category include Asian/Pacific Islander, Hispanic, and Native American groups. A chi-square test was used to evaluate significant differences between the 1996 and 2000 study years. ResultsA total of 692 children in 1996 and 647 children in 2000 were identified as having one or more of the four developmental disabilities (mental retardation, cerebral palsy, hearing loss, and vision impairment) presented in this report. The overall prevalence for one or more of these four major disabilities were 1.9% for 1996 and 1.5% for 2000. During 2000, 53.2% of the children were identified at school sources only, whereas 41.3% were identified at both school and nonschool sources. A total of 5.6% were uniquely identified at nonschool sources. Information concerning the source of ascertainment for the reported developmental disabilities was not adequately tracked during 1996 and, therefore, is not available to report. Mental RetardationThe overall prevalence for mental retardation was 15.5 per 1,000 children in 1996 and 12.0 per 1,000 children in 2000 (Table 1). The decrease in prevalence of mental retardation from 1996 and 2000 was observed in all sex and racial populations. However, the highest decrease was observed among males and black children. For both study years, the prevalence for mental retardation was higher among males than females. The prevalence of mental retardation was more than twice as high for black children as for white children in 1996 and 2000. The highest prevalence for mental retardation was observed among black males in both study years compared with white males, black females, and white females (Table 1). The majority of children aged 8 years with mental retardation had mild mental retardation in both study years (65% in 1996 and 61% in 2000). The prevalence of moderate to profound mental retardation was 4.3 per 1,000 in 1996 and 3.3 per 1,000 in 2000 (Table 2). The higher prevalence of mental retardation among males and black children was observed in each severity category for 1996 and 2000. The prevalence of mild mental retardation was four times higher among black males than among white males in 1996 and nearly three times higher in 2000 (Table 2). Whereas the prevalence of moderate to profound mental retardation was also higher in black males than in white males in both study years, the difference between the race-sex groups was lower than that observed among those with mild mental retardation. Cerebral PalsyThe prevalence of cerebral palsy was 3.6 per 1,000 in 1996 and 3.1 per 1,000 in 2000 (Table 3). The prevalence was higher for male and black children than for females and white children in 1996 and 2000. In both study years, the prevalence was highest among black males compared with white males, black females, and white females (Table 3). In 1996 and 2000, the majority of the children had spastic cerebral palsy (65% and 61%, respectively), compared with nonspastic cerebral palsy (7% and 5%, respectively) and cerebral palsy-NOS (26% and 33%, respectively). In both study years, a minimal difference in the prevalence estimates was observed between males and females when examined by cerebral palsy subtypes. However, with the exception of the 1996 study year, males were more affected by each subtype than were females. Similarly, a minimal difference in the prevalence estimates was observed between black and white children in each subtype of cerebral palsy for both study years. However, a higher proportion of black children were observed in each subtype, with the exception of nonspastic cerebral palsy in 1996. The highest difference in the prevalence estimates between black and white children was observed among children with spastic cerebral palsy in 1996 and 2000. Hearing LossThe overall prevalence of hearing loss was 1.4 per 1,000 in 1996 and 1.2 per 1,000 in 2000 (Table 4). In 1996, a higher prevalence was observed among females (1.6) than among males (1.2). Conversely, in 2000, a higher prevalence of hearing loss was observed among males (1.4) than among females (1.0 per 1,000). The overall prevalence estimates for hearing loss in 1996 and 2000 were slightly higher among black children than among white children (Table 4). The distribution of children with moderate, severe, or profound hearing loss was similar in both study years. Approximately one half of the children's conditions were moderate severity (46% and 49%), followed by severe (17% and 19%) and profound severity (35% and 32%) in 1996 and 2000, respectively. In 1996, a higher prevalence of moderate hearing loss was observed among males compared with females. However, a higher prevalence of severe and profound hearing loss was observed among females. In the 2000 study year, males were more frequently affected in each severity group. Vision ImpairmentThe overall prevalence of vision impairment during 1996 was 1.4 per 1,000; in 2000, it was 1.2 per 1,000 (Table 5). In both study years, a slightly higher prevalence of vision impairment was observed among males (1.6 and 1.5, respectively) than among females (1.2 and 0.9, respectively). Black children were more frequently affected by vision impairment than were white children (Table 5). In 1996 and 2000, a higher proportion of children had low vision (58% and 67%, respectively) compared with those with blindness (22% and 27%, respectively). A higher prevalence of low vision and blindness was observed among males and black children in both study years. Coexisting Developmental DisabilitiesThe majority of the conditions in 1996 (87.3%) and 2000 (85.7%) met the case definition for only one of the four disabilities described in this report. During 1996 and 2000, 9.4% and 11.0% of the children had the presence of two developmental disabilities, respectively. The proportion of children with three disabilities was similar for 1996 and 2000: 3.2% and 3.4%, respectively. Whereas in 2000 no children were reported as having four or more disabilities, a small percentage of the conditions (0.1%) were reported as having met the case definition for more than three disabilities in 1996. Children with mental retardation and cerebral palsy were more likely to have multiple developmental disabilities than were children with hearing loss and vision impairment (Table 6). DiscussionIn the United States, developmental disabilities affect approximately 17% of children aged <18 years and have resulted in substantial financial and social costs for affected families and the education and health-care systems (12). Estimated lifetime costs (in 2003 dollars) were expected to total $51.2 billion for persons born in 2000 with mental retardation, $11.5 billion for persons with cerebral palsy, $2.1 billion for persons with hearing loss, and $2.5 billion for persons with vision impairment (4). These costs represent an underestimate of the true cost of developmental disabilities, and these numbers are based only on the prevalence estimates for mental retardation, cerebral palsy, hearing loss, and vision impairment ascertained by MADDSP and do not include costs for other major developmental disabilities (e.g., autism and attention deficit hyperactivity disorder [ADHD]). In addition, children living with developmental disabilities will need not only financial assistance but also special educational and medical services throughout their lifetimes to achieve their optimal development. Because the methodology used in MADDSP extends beyond special education data and incorporates information from other medical and service provision sources, the data in this report is referred to as population-based. Children with developmental disabilities ascertained by MADDSP are identified by actively seeking information from records of service providers rather than by passive public health surveillance activities that would rely, for example, on Georgia's reportable list of conditions. Only a small percentage of children, particularly those with milder forms of the disabilities, might not be identified by MADDSP methods because they do not participate in special education programs or diagnostic/treatment programs. Since MADDSP was initiated during the 1990s, one consistent finding has been that the majority of the children ascertained by the surveillance program are identified through one of the Department of Education sources, which is a consequence of Part B of the Individuals with Disabilities Education Act Public Law 94-142 enacted in 1975 (5). This act mandates that public schools provide free and appropriate education for children with developmental disorders. Information collected from school sources is frequently the primary source for case determination. In 2000, more than one half of the cases were identified in school records only. These data underscore the importance of access to school records to obtain an accurate prevalence estimate for developmental disabilities. In addition, medical source records also provide critical information to MADDSP for case determination. A higher proportion of children with cerebral palsy, compared with children with one of the other developmental disabilities, were identified from medical source files, making clinical records a critical component for complete ascertainment of children with developmental disabilities. The ability to gather comprehensive information for a given child identified by MADDSP is possible because of the multiple source ascertainment methodology that is used by the surveillance program. The overall prevalence estimates for mental retardation, cerebral palsy, hearing loss, and vision impairment among children aged 8 years in 1996 were higher than the average annual prevalence estimates for these four disabilities in previous MADDSP study years (1991--1994) among the same age cohort (CDC, unpublished data, 2005). During 1991--1994, the annual average prevalence (per 1,000) of mental retardation was 12.5; cerebral palsy, 3.2; hearing loss, 1.2; and vision impairment, 1.1. However, only the decrease in mental retardation was statistically significant. The overall prevalence estimates for mental retardation, cerebral palsy, hearing loss, and vision impairment in 2000 were each lower than those in 1996 and more consistent with the annual average prevalence findings from previous MADDSP study years. The prevalence estimates for mental retardation were significantly higher in 1996 than in 2000 for the majority of sex and race groups, with the exception of black females. Reasons for the higher prevalence of mental retardation during 1996 compared with other study years were examined. However, neither the MADDSP case definition nor ascertainment process differed between 1996 and 2000. The findings demonstrate that male children were more likely to be affected with mental retardation, cerebral palsy, hearing loss (in 2000 only), and vision impairment. The higher proportion of males affected with these disabilities is well documented (13--17). The predominance of males affected can be partly attributed to X-linked conditions (e.g., fragile X syndrome for mental retardation and ocular albinism for vision impairment) (14,15,18). A higher male-to-female ratio for other conditions (e.g., ADHD and autism) and risk factors associated with the occurrence of disability (e.g., maternal smoking) also have been observed (14). Further research is needed to determine whether additional male susceptibility for adverse neurodevelopmental and biologic outcomes exist. Consistent with previous findings, higher prevalences for mental retardation, cerebral palsy, hearing loss, and vision impairment were observed among black children (2,15,18). However, the highest difference between white and black children was observed in children with mental retardation and cerebral palsy. Among children with these disabilities, the highest prevalence was among black children with mild mental retardation and spastic cerebral palsy. This finding is consistent with the results from previous investigations (2,14,16,18--20). Higher prevalence for mild mental retardation among black children might be the result of testing differences between white and black children; the underlying reason for these differences is attributed to socioeconomic disparities (14,18). Questions regarding whether psychometric tests adequately assess skills and knowledge equally across races have been explored (2,14,18). Because MADDSP relies solely on an IQ test for the mental retardation case definition, black children might be overrepresented with mild mental retardation because of environmental conditions that affect psychometric test scores (e.g., poverty and poor nutrition) (18). Another study indicated that growing up in a racially segregated and disadvantaged community might contribute to a decline in children's IQ scores during early school years (21). Previous studies have also suggested that black children are at an increased risk for mild mental retardation as a result of in utero conditions attributed to certain maternal biologic or medical conditions (e.g., preterm births, anemia, hypertension, diabetes, or sickle cell anemia) for which black women have higher rates (14,18). ConclusionThe findings in this report continue to support the value of conducting surveillance of developmental disabilities in children aged 8 years by using a multiple source methodology. The methodology used by MADDSP relies substantially on access to public school special education records. Ongoing monitoring of the overall occurrence of these disabilities in the community and their occurrence in certain race and sex populations allow trends to be examined over time and in more homogenous subpopulations of children, which will allow for identification of populations at increased risk. The importance of monitoring the prevalence of these disabilities over time is evident in the higher prevalence estimates for the select disabilities, particularly mental retardation, observed during 1996 compared with 1991--1994 and 2000. To further evaluate the higher prevalence estimates observed during 1996, continued monitoring of the occurrence of these disabilities is needed. Surveillance data also provide the basis for generating hypotheses that can be explored through etiologic studies to further examine risk factors associated with the occurrence of disabilities. MADDSP data have been used to identify various perinatal, postnatal, and sociodemographic risk factors for developmental disabilities. In addition, one of MADDSP's major public health contributions has been the initiation of programs to promote early screening of newborns to assess hearing function, preferably before hospital discharge. Newborn hearing screening is conducted in every state in the United States, and approximately 90% of all newborns are screened. Early hearing and detection intervention programs have been established in every state, which promote early infant hearing screening, timely follow-up evaluations, and early intervention services. MADDSP is critical to conduct epidemiologic studies that are vital for implementing appropriate prevention and intervention programs to reduce the number of children affected by such disabilities. References
Table 1 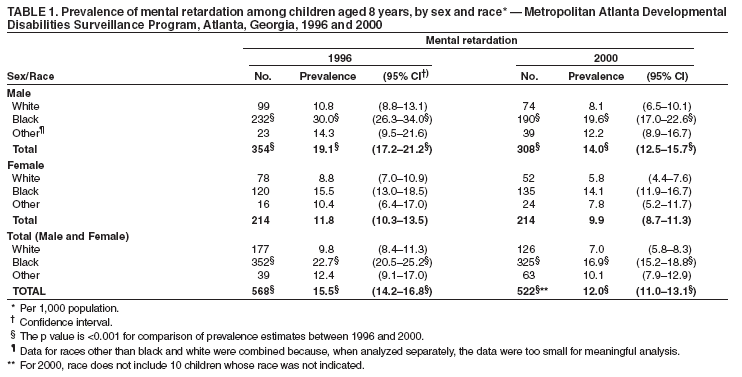 Return to top. Table 2 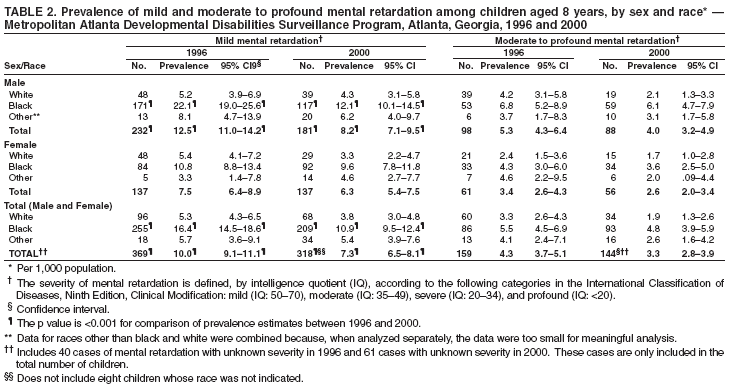 Return to top. Table 3 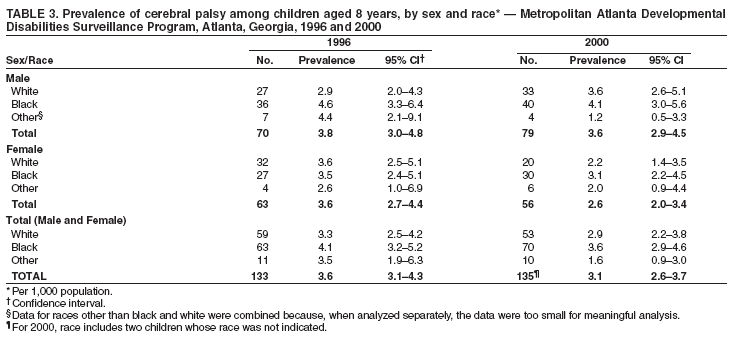 Return to top. Table 4 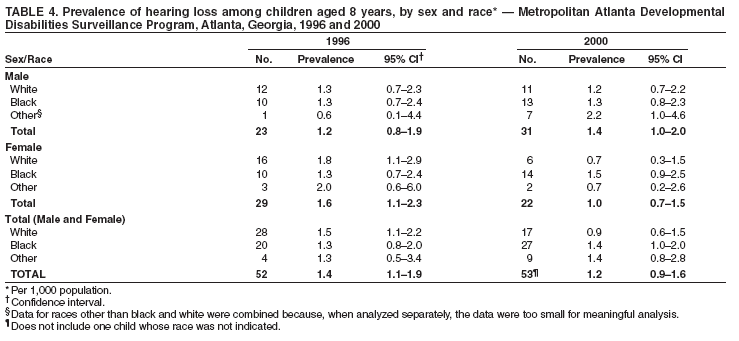 Return to top. Table 5 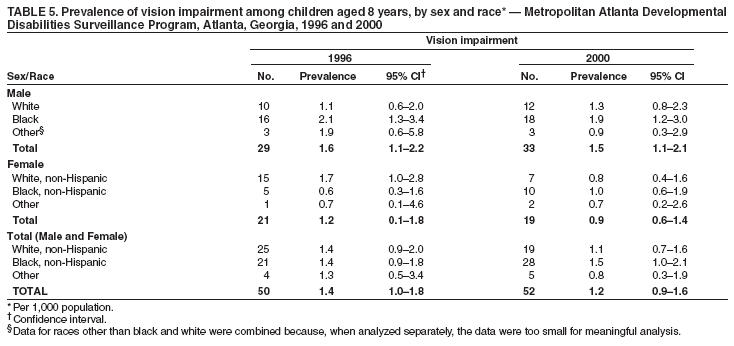 Return to top. Table 6 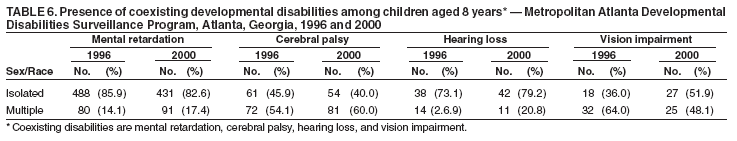 Return to top.
Disclaimer All MMWR HTML versions of articles are electronic conversions from ASCII text into HTML. This conversion may have resulted in character translation or format errors in the HTML version. Users should not rely on this HTML document, but are referred to the electronic PDF version and/or the original MMWR paper copy for the official text, figures, and tables. An original paper copy of this issue can be obtained from the Superintendent of Documents, U.S. Government Printing Office (GPO), Washington, DC 20402-9371; telephone: (202) 512-1800. Contact GPO for current prices. **Questions or messages regarding errors in formatting should be addressed to mmwrq@cdc.gov.Date last reviewed: 1/18/2006 |
|||||||||
|