|
|
|
|
|
|
|
| ||||||||||
|
|
|
|
|
|
|
||||
| ||||||||||
|
|
|
|
|
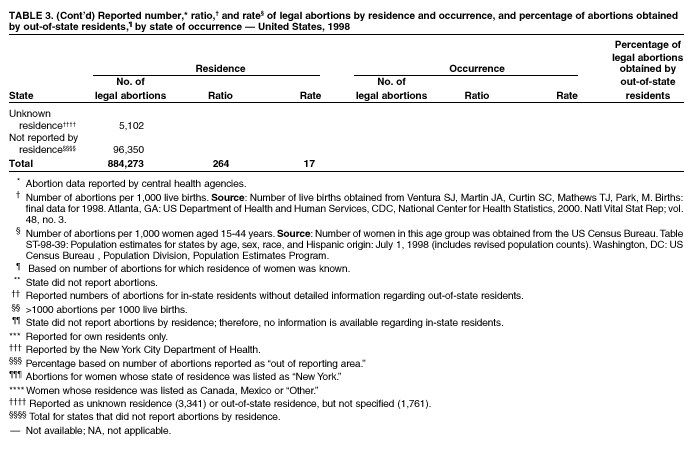
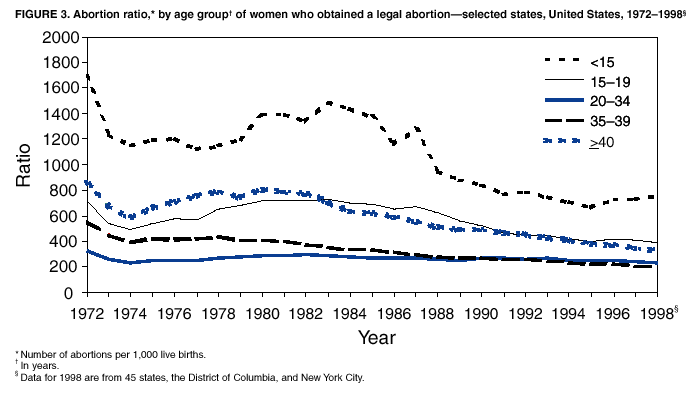
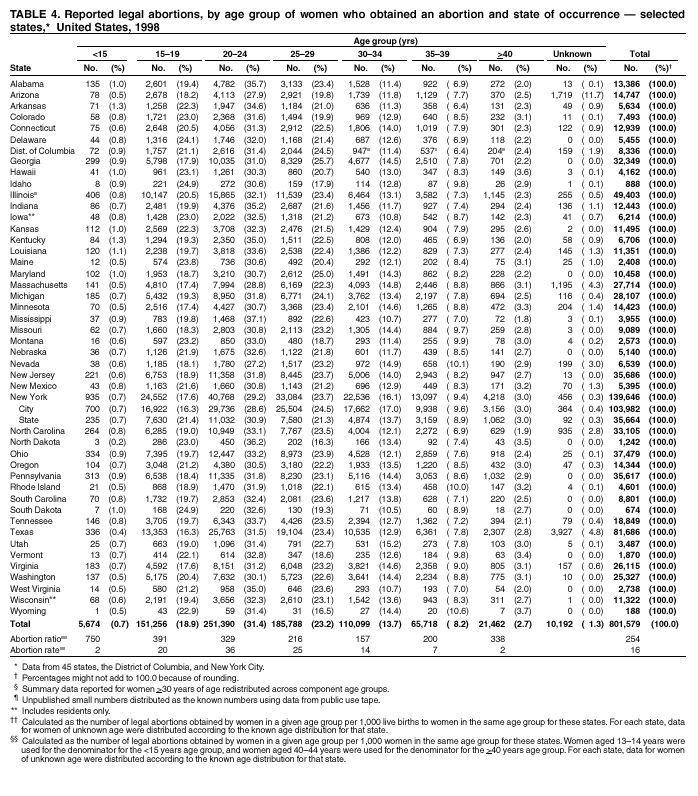
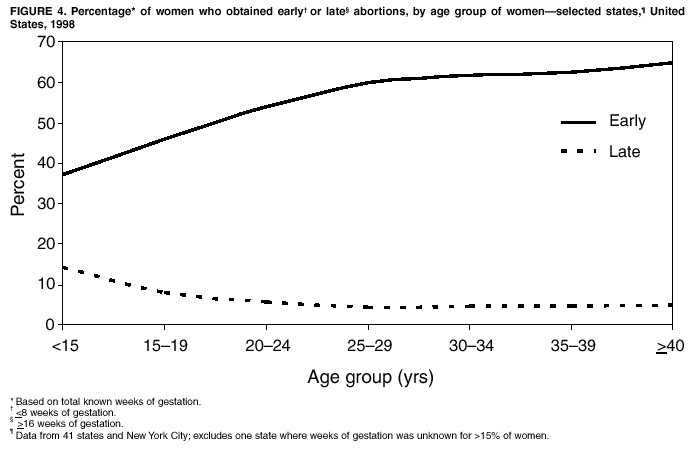
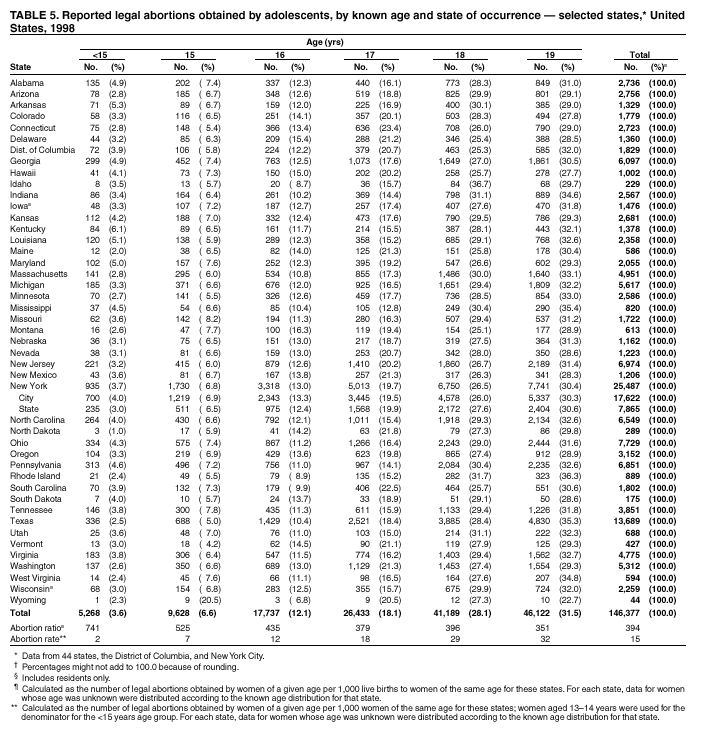
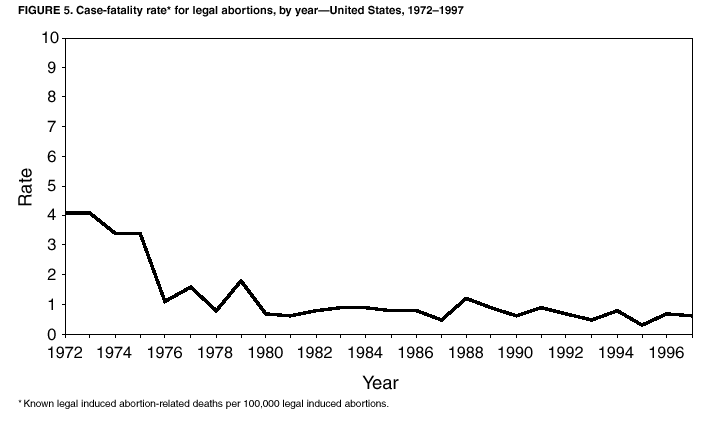
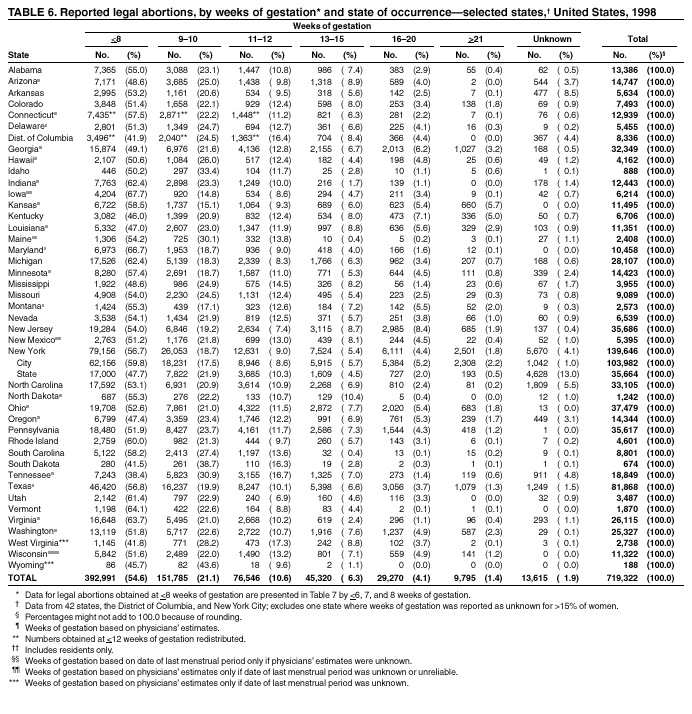
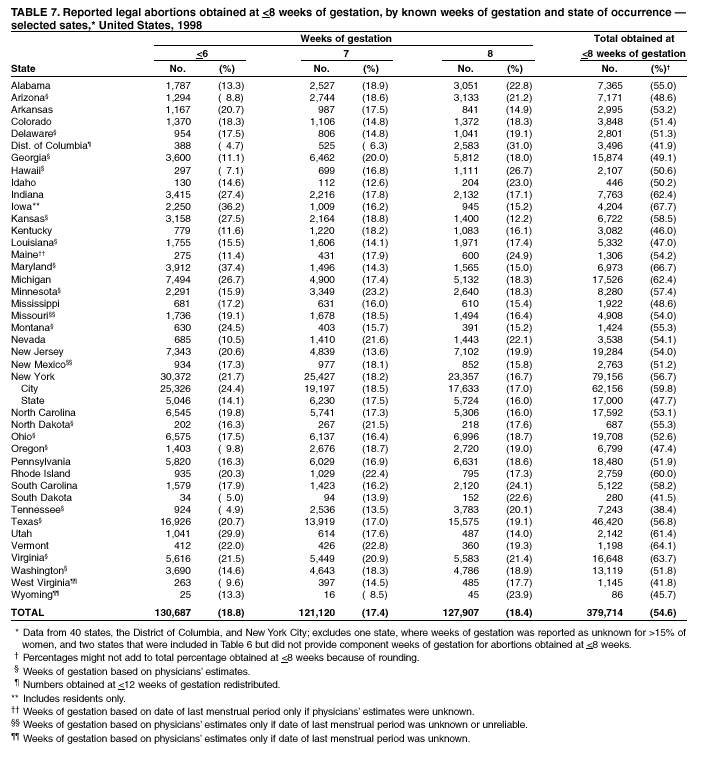
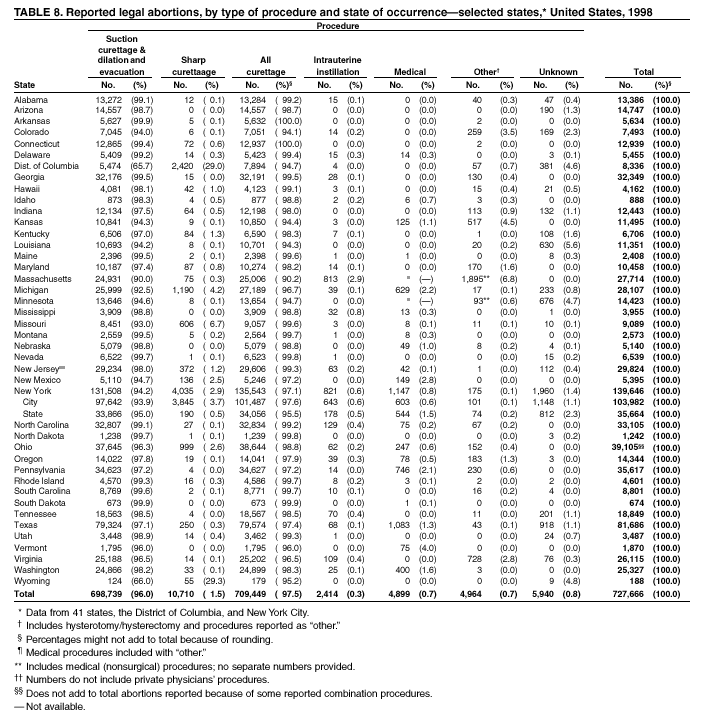
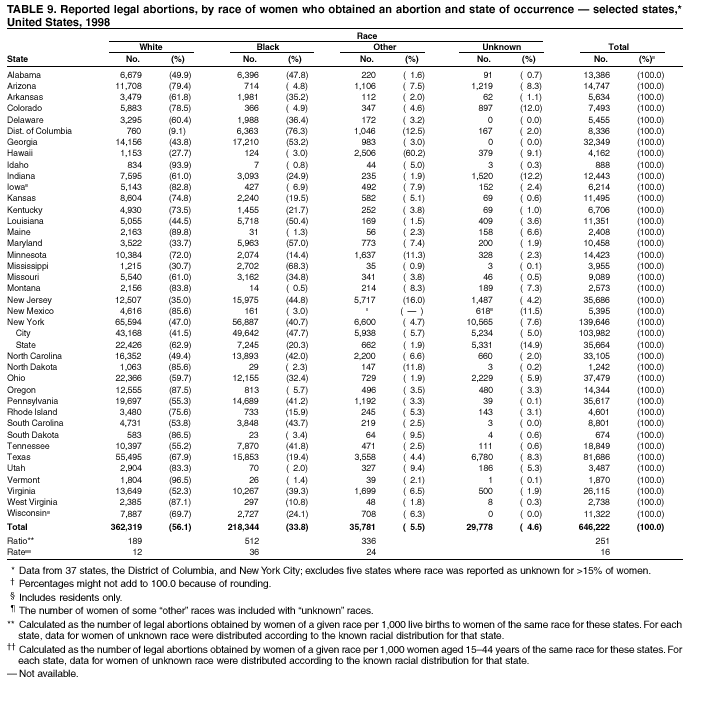
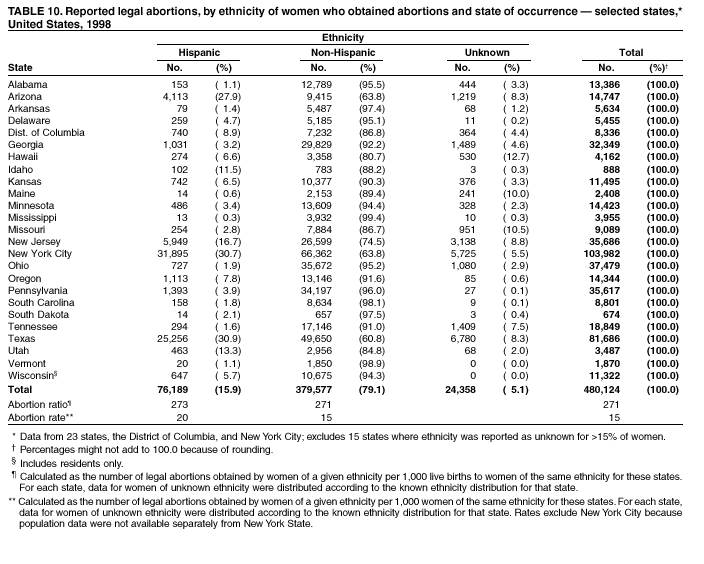
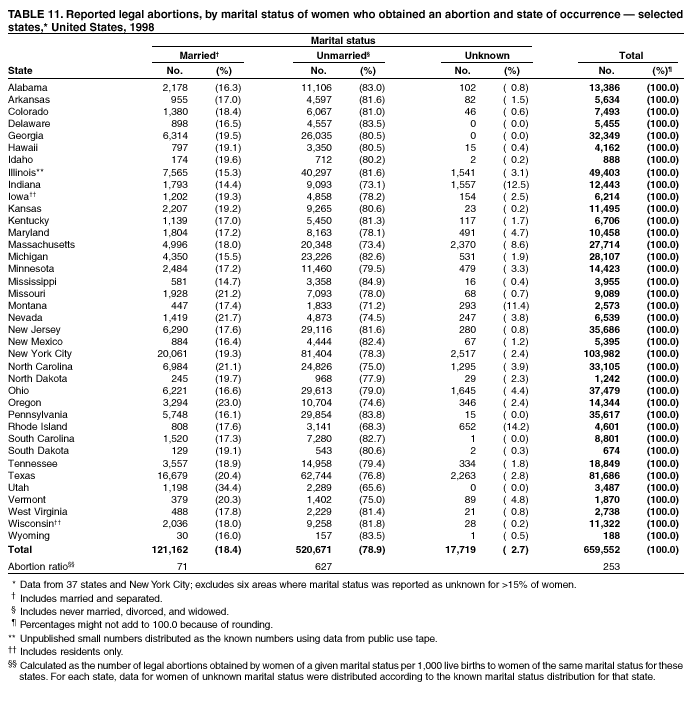
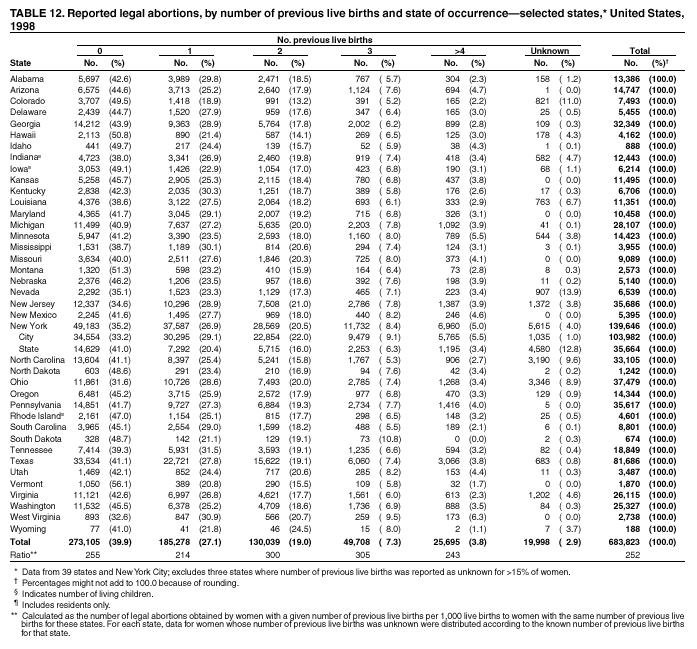
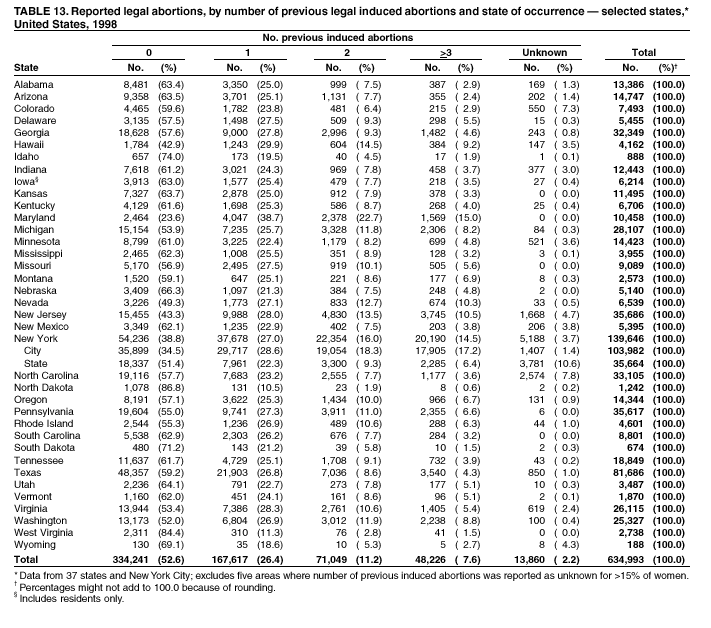
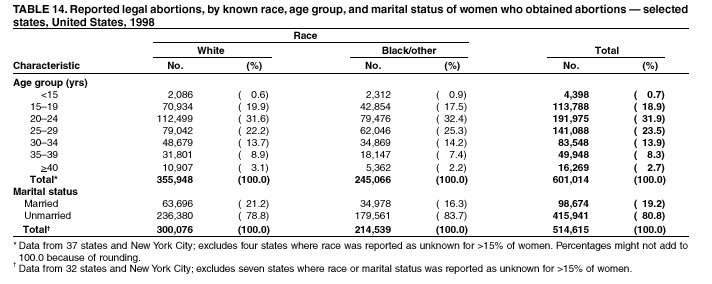
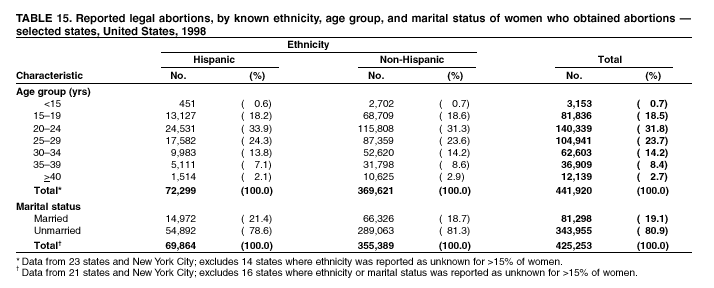
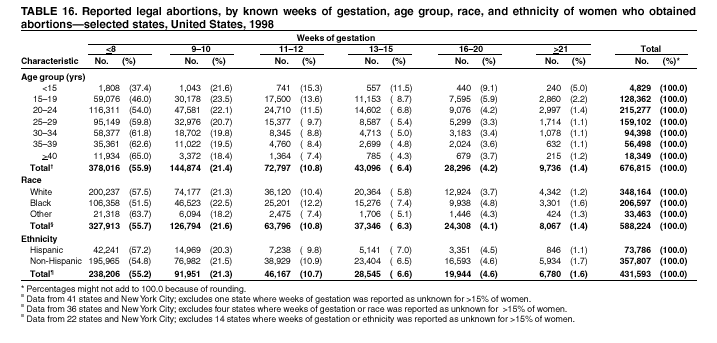
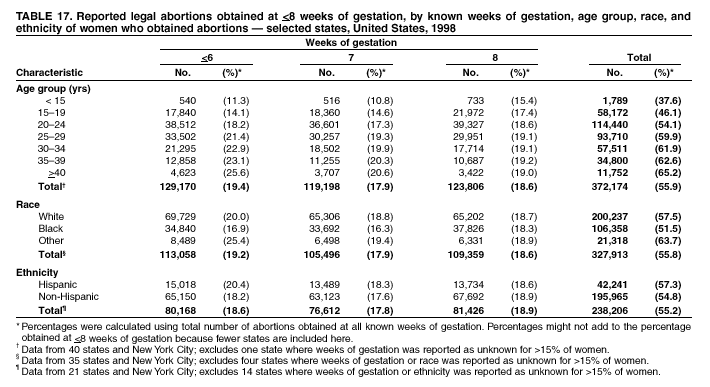
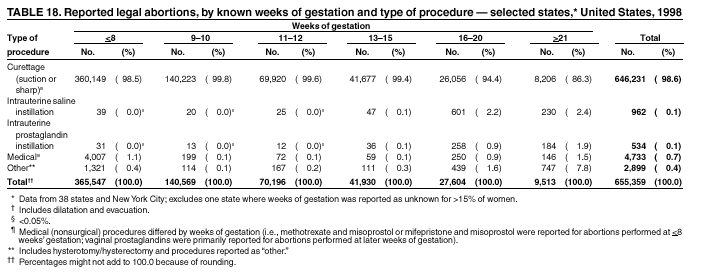
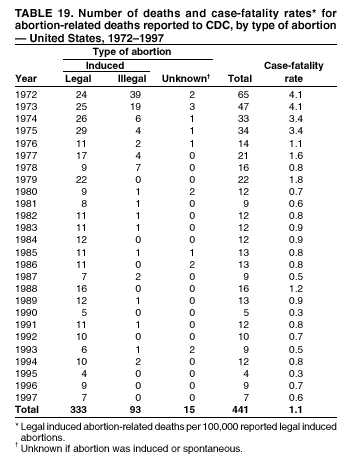
Persons using assistive technology might not be able to fully access information in this file. For assistance, please send e-mail to: mmwrq@cdc.gov. Type 508 Accommodation and the title of the report in the subject line of e-mail. Abortion Surveillance---United States, 1998Joy Herndon, M.S. Abstract Problem/Condition: In 1969, CDC began abortion surveillance to document the number and characteristics of women obtaining legal induced abortions, to monitor unintended pregnancy, and to assist efforts to identify and reduce preventable causes of morbidity and mortality associated with abortions. Reporting Period Covered: This report summarizes and reviews information reported to CDC regarding legal induced abortions obtained in the United States in 1998. Description of System: For each year since 1969, CDC has compiled abortion data by occurrence. From 1973 to 1997, data were received from or estimated for 52 reporting areas in the United States: 50 states, the District of Columbia, and New York City. In 1998, CDC compiled abortion data from only 48 reporting areas; Alaska, California, New Hampshire, and Oklahoma did not report. Results: In 1998, 884,273 legal induced abortions were reported to CDC, representing a 2% decrease from the 900,171 legal induced abortions reported by the same 48 reporting areas for 1997. The abortion ratio, defined as the number of abortions per 1,000 live births, was 264, compared with 274 in 1997 (for the same 48 areas); the abortion rate for these 48 areas was 17 per 1,000 women aged 15--44 years for both 1997 and 1998. The availability of information about characteristics of women who obtained an abortion in 1998 varied by state and by the number of states reporting each characteristic. The total number of legal induced abortions by state is reported by state of residence and state of occurrence; characteristics of women obtaining abortions in 1998 are reported by state of occurrence. Women undergoing an abortion were likely to be young (i.e., age <25 years), white, and unmarried; slightly more than one half were obtaining an abortion for the first time. Of all abortions for which gestational age was reported, 56% were performed at <8 weeks of gestation, and 88% were performed before 13 weeks. Overall, 19% of abortions were performed at the earliest weeks of gestation (<6 weeks), 18% at 7 weeks, and 19% at 8 weeks. From 1992 (when this information was first collected) through 1998, an increasing percentage of abortions were performed at the very early weeks of gestation. Few abortions were provided after 15 weeks of gestation; 4% were obtained at 16--20 weeks, and 1.4% were obtained at >21 weeks. A total of 24 reporting areas submitted information stating that they performed medical (nonsurgical) procedures (two of these areas categorized medical abortions with "other" procedures), making up <1% of all procedures reported from all states. From 1993 through 1997 (years for which data have not been published previously and the most recent years for which such data are available), 36 women died as a result of complications from known legal induced abortion, and three deaths were associated with known illegal abortion. The annual case-fatality rate of legal induced abortion ranged from 0.3 to 0.8 abortion-related deaths per 100,000 reported legal induced abortions. Interpretation: From 1990 through 1995, the number of abortions declined each year; in 1996, the number increased slightly, but in 1997, it declined to its lowest level since 1978. In 1998, the number of abortions continued to decrease when comparing the 48 reporting areas. In 1997, as in previous years, deaths related to legal induced abortions occurred rarely. Public Health Actions Taken: The number and characteristics of women who obtain abortions in the United States should continue to be monitored so that trends in induced abortion can be assessed and efforts to prevent unintended pregnancy can be evaluated. IntroductionIn 1969, CDC began conducting abortion surveillance to document the number and characteristics of women obtaining legal induced abortions, to monitor unintended pregnancy, and to assist efforts to identify and reduce preventable causes of morbidity and mortality associated with abortions. This report is based on abortion data for 1998 provided to CDC's National Center for Chronic Disease Prevention and Health Promotion (NCCDPHP), Division of Reproductive Health. MethodsFor 1998, CDC compiled data that were voluntarily provided from 48 reporting areas in the United States: 46 states (excluding Alaska, California, New Hampshire, and Oklahoma), the District of Columbia, and New York City. Legal induced abortion was defined as a procedure, performed by a licensed physician or someone acting under the supervision of a licensed physician, that was intended to terminate a suspected or known intrauterine pregnancy and to produce a nonviable fetus at any gestational age (1,2). The total number of legal induced abortions was available from all reporting areas; however, not all of these areas collected information regarding some or all the characteristics of women who obtained abortions. Because these data are reported voluntarily, several limitations exist: 1) data are reported by the state in which the abortion was performed (state of occurrence); 2) data for states that do not report were not estimated for 1998 but were estimated before 1998; and 3) data provided to state or area health departments by providers may be incomplete. Therefore, the rates and ratios in this report may reflect an undercount of abortions for some states with more stringent legal requirements for obtaining an abortion (causing women to seek abortions elsewhere) and may be an overrepresentation for some states that have many out-of-state women obtaining legal induced abortions (3). The availability of information about characteristics of women who obtained an abortion in 1998 varied by state. Most reporting areas (45 states, the District of Columbia, and New York City) collected and reported adequate abortion data (i.e., data with <15% unknown values and categorized in accordance with the study variables) by age of the woman, whereas only 23 states, the District of Columbia, and New York City collected and reported adequate abortion data by Hispanic ethnicity. Therefore, the findings in this report reflect characteristics only of women from reporting areas that submitted adequate information. Areas were excluded from specific analysis if data regarding a given characteristic were unknown for >15% of women. With two exceptions, the percentage data for each state table include unknown values; unknowns have not been redistributed for the calculation of these percentages. However, percentages based only on known values are included for trend data, out-of-area residents, adolescent ages, and two-characteristics tables. For the 48 reporting areas, data concerning the number of women obtaining legal induced abortions were provided by the central health agency.* These agencies provided information on numbers of abortions and characteristics of women by the state in which the abortions were performed (i.e., state of occurrence). For most states, only abortion totals were available by state of residence. However, one state, Wisconsin, reported characteristics only for women who were residents and who obtained abortions in the state and not for women from out of state; and one state, Iowa, provided both numbers and characteristics only for in-state residents. Occurrence data, therefore, might not accurately reflect the patterns of abortion among residents of some states and should be interpreted with caution. A large proportion of abortions that occur in some states may be obtained by residents of other states. Also, in addition to the four nonreporting states, two other states did not report abortions by residence and one state did not specify the state of residence for women from out of state, making the numbers of legal abortions by state of residence incomplete. Women who obtained legal induced abortions were categorized by 5-year age groups and by single years of age for adolescents aged 15--19 years. Both abortion ratios (number of abortions per 1,000 live births in the same age group per year) and abortion rates (number of abortions per 1,000 women in the applicable age group per year) are presented by age group. Starting with 1996, ratios were calculated by using the number of live births to residents of each area reported to CDC's National Center for Health Statistics; numbers had previously been received from state health departments. Rates were calculated by using the number of women residents of each area from tabulations provided by the US Census Bureau. Because nearly all (94%) abortions among women aged <15 years occurred among those aged 13--14 years in 1988 (the latest year for which this information is known) (4), the population of women aged 13--14 years was used as the denominator for calculating abortion rates for women <15 years. Rates for women aged >40 years were based on the number of women aged 40--44 years. Rates for all women who obtained abortions, however, were based on the population of women aged 15--44 years. Race was categorized by three groups: white, black, and all other races. "Other" races included Asian/Pacific Islander, American Indian, Alaska Native, and women classified as "other" race. As in previous reports, Hispanic ethnicity and race were provided separately and are not cross-classified by race and Hispanic ethnicity. Marital status was reported as either married (including women who were married or separated) or unmarried (including those who were never married, divorced, or widowed, except where noted). Reporting of marital status differed somewhat by state, particularly for the data used as denominators for the abortion ratios by marital status; therefore, abortion ratios by marital status should be interpreted with caution. Gestational age (in weeks) at the time of abortion was reported adequately by 44 reporting areas. In 21 areas, gestational age estimates were derived from the time elapsed since the woman's last menstrual period. For 18 other states, gestational age was reported on the basis of the physician's estimate. For the remaining five areas, gestational age came from a combination of physician's estimates (from information from the clinical examination including ultrasound results) and the time elapsed since the woman's last menstrual period. Most (42 of 44) areas that reported adequate data on weeks of gestation at the time of abortion also reported abortions performed at <8 weeks separately for <6, 7, and 8 weeks of gestation. CDC has periodically reported information on abortion-related deaths since 1972 (5,6). Sources for such information included national and state vital records, maternal mortality review committees, surveys, private citizens and groups, media reports, health-care providers, medical examiners' reports, and computerized searches of full-text newspaper databases. All deaths associated with any type of abortion (induced or spontaneous) were reviewed. For each reported induced abortion or abortion of unknown type, clinical records and autopsy reports were requested and reviewed by two medical epidemiologists to determine the cause of death and verify that the death was abortion related. An abortion-related death was defined as a death resulting from 1) a direct complication of an abortion, 2) an indirect complication caused by the chain of events initiated by abortion, or 3) aggravation of a preexisting condition by the physiologic or psychologic effects of the abortion (1,2). Each abortion-related death was then categorized as legal induced, illegal induced, spontaneous, or unknown. Included in this report are abortion-related deaths and case-fatality rates for 1972 to 1997. National case-fatality rates were calculated as the number of known legal induced abortion-related deaths per 100,000 reported legal induced abortions. ResultsIn 1998, a total of 884,273 legal induced abortions were reported to CDC by 48 reporting areas. This represents a 2% decrease from 1997, for which 900,171 legal induced abortions were reported from the same 48 reporting areas (7) (Table 1). From 1970 through 1982, the reported number of legal abortions in the United States increased every year. The largest percentage increase occurred from 1970 to 1971 (Figure 1, Table 2). From 1974 through 1982, the annual rate of increase declined and reached a low of 0.2% for 1980--1981 and for 1981--1982. From 1982 through 1986, the number of abortions fluctuated by <5% from year to year and increased moderately from 1986 to 1990. Between 1990 and 1998, the annual number of abortions decreased each year, except for 1996, when a slight increase occurred compared with 1995. The national legal induced abortion ratio increased from 1970 through 1980 and declined from 1980 to 1983. The national ratio then peaked at 364 abortions per 1,000 live births in 1984 and began to decline steadily starting in 1987, from 356 per 1,000 to 311 per 1,000 in 1995 (Figure 1, Table 2). In 1996, the national abortion ratio increased slightly to 315, but in 1997, it again decreased, to 306. When comparing the same 48 reporting areas, the abortion ratio decreased slightly from 274 (in 1997) to 264 in 1998 (Table 2). The national legal induced abortion rate increased from five abortions per 1,000 women aged 15--44 years in 1970 to 25 per 1,000 in 1980. From 1981 through 1993, the rate remained stable at 23--24 abortions per 1,000 women, then declined to 21 in 1994, and to 20 in 1995. The 1997 abortion rate of 20 per 1,000 women was relatively unchanged since 1995. When the same 48 reporting areas are compared, the abortion rate remained unchanged at 17 abortions per 1,000 women for 1997 and 1998. In 1998, as in previous years, most legal induced abortions were performed in New York City, Florida, and Texas; the fewest were performed in Wyoming, South Dakota, Idaho, and North Dakota (Table 3). In previous years, a large number of legal induced abortions also were performed in California (7). The lack of data for California explains most of the national decrease of 25% in the number of abortions reported between 1997 and 1998. For the second consecutive year, total numbers of abortions, ratios, and rates are presented by state of residence as well as by state of occurrence. Information by state of residence is not complete, however, because in addition to the four nonreporting states, three states could not provide any data concerning the residence status of all women obtaining abortions in their state. Rates and ratios by residence and occurrence may vary for a given state. In states that reported information on abortions obtained by out-of-state residents, approximately 9% of abortions in 1998 were obtained by out-of-state residents. The percentage ranged from approximately 64% in the District of Columbia to <0.5% in Hawaii (Table 3). Women aged 20--24 years were known to have obtained approximately one third (31%) of all abortions; women aged <15 years obtained <1% of all abortions in areas where age was reported (Table 4). Abortion ratios were highest for the youngest women (750 abortions per 1,000 live births for women aged <15 years and 391 per 1,000 for women aged 15--19 years) and for the oldest women (338 per 1,000 live births for women aged >40 years) (Figure 2, Table 4). The ratio was lowest for women aged 30--34 years (157 per 1,000 live births). Among adolescents, the abortion ratio was highest for those <15 years (Table 5). In contrast to abortion ratios, among women for whom age was reported, abortion rates were highest for women aged 20--24 years (36 abortions per 1,000 women) and lowest for women at the extremes of reproductive age (2 abortions per 1,000 women aged 13--14 years and 2 per 1,000 women aged 40--44 years) (Table 4). For women in most age groups, the abortion ratio increased from 1974 through the early 1980s and declined thereafter, particularly for the youngest and oldest reproductive-age women (Figure 3). Abortion ratios for women <15 years have been and remain higher than those for the other age groups. The abortion ratio for women aged 20--34 years (the groups with the highest fertility rates) (8) has remained relatively stable since the mid-1980s. In 1998, for women whose weeks of gestation at the time of abortion were adequately reported, approximately 55% of reported legal induced abortions were known to be obtained at <8 weeks of gestation, and approximately 86% at <13 weeks (Table 6). Overall, 19% of abortions were performed during the earliest weeks of gestation (<6 weeks), 17% at 7 weeks, and 18% at 8 weeks (Table 7). Few abortions were provided after 15 weeks of gestation; 4% were obtained at 16--20 weeks, and 1.4% were obtained at >21 weeks (Table 6). For women whose procedure was adequately reported, almost all (97%) abortions were known to have been performed by curettage and <0.5% by intrauterine instillation (Table 8). Hysterectomy and hysterotomy were included in the "other" procedure category and were used in fewer than 0.005% of abortions. Twenty-four reporting areas submitted information stating that they performed medical (nonsurgical) procedures† (two of these areas included medical abortions in the "other" category), making up <1% of all procedures reported from all states. However, some other reporting areas do not include medical abortions as a separate category in their abortion reporting form. In the 39 areas for which race was adequately reported, approximately 56% of women who obtained legal induced abortions were known to be white (Table 9). The abortion ratio for black women was 512 per 1,000 live births, 2.7 times the ratio for white women (189 per 1,000 live births). The abortion ratio for women of other races (336 per 1,000 live births) was approximately 1.8 times the ratio for white women. In addition, the abortion rate for black women (36 per 1,000 women) was 3.0 times the rate for white women (12 per 1,000 women). The abortion rate for women of other races was 2.0 times the rate for white women. Twenty-three states, the District of Columbia, and New York City reported adequate data§ concerning the Hispanic ethnicity of women who obtained legal induced abortions (Table 10). The percentage of abortions known to have been obtained by Hispanic women in these reporting areas ranged from <1% in several states to approximately 31% in Texas and New York City. For Hispanic women in these reporting areas, the abortion ratio was 273 per 1,000 live births, similar to the ratio for non-Hispanics in the same areas (271 per 1,000 live births). The abortion rate for Hispanic women was 20 abortions per 1,000 women; for non-Hispanic women, the abortion rate was 15 abortions per 1,000 women. For women whose marital status was adequately reported, 79% of women who obtained abortions were known to be unmarried (Table 11). The abortion ratio for unmarried women was approximately nine times the ratio for married women (627 versus 71 abortions per 1,000 live births). For women for whom information on previous live births was adequately reported, 40% of women who obtained legal induced abortions were known to have had no previous live births, and 86% had had <2 previous live births (Table 12). The abortion ratio was highest for women who had had three previous live births (305 per 1,000 live births) and lowest for women who had had one previous live birth (214 per 1,000 live births). In 1998, of women who obtained an abortion and whose number of previous abortions was adequately reported, 53% were known to have obtained an abortion for the first time. Nineteen percent of women had had >2 previous abortions (Table 13). For women whose age and race were known, a greater percentage of white women obtaining abortions tended to be in the two youngest and two oldest age groups compared with black and other women (Table 14). For women obtaining abortions whose marital status and race were known, the percentage of women of black or other races who were unmarried (84%) was higher than the percentage of white women (79%). Among women obtaining abortions whose age and Hispanic ethnicity were known (24 reporting areas), a somewhat smaller percentage of Hispanic women obtained their abortions at >35 years of age than did non-Hispanic women (Table 15). Overall, approximately 88% of all abortions (for which gestational age at time of abortion was reported and known) were obtained during the first 12 weeks of pregnancy (Table 1). For women whose age and weeks of gestation were known, the percentage of women who obtained an abortion early in pregnancy (<8 weeks of gestation) increased with age (Figure 4, Tables 16 and 17). The percentage who obtained an abortion very late in pregnancy (>21 weeks of gestation) decreased with age for women through 25--29 years and remained stable for women in older age groups (Table 16). Among women with known race and weeks of gestation, white women and women of other races were more likely than black women to obtain abortions very early in pregnancy (<6, 7, or 8 weeks of gestation) (Table 17). For women whose type of procedure and weeks of gestation were known, 99% of abortions at <15 weeks of gestation were performed by using curettage (primarily suction procedures) (Table 18). One percent of abortions performed at <8 and at >16 weeks of gestation were reported as performed by medical (nonsurgical) methods. Our study and those of others have found that more than 50% of all U.S. abortions are performed at <8 weeks of gestation, which is the timing of the regimen approved for both mifepristone and methotrexate (9). The medical (nonsurgical) procedures reported most often for abortions performed early in gestation (<7 weeks) were methotrexate with misoprostol and mifepristone with misoprostol (10,11). Intrauterine instillation involved the use of saline or prostaglandin and was used rarely, primarily at >16 weeks of gestation. From the National Pregnancy Mortality Surveillance System, CDC identified 109 maternal deaths with some indication of abortion on the death certificate for 1993 through 1997 (years for which data have not been published previously and the most recent years for which such data are available). Investigation of these cases showed that 36 of the 109 deaths were related to legal induced abortion and three to illegal induced abortion (Table 19). Thirty-nine deaths were due to spontaneous abortion, and two deaths were due to abortion of unknown type. Twenty-nine deaths were found not to be abortion related. Numbers of deaths due to legal induced abortion were highest before the 1980s; the last 5 years showed one third fewer deaths than the previous 5 years. Possible abortion-related deaths that occurred during 1998 and 1999 are being investigated. The case-fatality rate for known legal induced abortion for 1993 to 1997 was 0.6 deaths per 100,000 legal abortions (range 0.3--0.8) (Table 19, Figure 5). DiscussionFrom 1990 (the year in which the number of abortions was highest) through 1995, the annual number of abortions in the United States decreased by 15% (Table 2) (12,13). From 1995 to 1996, the number increased slightly (1.2%)(6), but declined again in 1997 by 3%. In 1998, for the same 48 reporting areas that reported in 1997, the number of abortions decreased by 1.8%. In 1996, a slight increase occurred in the abortion ratio, but in 1997, the abortion ratio was at its lowest recorded level since 1975 (14). When the same 48 reporting areas for which information is known for 1998 are compared, the abortion ratio has declined from 1996 to 1998. The 1998 abortion rate of 17 per 1,000 women of reproductive age (15--44 years) remained unchanged since 1997 for the 48 reporting areas. The historical trends in the abortion rate might reflect multiple factors, including the decreasing number of unintended pregnancies; a shift in the age distribution of reproductive-age women toward the older and less fertile ages; reduced access to abortion services, including the passage of abortion laws that affect adolescents (e.g., parental consent or notification laws and mandatory waiting periods); and changes in contraceptive practices, including an increased use of contraception, particularly of condoms, and, among young women, of long-acting hormonal contraceptive methods that were introduced in the early 1990s (15--22). (Many of these reasons also apply to the decline in abortion ratios). The induced abortion rate reported here for the United States was higher than recent rates reported for Australia, Canada, and Western European countries and lower than rates reported for China, Cuba, most Eastern European countries, and several of the Newly Independent States of the former Soviet Union (23,24). Abortion and birth rates for teenagers are higher in the United States than in most Western European countries and some Eastern European countries (25). As in previous years, the abortion ratio in 1998 varied substantially by age (7). Although the ratio was highest for adolescents, the percentage of legal induced abortions obtained by women aged <19 years has decreased since the early 1970s (from 33% in 1973 to 22% in 1990 and to 20% in 1992) and has remained at that level (Table 1) (12,26--27). From 1983 through 1998, the abortion ratio has gradually declined for women aged 15--19 years (Figure 3). Other studies have indicated a decrease in birth rates for women aged 15--19 years from 1991 through 2000 and a decrease in adolescent pregnancy rates from 1991 to 1997 (8,28--32). The differential between the overall abortion ratio for black women and that for white women has increased steadily since 1989 (33). Rates and ratios for white women include data for Hispanics; therefore, comparisons of race may differ from state to state. Census Bureau estimates and birth certificate data show that the large majority of Hispanic women report themselves as white. Race-specific differences in legal induced abortion ratios and rates might reflect differences in factors such as socioeconomic status, access to family-planning and contraceptive services, contraceptive use, and incidence of unintended pregnancies. As in the previous 3 years, the abortion-to-live-birth ratios for Hispanic women and non-Hispanic women during 1998 were similar (273 vs. 271). A 1996 report describing characteristics of women who obtain abortions stated that Hispanic women were less likely than non-Hispanic women to obtain an abortion (34). As in the past, the abortion rate per 1,000 Hispanic women was higher than the rate per 1,000 non-Hispanic women, which is consistent with several other studies (17,34). For women in all age groups, fertility was substantially higher for Hispanic than for non-Hispanic women (8). In 1998, 38 states and the District of Columbia and New York City reported Hispanic ethnicity of women who obtained abortions. Because of concerns regarding the completeness of such information (>15% unknown data) in some states, data from only 23 states, the District of Columbia and New York City were evaluated to determine the number and percentage of abortions obtained by women of Hispanic ethnicity in 1998. These geographic areas represent less than half of all reproductive-age Hispanic women in the United States in 1998 and only about 40% of U.S. Hispanic births (8,35). Thus, the number of Hispanic women who obtain abortions is underestimated, and the number, ratio, and rate of abortions for Hispanic women in this report may not be representative of the overall Hispanic population in the United States. Since 1980, the percentage distribution of abortions by gestational age has been stable, with some small increases at the earliest and latest gestational ages. Since 1992, most areas have reported abortions performed at <8 weeks using additional categories of <6, 7, and 8 weeks. From 1992 through 1998, slight decreases have occurred in the percentage of abortions performed at 8, 9--10, and 11--12 weeks, and increases have occurred in the percentage performed at the early weeks of gestation. The percentage performed at <6 weeks increased from 14.3% to 19.2%, and those at 7 weeks from 15.6% to 17.8% (Table 1). This increase in very early procedures may be related to increased availability of early abortion services since 1992 as well as to an increase in medical (nonsurgical) and surgical procedures that can be performed early in gestation (36,37). Abortions performed early in pregnancy are associated with fewer risks of mortality and morbidity (38). The proportion of abortions performed later in pregnancy (>16 weeks) has varied very little since 1992. However, interest has continued in abortions performed very late in pregnancy (>21 weeks of gestation) (39,40). Since 1997, medical (nonsurgical) legal induced abortion procedures have been included in this report. Since the mid-1990s, two medical (nonsurgical) regimens---methotrexate and mifepristone, each used in conjunction with misoprostol---have been tested in clinical trials and used by clinical practitioners to perform early medical (nonsurgical) abortions (37,41). Mifepristone for medical abortion was approved by the U.S. Food and Drug Administration for use and distribution in the United States in September 2000. This approval might result in medical (nonsurgical) induced abortions becoming more widespread (42,43). This report does not reflect whether any changes have occurred since approval. In 1997, the U.S. Standard Report of Induced Termination of Pregnancy, published by CDC's National Center for Health Statistics, was revised to include a category for "medical (nonsurgical)" procedures (44). We do not know to what extent the 4,899 medical (nonsurgical) abortions reported to CDC from 21 states and New York City represent all reporting areas. Several other considerations affect the timing of abortion. In this and previous reports, age was inversely associated with timing of abortion (7). In addition to the age of the woman, race, marital status, level of education, availability and accessibility of services, timing of confirmation of pregnancy, personal decision-making, level of fear of discovery of pregnancy and denial of pregnancy all had an impact (45,46). From 1972 through 1998, the percentage of abortions performed by curettage (which includes dilatation and evacuation [D&E]) increased from 89% to 98% (Table 1), and the percentage of abortions performed by intrauterine instillation declined sharply, from 10% to 0.3%. From 1974 through 1998, the percentage of second-trimester abortions performed by D&E (curettage) increased from 32% to 96%; the percentage of second-trimester abortions performed by intrauterine instillation decreased from 58% to 1.7% (47). The increase in use of D&E is likely due to the lower risk for complications associated with the procedure (48,49). From 1972 through 1997, the annual number of deaths associated with known legal induced abortion decreased by 71% (Table 19). In 1972, 24 women died from causes known to be associated with legal abortion, and 39 women died from known illegal abortions. In 1997, seven women died as a result of legal induced abortion, and none died as a result of illegal abortion. The case-fatality rate decreased by 86% between 1972 and 1997. These rates, consistent with previously published data for the 1970s and 1980s, indicate that the risk for death from legal induced abortion continues to be extremely low (6). The overall number, ratio, and rate of abortions from this analysis are conservative estimates because the numbers of legal induced abortions reported to CDC for 1998 were probably lower than the numbers actually performed. Totals provided by central health agencies may be lower than those obtained by direct surveys of abortion providers (50). For example, the total number of abortions reported to CDC for 1997 was approximately 12% lower than that reported for 1997 by The Alan Guttmacher Institute, a private organization that contacts abortion providers directly to obtain information concerning the total number of abortions performed (30). In addition, four states (Alaska, California, New Hampshire, and Oklahoma) did not collect abortion data and not all states collected and/or reported information (e.g., age, race, and gestational age) about women obtaining a legal induced abortion in 1998; therefore, the numbers, percentages, rates, and ratios derived from this analysis may not be representative of all women who obtained abortions. Furthermore, abortion data are compiled and reported by CDC by reporting area where the abortion occurs rather than by reporting area where the woman resides. This inflates the numbers, ratios and rates of abortions for areas where a high proportion of legal abortions are obtained by out-of-state residents and undercounts procedures for states with limited abortion services. CDC will encourage all reporting areas to compile and report complete information regarding the residential status of women obtaining abortions. Despite these limitations, findings from ongoing national surveillance for legal induced abortion are useful for several purposes. First, public health agencies use data from abortion surveillance to define characteristics of women who are at high risk for unintended pregnancy. Second, ongoing annual surveillance is used to monitor trends in the number, ratio, and rate of abortions in the United States. Third, statistics regarding the number of pregnancies ending in abortion are used in conjunction with birth data and fetal death computations to estimate pregnancy rates (e.g., pregnancy rates among adolescents) (28--30) and other outcome rates. Fourth, abortion and pregnancy rates can be used to evaluate the effectiveness of family planning programs and programs for preventing unintended pregnancy. Fifth, ongoing surveillance provides data for assessing changes in clinical practice patterns related to abortion (e.g., longitudinal changes in the types of procedures and trends in gestational age at the time of abortion). Finally, numbers of abortions are used as the denominator in calculating abortion morbidity and mortality rates (38). Welfare-reform legislation, specifically, the Personal Responsibility and Work Opportunity Reconciliation Act of 1996,¶ has increased interest in accurate state-based surveillance for induced abortion. In addition, some states have instituted programs that emphasize the prevention of unintended pregnancy, particularly among adolescents. To help guide these efforts, an ongoing, accurate assessment of induced abortion is needed in all states (particularly abortion data by state of residence) to determine the number and characteristics of women who obtain these procedures. Induced abortions usually result from unintended pregnancies, which often occur despite the use of contraception (18,51--52). In 1995, data from the National Survey of Family Growth (NSFG), conducted by the National Center for Health Statistics, indicated that approximately 31% of live births were associated with unintended pregnancy (i.e., either mistimed or unwanted at conception), and 49% of all pregnancies were unintended (15,53). Unintended pregnancy is a problem not just for adolescents, unmarried women, or poor women; it is a pervasive public health problem for all women of reproductive age (15,18,53). A reduction in unintended pregnancy, and thus abortion, will require several complex strategies. In a study of abortion patients conducted in 1994 and 1995, 58% of patients reported that they "currently used" contraception during the month of their last menstrual period; however, their use of contraception might have been inconsistent or incorrect (34). In 1995, when the most recent NSFG was conducted, approximately 29% of sexually active U.S. women who used only oral contraceptives for birth control reported that they missed a birth-control pill one or more times during the 3 months before their NSFG interview. In addition, approximately 33% of U.S. women who were using only coitus-dependent contraceptive methods** during the 3 months before the interview used these methods inconsistently (15). At present, not all health insurance plans provide full contraceptive benefits (54). Therefore, education regarding improved contraceptive use and practices as well as access to and education regarding safe, effective, and affordable contraception and family-planning services might help reduce the incidence of unintended pregnancy and, therefore, might reduce the use of legal induced abortion in the United States (55--57). Copies of this and other MMWR reports containing statistical and epidemiologic information about abortions can be obtained through the CDC Website at <http://www.cdc.gov/ nccdphp/drh/surv_abort.htm>. Acknowledgments The authors thank Cynthia Berg, Sonya Bowens, Elizabeth Fitch, and Jeani Chang with the Division of Reproductive Health, NCCDPHP, CDC for their critical work with data compilation, statistics, and computer programming for this surveillance project. References
* Includes state health departments and the health departments of New York City and the District of Columbia. † Medical (nonsurgical) induced abortion procedures involve the administration of a medication or medications to induce an abortion. § After excluding 15 states for which ethnicity data were unknown for >15% of women who obtained an abortion. ¶ Section 103 of P.L. 104-193 provides for additional welfare funding for as many as five states if a) the birth rate of infants to unwed mothers is decreased and b) the rate of induced pregnancy terminations is less than the rate for 1995 (the baseline year). **Coitus-dependent contraceptive methods include male or female condoms, diaphragm, sponge, cream, jelly, or other methods that must be used at the time intercourse occurs. Table 1 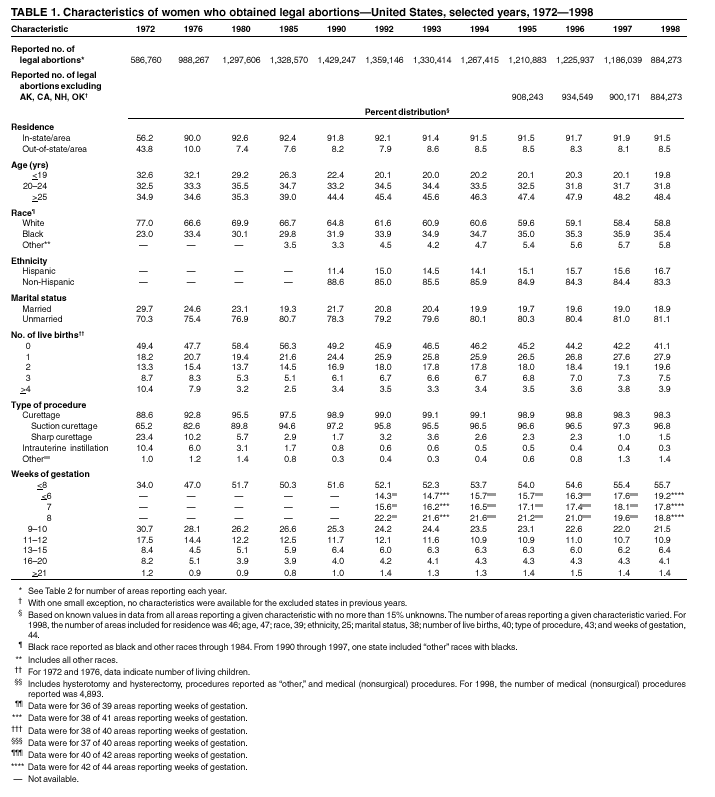 Return to top. Figure 1 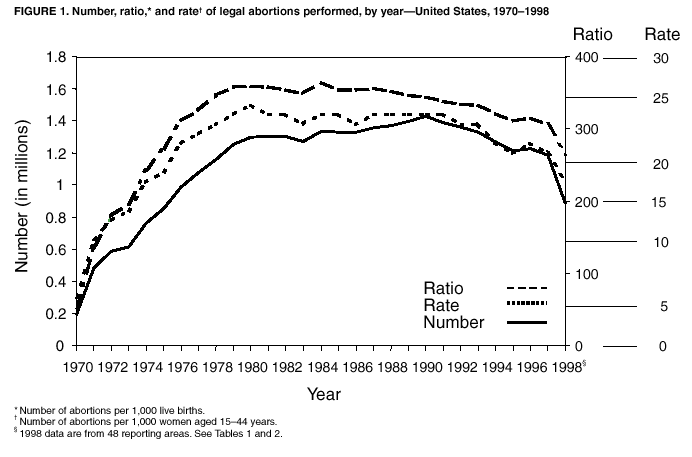 Return to top. Table 2 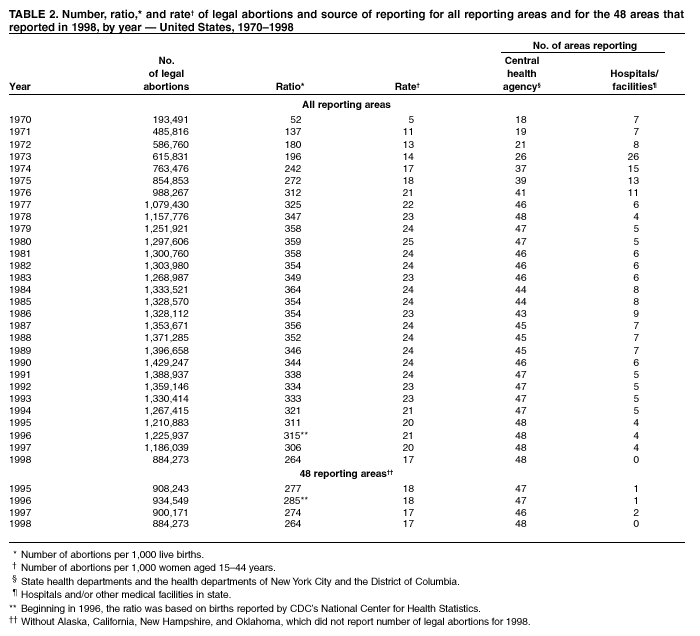 Return to top. Figure 2 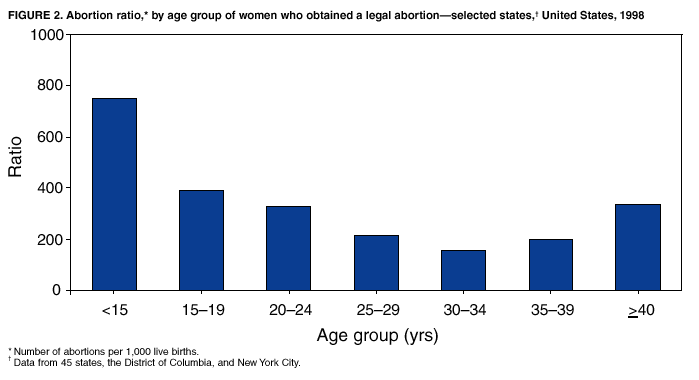 Return to top. Table 3 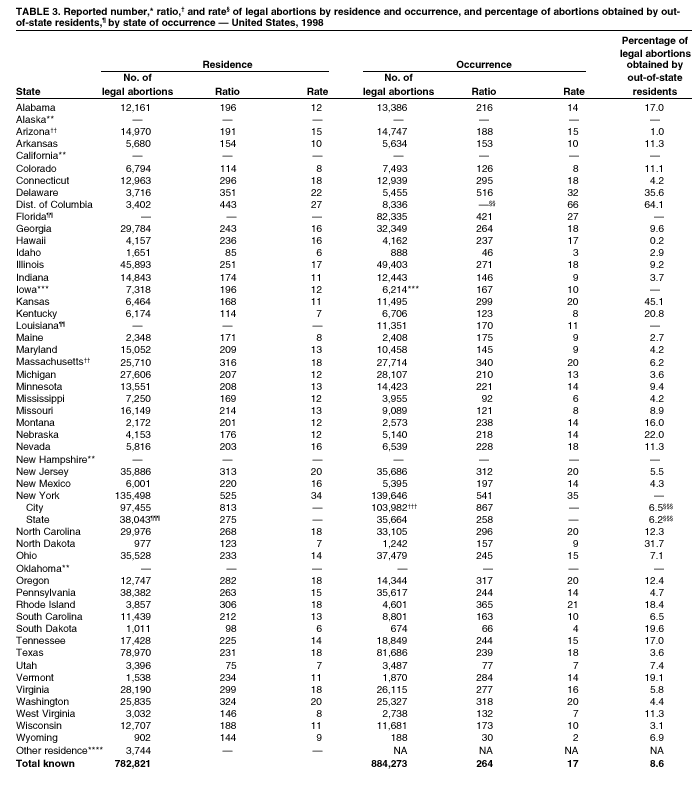
Disclaimer All MMWR HTML versions of articles are electronic conversions from ASCII text into HTML. This conversion may have resulted in character translation or format errors in the HTML version. Users should not rely on this HTML document, but are referred to the electronic PDF version and/or the original MMWR paper copy for the official text, figures, and tables. An original paper copy of this issue can be obtained from the Superintendent of Documents, U.S. Government Printing Office (GPO), Washington, DC 20402-9371; telephone: (202) 512-1800. Contact GPO for current prices. **Questions or messages regarding errors in formatting should be addressed to mmwrq@cdc.gov.Page converted: 5/31/2002 |
|||||||||
This page last reviewed 5/31/2002
|