 |
|
|
|
|
|
|
| ||||||||||
|
|
|
|
|
|
|
||||
| ||||||||||
|
|
|
|
|
Persons using assistive technology might not be able to fully access information in this file. For assistance, please send e-mail to: mmwrq@cdc.gov. Type 508 Accommodation and the title of the report in the subject line of e-mail. Abortion Surveillance -- United States, 1992Lisa M. Koonin, M.N., M.P.H. Jack C. Smith, M.S. Merrell Ramick Clarice A. Green, M.D., M.S. Division of Reproductive Health National Center for Chronic Disease Prevention and Health Promotion Abstract Problem/Condition: From 1980 through 1992, the number of legal induced abortions reported to CDC remained stable, varying each year by less than or equal to 5%. Reporting Period Covered: This report summarizes and reviews information reported to CDC regarding legal induced abortions obtained in the United States during 1992. This report also includes recently reported abortion-related deaths for 1988-1990 and an update on abortion-related deaths for 1985-1987. Description of System: For each year since 1969, CDC has compiled abortion data received from 52 reporting areas (i.e., the 50 states, the District of Columbia, and New York City). Results: In 1992, 1,359,145 abortions were reported -- a 2.1% decrease from 1991. The abortion ratio was 335 legal induced abortions per 1,000 live births, and the abortion rate was 23 per 1,000 women 15-44 years of age. Women who were undergoing an abortion were more likely to be young, white, and unmarried; most had had no previous live births and were obtaining an abortion for the first time. More than half (51%) of all abortions were performed at or before the 8th week of gestation, and 87% were before the 13th week. Approximately 14% of abortions were performed at less than or equal to 6 weeks of gestation, 15% were performed at 7 weeks of gestation, and 22% at 8 weeks of gestation. Younger women (i.e., women less than or equal to 19 years of age) were more likely to obtain abortions later in pregnancy than were older women. Sixteen deaths in 1988, 12 deaths in 1989, and five deaths in 1990 were associated with legal induced abortion. The case-fatality rates for 1988, 1989, and 1990, respectively, were 1.2, 0.9, and 0.3 abortion-related deaths per 100,000 legal induced abortions. Interpretation: Since 1980, the number and rate of abortions have remained relatively stable, with only small year-to-year fluctuations of less than or equal to 5%. However, since 1987, the abortion-to-live-birth ratio has declined; in 1992, the abortion ratio was the lowest recorded since 1977. More pregnant women have been opting to carry their pregnancies to term rather than choosing to have an abortion. As in previous years, deaths associated with legal induced abortions occurred rarely (i.e., one or fewer deaths per 100,000 legal induced abortions). Actions Taken: The number and characteristics of women who obtain abortions in the United States should continue to be monitored so that efforts to prevent unintended pregnancy can be assessed and the preventable causes of morbidity and mortality associated with abortions can be identified and reduced. INTRODUCTION In 1969, CDC began abortion surveillance to document the number and characteristics of women obtaining legal induced abortions, to monitor unintended pregnancy, and to assist with efforts to identify and reduce preventable causes of morbidity and mortality associated with abortions. This report is primarily based on surveillance data for 1992 provided to the Division of Reproductive Health in CDC's National Center for Chronic Disease Prevention and Health Promotion. METHODS For 1992, CDC compiled data from 52 reporting areas: the 50 states, the District of Columbia, and New York City. The total number of legal induced abortions was available from all reporting areas; however, not all these areas collected information on the characteristics of women who obtained abortions. Characteristics by age of women who obtained an abortion were available for only 41 states, the District of Columbia, and New York City (which together comprised 62% of abortions reported for 1992); and characteristics by race were available for only 34 states, the District of Columbia, and New York City (51% of abortions). For 47 reporting areas, data were provided from the central health agency; * for the other five areas, data were provided from hospitals and other medical facilities. Because information regarding residence was unavailable for the majority of women who obtained abortions, the procedures were reported by the state in which they were performed. Women who obtained legal induced abortions were grouped by 5-year age groups. Both ratios (i.e., the number of abortions per 1,000 live births per year) and rates (the number of abortions per 1,000 women per year) are presented by age group. Ratios were calculated by using the number of live births provided by each state's central health agency (except where noted), and rates were calculated by using the number of women reported in special unpublished tabulations provided by the Bureau of the Census. Because almost all (94%) abortions among women less than 15 years of age occur among those 13-14 years of age (1), the number of women ages 13-14 years was used as the denominator for calculating abortion rates for the less than 15-years' age group. Rates for women greater than or equal to 40 years of age were based on the number of women ages 40-44 years. Race was categorized by either three groups (i.e., a} white {which included Hispanics}, b} black, and c} all other races) or two groups (a} white {which included Hispanics} and b} black and all other races). Other races included Asian/Pacific Islander, Native American, Alaskan Native, and women classified as "other race." In 1990, data regarding Hispanic ethnicity were first available on abortion reports submitted to CDC by central health agencies. In this report for 1992, as in the report for 1991, Hispanic ethnicity was reported separately from race. In 1992, for the first time, most areas reported week of gestation at the time of abortion for abortions that occurred at less than or equal to 8 weeks of gestation. Most areas reported gestational age (in weeks) at the time of abortion from estimates derived from the time elapsed since the woman's last menstrual period. In eight states, gestational age was reported on the basis of the physician's estimate, which could have included information from the clinical examination as well as the time elapsed since the last menstrual period. CDC has periodically reported data on abortion-related deaths since 1972. Sources for obtaining such data include national and state vital records, maternal mortality review committees, surveys, private citizens, the media, health-care providers, and medical examiner reports. Clinical records and autopsy reports are requested and reviewed by medical epidemiologists to determine the cause of death and to verify that the death was abortion-related. An abortion-related death was defined as a death resulting from a) a direct complication of an abortion, b) an indirect complication caused by the chain of events initiated by the abortion, or c) aggravation of a preexisting condition by the physiologic or psychologic effects of the abortion. Each death was then further categorized either as a) not abortion-related or b) legal induced, illegal induced, spontaneous, or unknown depending on the type of abortion. Abortion-related deaths that occurred during 1988-1990 are included in this report. Also included are trends in case-fatality rates for legal induced abortion for 1972-1990 and updated totals for 1985-1987 that include abortion-related deaths not previously reported to CDC (2). RESULTS For 1992, 1,359,145 legal abortions were reported to CDC, representing a 2.1% decrease from the number reported for 1991 (3) (Table_1). From 1970 through 1982, the reported number of legal abortions in the United States increased every year (Figure_1); the largest percentage increase occurred from 1970 to 1972. From 1976 through 1982, the annual increase declined continuously and reached a low of 0.2% for 1980-1981. From 1980 through 1990, the number of abortions increased steadily; however, year-to-year fluctuations were less than or equal to 5%. Since 1990, the annual number of abortions has decreased slightly each year. The national abortion ratio increased from 1970 to 1980, peaked at 364 per 1,000 live births in 1984, and began to decline steadily after 1987 to 335 per 1,000 in 1992 (Figure_1; Table_2). The national abortion rate increased from 17 abortions per 1,000 women ages 15-44 years in 1974 to 25 per 1,000 in 1980 and has since remained at a rate of 23-24 per 1,000. In 1992, as in previous years, most abortions were performed in California, Florida, New York City, and Texas; the fewest were performed in Idaho, North Dakota, South Dakota, and Wyoming (3,4) (Table_3). For women whose state of residence was known, approximately 92% had obtained the abortion within their own state. The percentage of abortions obtained by out-of-state residents ranged from approximately 53% in the District of Columbia to less than 1% in Hawaii. Ten reporting areas could not provide data concerning abortions obtained by out-of-state residents. In 1992, 41 states, the District of Columbia, and New York City reported legal abortions by age. Women ages 20-24 years obtained 34% of all abortions; women ages less than 15 years obtained less than 1% of all abortions (Table_4). Abortion ratios were highest for the youngest women (790 abortions per 1,000 live births for women ages less than 15 years and 440 per 1,000 for women ages 15-19 years) and the oldest women (454 per 1,000 for women ages greater than or equal to 40 years); the ratio was lowest for women ages 30-34 years (183 per 1,000 women) (Figure_2). Among teenagers, the abortion ratio was highest for those who were less than 15 years of age and lowest for those who were 19 years of age (Table_5). In contrast, abortion rates were highest for women ages 20-24 years (42 abortions per 1,000 women) and lowest for women at the reproductive-age extremes (three abortions per 1,000 women ages less than 15 years and two abortions per 1,000 women ages greater than or equal to 40 years) (Table_4). For most age groups, the abortion ratio rose between 1974 and the early to mid-1980s and declined thereafter, particularly for the youngest and oldest women of reproductive age (Figure_3). The abortion ratio for women less than 15 years of age remains higher than ratios for the other age groups. The abortion ratio for women 15-19 years of age had decreased for 5 consecutive years when, in 1992, the lowest abortion ratio for that age group was reported. The abortion ratio for women 20-34 years of age (i.e., the group with the highest fertility rate) has remained stable since the mid-1980s (5). Thirty-seven states, the District of Columbia, and New York City reported the gestational age (in weeks) for women who obtained a legal abortion (Table_6A). Of these reporting areas, 35 states and New York City included the gestational age in weeks for abortions performed at less than or equal to 8 weeks of gestation (Table_6B). During 1992, approximately 51% of reported legal abortions were obtained at less than or equal to 8 weeks of gestation, and about 87% were obtained at less than 13 weeks (Table_6A). Approximately 14% of abortions were performed during the earliest weeks of gestation (i.e., at less than or equal to 6 weeks), and approximately 15% and 22% were performed at 7 weeks and 8 weeks of gestation, respectively (Table_6B). Few abortions were provided after 15 weeks of gestation -- approximately 4% of abortions were obtained at 16-20 weeks of gestation, and 1.5% were obtained at greater than or equal to 21 weeks (Figure_4). Approximately 98% of legal abortions were performed by curettage, and less than 1% by intrauterine saline or prostaglandin instillation (Table_7). Hysterectomy and hysterotomy were used in only a few cases; less than 0.006% of abortions were performed by using these methods. Thirty-four states, the District of Columbia, and New York City reported the race of women who obtained legal abortions. As in previous years, almost two thirds of women who obtained abortions were white (3,4) (Table_8). The abortion ratio for black women (518 per 1,000 live births), however, was more than twice that for white women (236 per 1,000 live births). The abortion ratio for women of other races (352 per 1,000 live births) was approximately 1.5 times greater than that for white women. In addition, the abortion rate for black women (41 per 1,000 black women) was 2.7 times greater than the rate for white women (15 per 1,000 white women). Twenty states, the District of Columbia, and New York City reported data on legal abortions classified by Hispanic ethnicity (Table_9). The percentage of abortions obtained by Hispanic women in these reporting areas ranged from less than 1% in several states to approximately 39% in New Mexico. For Hispanic women in these reporting areas, the abortion ratio was 307 per 1,000 live births -- slightly lower than the ratio for non-Hispanics in the same areas (326 per 1,000 live births). However, the abortion rate per 1,000 Hispanic women (32 per 1,000 women) was greater than the rate per 1,000 non-Hispanic women (21 per 1,000 women). Seventy-six percent of women who obtained abortions were unmarried (Table_10). The percentage varied by state, from 59% in Utah to 85% in Mississippi and Wisconsin. The abortion ratio was more than nine times greater for unmarried women than for married women (790 vs. 84 abortions per 1,000 live births). Approximately 46% of women who obtained legal abortions had had no previous live births, and about 89% had had two or fewer previous live births (Table_11). The abortion ratio was highest for women who had had no live births and lowest for women who had had one live birth. About 54% of the women were obtaining an abortion for the first time. Approximately 17% of the women had had at least two previous abortions (Table_12). The age distribution of women who obtained a legal abortion differed only slightly by race (Table_13). However, the percentage of women who were black or of other races and who were less than 15 years of age at the time they obtained an abortion, although small (1.2%), was twice the percentage of white women less than 15 years of age (0.6%). The percentage of unmarried women who were black or of other races (82%) was also slightly higher than the percentage who were white (77%). Few differences were found by age and Hispanic ethnicity (Table_14), but among married women who had obtained an abortion, a slightly higher percentage were Hispanic than non-Hispanic. Most (87%) women obtained an abortion during the first 12 weeks of pregnancy; however, teenagers (i.e., women ages less than or equal to 19 years) were more likely than older women to obtain abortions later in pregnancy (Table_15A and Table_15B). The percentage of women who obtained an abortion early in pregnancy (i.e., at less than or equal to 8 weeks of gestation) increased with age, and the percentage who obtained an abortion late in pregnancy (at greater than or equal to 16 weeks of gestation) decreased with age (Figure_5). Women who were black or of other races were more likely to obtain an abortion later in pregnancy than were white women (Table_15A). Although Hispanic women were slightly more likely than non-Hispanic women to have had an abortion at less than or equal to 8 weeks of gestation, the overall differences between Hispanic and non-Hispanic women in the timing of abortions were minimal. More than 99% of abortions at less than or equal to 12 weeks of gestation were performed by curettage (primarily suction procedures) (Table_16). After 12 weeks of gestation, the most frequently used procedure was also curettage, although it was usually reported as dilatation and evacuation (D&E). Approximately half of the intrauterine instillations involved the use of saline and were performed at greater than or equal to 16 weeks of gestation. Thirty-one possible abortion-related deaths were reported to CDC for 1988. Twenty-four of these deaths were categorized as having an abortion-related cause (i.e., 16 deaths were associated with legal induced abortions, and eight deaths with spontaneous abortion) (Table_17). The remaining seven deaths were classified as not abortion-related. Twenty-seven possible abortion-related deaths were reported to CDC for 1989. Of these deaths, 17 were associated with abortion-related causes (i.e., 12 deaths were associated with legal induced abortion, one with illegal induced abortion, and four with spontaneous abortion). Ten deaths were classified as not abortion-related. A total of 18 possible abortion-related deaths were reported to CDC for 1990. Ten of these deaths resulted from abortion-related causes (i.e., five deaths were associated with legal induced abortion and five with spontaneous abortion). The remaining eight deaths were classified as not abortion-related. Possible abortion-related deaths for 1991 through 1993 are being investigated and have not yet been categorized. The updated total numbers of abortion-related deaths for 1985, 1986, and 1987 include one additional death per year that had not been reported previously to CDC (Table_17). Thus, the total number of legal abortion-related deaths per year for 1985 and 1986 increased from 10 to 11, and for 1987 the total increased from six to seven. The case-fatality rate for both 1985 and 1986 remained at 0.8, whereas for 1987 it increased from 0.4 to 0.5 deaths per 100,000 legal induced abortions. In 1987, four deaths that were classified originally as being related to spontaneous abortions were reclassified after further investigation as not being abortion-related. Since 1980, the case-fatality rate for deaths associated with legal induced abortions has remained at less than or equal to one death per 100,000 legal induced abortions (Figure_6). DISCUSSION When compared with the numbers reported for previous years, the number of abortions performed each year since 1980 in the United States has remained relatively stable. However, the number has been decreasing since 1990 (i.e., the year in which the number of abortions was highest) (4). In 1992, the national abortion-to-live-birth ratio was the lowest recorded since 1977. The abortion ratio increased steadily from 1970 through 1980, decreased slightly during 1981-1983, increased to its highest level in 1984, remained fairly stable until 1987, and then began to decline (Figure_1). More pregnant women were opting to carry their pregnancies to term rather than have an abortion. Other factors that could have contributed to this effect included reduced access to abortion services, changes in contraceptive practices, attitudinal changes concerning abortion and/or carrying unplanned pregnancies to term, and the possibility that the number of unintended pregnancies have decreased (6-8). In other countries, the annual rate for legal abortions per 1,000 women of reproductive age has ranged from greater than 100 in the former Soviet Union to five in the Netherlands (9). The induced abortion rate in the United States for 1992 was higher than that reported by Australia, Canada, and Western European countries, and lower than that reported by China, Cuba, the Eastern European countries, and the Newly Independent States of the former Soviet Union (9). Abortion rates for teenagers were higher in the United States than in most Western European countries and some Eastern European countries (9). As in previous years, the abortion ratio in 1992 varied substantially by age (3,4). Although the ratio was highest for teenagers, the percentage of legal abortions obtained by women less than or equal to 19 years of age has decreased steadily since the mid-1980s -- from 26% in 1984 to 22% in 1990 and to 20% in 1992 (4,10). Since 1980, the abortion ratio declined for most age groups -- particularly for women less than or equal to 19 years of age and greater than or equal to 40 years of age. In 1992, the abortion ratio for teenagers 15-19 years of age was the lowest ratio CDC had ever recorded for that age group. Variations in rates of childbearing among teenagers may have accounted for some of the decline in abortion ratios for these women (5), as well as changing access to abortion services (7), recent changes in abortion laws (e.g., parental consent or notification laws and mandatory waiting periods) -- all of which are likely to disproportionately affect adolescents (11,12). During 1992, the abortion ratio for black women was more than twice that for white women, and the abortion rate for black women was about three times that for white women. Race-specific differences in abortion ratios and rates may reflect differences in factors such as socioeconomic status, contraceptive use, and access to family planning, contraceptive, and abortion services. The abortion-to-live-birth ratio for Hispanic women during 1992 was slightly lower than that for non-Hispanic women. Other published reports indicate that pregnant Hispanic women are less likely than pregnant non-Hispanic women to obtain an abortion (13). The abortion rate per 1,000 Hispanic women was higher than that for non-Hispanic women. Other studies using previously published data also reported higher abortion rates for Hispanic women than for non-Hispanic women (13). For women in all age groups, fertility was higher for Hispanic than for non-Hispanic women (5). However, in 1992, as in 1991, only 20 states, the District of Columbia, and New York City reported the number and percentage of abortions by Hispanic ethnicity; these geographic areas represented approximately 43% of all Hispanic women of reproductive age in the United States for that year (CDC, unpublished data). Thus, the number, ratio, and rate of abortions for Hispanic women reported in this surveillance summary might not be representative of the overall Hispanic population in the United States (i.e., these data might reflect utilization of abortion services only in these states). The percentage distribution of abortions by gestational age was stable from 1980 through 1992 (Table_1). For the first time since CDC began abortion surveillance, data concerning week of gestation for abortions obtained at less than or equal to 8 weeks of gestation were available. These data will assist researchers in monitoring trends in legal abortions as new medical methods of terminating pregnancy are developed; these new methods will be used primarily to terminate pregnancies at less than or equal to 8 weeks of gestation (14-16). In this and previous reports, age was inversely associated with timing of abortion. Younger women (i.e., women greater than or equal to 19 years of age) were more likely to obtain an abortion later in gestation than were older women (3,17,18). The percentage of women who were obtaining an abortion for the first time decreased from 75% in 1974 to 54% in 1992 (Table_12) (19). During this period, the percentage of women who were obtaining an abortion and who previously had had one induced abortion increased from 10% in 1974 to 25% in 1985 and to 27% in 1992 (10). The percentage who had had two previous abortions increased from approximately 1% in 1974 to approximately 10% in 1985; from 1985 through 1992, the percentage remained at approximately 9%-11%. The percentage who had had three or more abortions increased from 0.4% in 1974 to approximately 5% in 1985; from 1990 through 1992, this percentage remained at 6%. Because the percentage of all legal induced abortions that are repeat procedures increases with the abortion rate, the percentage of repeat procedures increased during the 1970s and early 1980s as the abortion rate rose; since then, the abortion rate and the proportion of abortions that are repeat procedures have stabilized (20,21). From 1972 to 1992, the percentage of abortions performed by curettage (which includes D&E) increased from 89% to 99% (Table_1), and the percentage of abortions performed by intrauterine instillation and by hysterectomy and hysterotomy declined substantially (from 10.4% to 0.7% and from 0.6% to 0.01%, respectively). From 1974 through 1992, the percentage of second-trimester abortions performed by D&E increased from 31% to 90%; the percentage of second-trimester abortions performed by intrauterine instillation decreased from 57% to 3% (19). The increasing use of D&E might have resulted from the lower risk for complications associated with the procedure (22,23). From 1972 (when CDC's surveillance of abortion mortality began) through 1990, the annual number of reported deaths associated with legal induced abortion decreased 79% (24). In 1972, 63 reported deaths were attributed to complications of induced abortion. Of these deaths, 24 (38%) were associated with legal induced abortion and 39 (62%) with illegal induced abortion. In 1990, five deaths attributed to legal induced abortion were reported. The case-fatality rate decreased approximately 93% between 1972 (4.1 deaths per 100,000 legal induced abortions) and 1990 (0.3 deaths per 100,000 legal induced abortions) (Figure_6). These case-fatality rates have remained at one or fewer deaths per 100,000 legal induced abortions since 1980, indicating that a woman's risk for death from having had a legal induced abortion continues to be extremely low (25-27). The numbers, ratios, and rates of abortion from this analysis are conservative estimates because the number of legal abortions reported to CDC for 1992 was probably lower than the number actually performed. Totals provided by central health agencies are often lower than those obtained by direct surveys of abortion providers (24). For example, the total number of abortions reported to CDC for 1992 was approximately 11% lower than that reported to The Alan Guttmacher Institute (AGI), a private organization that directly contacts abortion providers to obtain information on the number of abortions performed (Figure_7) (8). However, since 1987, the percentage difference in the number of abortions reported to AGI compared with the number reported to CDC has decreased. In addition, information regarding personal characteristics (e.g., gestational age and the woman's age and race) was not available from all states; therefore, the numbers, percentages, ratios, and rates derived from this analysis may not be representative of all women who obtained abortions during 1992. Despite these limitations, findings from ongoing national surveillance of legal induced abortion are used for several purposes. First, data from abortion surveillance are used to identify characteristics of women at high risk for unintended pregnancy. Second, ongoing annual surveillance is essential to monitor trends in the number, ratio, and rate of abortions in the United States. Third, statistics on the number of pregnancies ending in abortion are used in conjunction with birth statistics to estimate pregnancy rates (e.g., pregnancy rates among teenagers) (28,29) and other outcome rates (e.g., the rate of ectopic pregnancies per 1,000 pregnancies). Fourth, abortion and pregnancy rates can be used to evaluate the effectiveness of family planning services and programs for preventing unintended pregnancy. Fifth, ongoing surveillance provides data for assessing changes in clinical practice patterns related to abortion (e.g., changes in the types of procedures used). Finally, these data are used as the denominator in calculating abortion morbidity and mortality rates. Induced abortions are linked usually to unintended pregnancies, which often occur despite use of contraception (13,30,31). In the late 1980s, about 1.2 million live births occurred for which the pregnancy was unintended (i.e., either mistimed or unwanted at conception) (32). Improved contraceptive practices, as well as access to and education regarding safe, effective, and low-cost contraception and family planning services, can help minimize the frequency of abortion in the United States (33). Not all states have acknowledged the need for state-based surveillance of induced abortion, and some states that have recognized the need have been unable to gather such information. Moreover, many states emphasize the prevention of unintended pregnancy, particularly among teenagers. To help guide this effort, however, an ongoing, accurate assessment of induced abortion is needed to determine the number and characteristics of women who obtain these procedures. Additional statistical and epidemiologic information about legal induced abortions is available from CDC's automated Reproductive Health Information System (telephone {404} 330-1230), which provides information by fax, voice recordings, or mail. References
Includes state health departments and the health departments of New York City and the District of Columbia. Table_1 Note: To print large tables and graphs users may have to change their printer settings to landscape and use a small font size.
TABLE 1. Characteristics of women who obtained legal abortions -- United States, selected years, 1972-1992
==================================================================================================================================================================================
Characteristic                  1972        1973        1976        1980        1985        1987        1989        1990        1991        1992
------------------------------------------------------------------------------------------------------------------------------------------------------
Reported no.
  of legal abortions            586,760     615,831     988,267   1,297,606   1,328,570   1,353,671   1,396,658   1,429,577   1,388,937   1,359,145

                                                                             Percent distribution *
                              ------------------------------------------------------------------------------------------------------------------------
Residence
  In-state                         56.2        74.8        90.0        92.6        92.4        91.7        91.0        91.8        91.6        92.0
  Out-of-state                     43.8        25.2        10.0         7.4         7.6         8.3         9.0         8.2         8.4         8.0

Age (yrs)
   <=19                            32.6        32.7        32.1        29.2        26.3        25.8        24.2        22.4        21.0        20.1
  20-24                            32.5        32.0        33.3        35.5        34.7        33.4        32.6        33.2        34.4        34.5
   >=25                            34.9        35.3        34.6        35.3        39.0        40.8        43.2        44.4        44.6        45.4

Race
  White                            77.0        72.5        66.6        69.9        66.6        66.4        64.2        64.8        63.8        61.5
  Black                            23.0 +      27.5 +      33.4 +      30.1 +      29.8        29.3        31.2        31.8        32.5        33.9
  Other &                            --          --          --          --         3.5         4.3         4.6         3.4         3.7         4.6

Hispanic ethnicity
  Hispanic                           --          --          --          --          --          --          --         9.8        13.5        15.2
  Non-Hispanic                       --          --          --          --          --          --          --        90.2        86.5        84.8

Marital status
  Married                          29.7        27.4        24.6        23.1        19.3        20.8        20.1        21.7        21.4        20.8
  Unmarried                        70.3        72.6        75.4        76.9        80.7        79.2        79.9        78.3        78.6        79.2

No. of live births @
    0                              49.4        48.6        47.7        58.4        56.3        53.6        52.2        49.2        47.8        45.9
    1                              18.2        18.8        20.7        19.4        21.6        22.8        23.6        24.4        25.3        25.9
    2                              13.3        14.2        15.4        13.7        14.5        15.5        15.9        16.9        17.5        18.0
    3                               8.7         8.7         8.3         5.3         5.1         5.5         5.7         6.1         6.4         6.7
  >=4                              10.4         9.7         7.9         3.2         2.5         2.6         2.6         3.4         3.0         3.5

Type of procedure
  Curettage                        88.6        88.4        92.8        95.5        97.5        97.2        98.8        98.8        98.9        98.9
    Suction curettage              65.2        74.9        82.6        89.8        94.6        93.4        97.1        96.0        97.3        97.0
    Sharp curettage                23.4        13.5        10.2         5.7         2.9         3.8         1.7         2.8         1.6         1.9
  Intrauterine instillation        10.4        10.4         6.0         3.1         1.7         1.3         0.9         0.8         0.7         0.7
  Other **                          1.0         1.2         1.2         1.4         0.8         1.5         0.3         0.4         0.4         0.4

Wks of gestation
   <=8                             34.0        36.1        47.0        51.7        50.3        50.4        49.8        51.6        52.3        52.1
     <=6                             --          --          --          --          --          --          --          --          --        14.1 ++
       7                             --          --          --          --          --          --          --          --          --        15.4 ++
       8                             --          --          --          --          --          --          --          --          --        21.9 ++
   9-10                            30.7        29.4        28.1        26.2        26.6        26.0        25.8        25.3        25.1        24.2
  11-12                            17.5        17.9        14.4        12.2        12.5        12.4        12.6        11.7        11.5        12.0
  13-15                             8.4         6.9         4.5         5.1         5.9         6.2         6.6         6.4         6.1         6.0
  16-20                             8.2         8.0         5.1         3.9         3.9         4.2         4.2         4.0         3.9         4.2
   >=21                             1.2         1.7         0.9         0.9         0.8         0.8         1.0         1.0         1.1         1.5
------------------------------------------------------------------------------------------------------------------------------------------------------
 * Excludes unknown values. The number of areas reporting a given characteristic varied. For 1992, the number of areas reporting residence was 42; age, 43; race, 36; ethnicity,
   22; marital status, 39; number of live births, 39; type of procedure, 40; and weeks of gestation, 39.
 + Reported as black and other races.
 & Includes all other races.
 @ For 1972, 1973, and 1976, data indicate number of living children.
** Includes hysterotomy and hysterectomy.
++ Data are for 36 reporting areas only.

-- Not available.
==================================================================================================================================================================================
Return to top. Table_2 Note: To print large tables and graphs users may have to change their printer settings to landscape and use a small font size.
TABLE 2. Number, ratio, * and rate + of legal abortions and source of reporting --
United States, 1970-1992
=============================================================================================================
                                                  No. of areas reporting
                                              ------------------------------
          Total no. of                            Central        Hospitals/
Year     legal abortions   Ratio     Rate     health agency &   Facilities @
----------------------------------------------------------------------------
1970          193,491        52        5            18                7
1971          485,816       137       11            19                7
1972          586,760       180       13            21                8
1973          615,831       196       14            26               26
1974          763,476       242       17            37               15
1975          854,853       272       18            39               13
1976          988,267       312       21            41               11
1977        1,079,430       325       22            46                6
1978        1,157,776       347       23            48                4
1979        1,251,921       358       24            47                5
1980        1,297,606       359       25            47                5
1981        1,300,760       358       24            46                6
1982        1,303,980       354       24            46                6
1983        1,268,987       349       23            46                6
1984        1,333,521       364       24            44                8
1985        1,328,570       354       24            44                8
1986        1,328,112       354       23            43                9
1987        1,353,671       356       24            45                7
1988        1,371,285       352       24            45                7
1989        1,396,658       346       24            45                7
1990        1,429,577       345       24            46                6
1991        1,388,937       339       24            47                5
1992        1,359,145       335       23            47                5
----------------------------------------------------------------------------
* Number of abortions per 1,000 live births.
+ Number of abortions per 1,000 women 15-44 years of age.
& Abortion data reported by central health agencies, which includes state health departments and the health
  departments of New York City and the District of Columbia.
@ Abortion data reported by hospitals and/or other medical facilities in state.
=============================================================================================================
Return to top. Table_3 Note: To print large tables and graphs users may have to change their printer settings to landscape and use a small font size.
TABLE 3. Reported number, * ratio, + and rate & of legal abortions and percent-
age of abortions obtained by out-of-state residents, @ by state of occurrence --
United States, 1992
=================================================================================================
                                                        Percentage of legal abortions
                        Total no. of                      obtained by out-of-state
State                 legal abortions    Ratio    Rate            residents
-------------------------------------------------------------------------------------
Alabama                    13,358         215      14                9.3
Alaska                      1,783 **      152      12                 --
Arizona                    14,353         209      17                2.8
Arkansas                    5,675         163      11                3.0
California                338,700 ++      564      47                 --
Colorado                   10,607         195      13                8.4
Connecticut                17,762         373 &&   24                 --
Delaware                    5,601         526      34                 --
Dist. of Columbia          17,698          -- @@   -- ***           53.2
Florida                    69,285         362      25                 --
Georgia                    38,052         343      23                8.5
Hawaii                      5,954         300      23                0.2
Idaho                       1,378          80       6                9.3
Illinois                   56,552         295 &&   21                 --
Indiana                    12,983         154      10                3.7
Iowa                        6,759 **      176      11                 --
Kansas                     10,385         274      19               46.8
Kentucky                    8,696         162 &&   10               25.5
Louisiana                  12,423         176      12                 --
Maine                       3,226         201      11                7.1
Maryland                   19,860         255 &&   17                7.1
Massachusetts              34,527         396 &&   24                3.9
Michigan                   34,496         242      16                3.9
Minnesota                  15,546         237      15               10.9
Mississippi                 7,555         177      12               23.3
Missouri                   13,390         176      11                9.1
Montana                     2,869         250      16               15.7
Nebraska                    5,637         242      16               19.2
Nevada                      8,022         357      26               10.3
New Hampshire               3,129 **      196      12                 --
New Jersey                 38,168         318 &&   21                2.5
New Mexico                  5,624         202      16                4.8
New York                  164,274         582      39                3.2
  City                    114,700 +++     909      --                2.8
  State                    49,574         318      --                4.1
North Carolina             35,253         339      22                9.0
North Dakota                1,493         169      11               31.9
Ohio                       36,019         222      14                9.5
Oklahoma                    9,881 **      208      14                 --
Oregon                     12,685         302      19               11.3
Pennsylvania               49,042         300      18                6.5
Rhode Island                6,667         460 &&   29               20.5
South Carolina             11,008         196      13                5.7
South Dakota                1,038          94       7               24.9
Tennessee                  18,029         245      15               16.1
Texas                      91,113         284      22                4.4
Utah                        3,941         106       9               12.9
Vermont                     2,778         359      20               29.9
Virginia                   29,641         306      19                6.0
Washington                 27,573         347      23                4.2
West Virginia               2,812         127       7               10.3
Wisconsin                  15,549         220      14                5.0
Wyoming                       296          44       3                9.8

Total                   1,359,145         335      23                8.0
-------------------------------------------------------------------------------------
  * Abortion data reported by central health agency unless otherwise specified.
  + Abortions per 1,000 live births (live-birth data reported by central health agencies unless
    otherwise specified).
  & Abortions per 1,000 women 15-44 years of age. The number of women in this age group
    was obtained from the U.S. Department of Commerce, Bureau of the Census (special
    unpublished tabulations).
  @ Based on number of abortions for which residence of women was known.
 ** Reported by hospitals and/or other medical facilities in state.
 ++ CDC estimate.
 && Number of live births obtained from CDC's National Center for Health Statistics, Advance
    Report of Final Natality Statistics, 1992, vol. 43, no. 5, supplement, October 25, 1994.
 @@ >1,000 abortions per 1,000 live births.
*** >100 abortions per 1,000 women ages 15-44 years.
+++ Reported by the New York City Department of Health.

-- Not reported.
=================================================================================================
Return to top. Table_4 Note: To print large tables and graphs users may have to change their printer settings to landscape and use a small font size.
TABLE 4. Reported legal abortions, by age of women who obtained an abortion and state in which the procedure was
performed -- selected states, * United States, 1992
======================================================================================================================================================================================
                                                                                    Age group (yrs)
                     ---------------------------------------------------------------------------------------------------------------------------------------------
                           <15 15-19 20-24 25-29 30-34 35-39>=40             Unknown            Total
                     ---------------   ---------------   ---------------   ---------------   ---------------   ---------------   ---------------   ---------------   ---------------
State                  No.       %       No.       %       No.       %       No.       %       No.       %       No.       %       No.       %       No.       %       No.       %
------------------------------------------------------------------------------------------------------------------------------------------------------------------------------------
Alabama                  192     1.4     3,125    23.4     4,738    35.5     2,651    19.8     1,541    11.5       870     6.5       240     1.8         1     0.0    13,358   100.0
Arizona                   94     0.7     2,598    18.1     4,800    33.4     3,151    22.0     1,896    13.2       995     6.9       253     1.8       566     3.9    14,353   100.0
Arkansas                  53     0.9     1,321    23.3     2,111    37.2     1,041    18.3       660    11.6       375     6.6        96     1.7        18     0.3     5,675   100.0
Colorado                  87     0.8     2,337    22.0     3,435    32.4     2,109    19.9     1,493    14.1       859     8.1       240     2.3        47     0.4    10,607   100.0
Dist. of Columbia         85     1.0     1,353    16.6     2,692    33.0     2,245    27.5     1,068    13.1       574     7.0       127     1.6         7     0.1     8,151 + 100.0

Georgia                  452     1.2     7,542    19.8    13,131    34.5     8,432    22.2     4,991    13.1     2,636     6.9       680     1.8       188     0.5    38,052   100.0
Hawaii                    60     1.0     1,200    20.2     1,925    32.3     1,318    22.1       847    14.2       453     7.6       148     2.5         3     0.1     5,954   100.0
Idaho                      6     0.4       345    25.0       410    29.8       279    20.2       178    12.9       126     9.1        34     2.5         0     0.0     1,378   100.0
Indiana                  118     0.9     2,679    20.6     4,802    37.0     2,669    20.6     1,628    12.5       844     6.5       208     1.6        35     0.3    12,983   100.0
Kansas                   106     1.0     2,591    24.9     3,569    34.4     1,953    18.8     1,241    11.9       702     6.8       180     1.7        43     0.4    10,385   100.0

Kentucky                 143     1.6     2,285    26.3     2,993    34.4     1,622    18.7       982    11.3       490     5.6       152     1.7        29     0.3     8,696   100.0
Louisiana                191     1.5     2,597    20.9     4,288    34.5     2,571    20.7     1,638    13.2       838     6.7       252     2.0        48     0.4    12,423   100.0
Maine                     19     0.6       619    19.2     1,054    32.7       697    21.6       471    14.6       246     7.6        82     2.5        38     1.2     3,226   100.0
Maryland                 191     1.0     3,796    19.1     6,792    34.2     4,793    24.1     2,775    14.0     1,187     6.0       326     1.6         0     0.0    19,860   100.0
Massachusetts            205     0.6     5,391    15.6    11,597    33.6     8,145    23.6     5,192    15.0     2,802     8.1       847     2.5       348     1.0    34,527   100.0

Michigan                 301     0.9     7,512    21.8    12,242    35.5     7,037    20.4     4,442    12.9     2,361     6.8       561     1.6        40     0.1    34,496   100.0
Minnesota                 89     0.6     2,769    17.8     5,369    34.5     3,441    22.1     2,214    14.2     1,139     7.3       524     3.4         1     0.0    15,546   100.0
Mississippi              108     1.4     1,731    22.9     2,840    37.6     1,431    18.9       853    11.3       466     6.2       119     1.6         7     0.1     7,555   100.0
Missouri                 130     1.0     2,546    19.0     4,632    34.6     2,879    21.5     1,918    14.3     1,049     7.8       233     1.7         3     0.0    13,390   100.0
Montana                   29     1.0       700    24.4       872    30.4       516    18.0       431    15.0       252     8.8        69     2.4         0     0.0     2,869   100.0

Nebraska                  41     0.7     1,236    21.9     2,079    36.9     1,113    19.7       665    11.8       364     6.5       137     2.4         2     0.0     5,637   100.0
Nevada                    61     0.8     1,298    16.2     2,538    31.6     1,830    22.8     1,285    16.0       712     8.9       159     2.0       139     1.7     8,022   100.0
New Jersey &             269     0.7     7,201    18.9    13,137    34.4     8,971    23.5     5,259    13.8     2,509     6.6       724     1.9        98     0.3    38,168   100.0
New Mexico                40     0.7     1,242    22.1     1,814    32.3     1,146    20.4       737    13.1       450     8.0       152     2.7        43     0.8     5,624   100.0

New York               1,251     0.8    28,417    17.3    52,083    31.7    39,586    24.1    25,026    15.2    12,496     7.6     3,673     2.2     1,742     1.1   164,274   100.0
  City                   940     0.8    18,405    16.0    34,899    30.4    29,099    25.4    18,607    16.2     9,077     7.9     2,669     2.3     1,004     0.9   114,700   100.0
  State                  311     0.6    10,012    20.2    17,184    34.7    10,487    21.2     6,419    12.9     3,419     6.9     1,004     2.0       738     1.5    49,574   100.0
North Carolina           370     1.0     7,776    22.1    12,742    36.1     7,066    20.0     4,099    11.6     2,101     6.0       541     1.5       558     1.6    35,253   100.0
North Dakota               6     0.4       368    24.6       545    36.5       258    17.3       182    12.2       102     6.8        32     2.1         0     0.0     1,493   100.0

Ohio                     195     0.5     5,607    15.6    12,316    34.2     7,035    19.5     4,261    11.8     2,433     6.8       777     2.2     3,395     9.4    36,019   100.0
Oregon                    79     0.6     2,637    20.8     4,375    34.5     2,570    20.3     1,635    12.9       926     7.3       270     2.1       193     1.5    12,685   100.0
Pennsylvania             484     1.0     9,858    20.1    17,521    35.7    10,356    21.1     6,375    13.0     3,477     7.1       970     2.0         1     0.0    49,042   100.0
Rhode Island              40     0.6     1,180    17.7     2,378    35.7     1,450    21.7       943    14.1       529     7.9       146     2.2         1     0.0     6,667   100.0
South Carolina           113     1.0     2,281    20.7     4,027    36.6     2,341    21.3     1,342    12.2       719     6.5       185     1.7         0     0.0    11,008   100.0

South Dakota               5     0.5       287    27.6       326    31.4       177    17.1       141    13.6        73     7.0        29     2.8         0     0.0     1,038   100.0
Tennessee                206     1.1     3,853    21.4     6,455    35.8     3,723    20.7     2,280    12.6     1,163     6.5       346     1.9         3     0.0    18,029   100.0
Texas                    437     0.5    15,614    17.1    32,417    35.6    20,448    22.4    13,025    14.3     6,817     7.5     2,108     2.3       247     0.3    91,113   100.0
Utah                      41     1.0       780    19.8     1,360    34.5       834    21.2       524    13.3       300     7.6        77     2.0        25     0.6     3,941   100.0
Vermont                   16     0.6       602    21.7       945    34.0       521    18.8       379    13.6       247     8.9        68     2.4         0     0.0     2,778   100.0

Virginia                 232     0.8     5,497    18.5    10,103    34.1     6,901    23.3     4,109    13.9     2,175     7.3       561     1.9        63     0.2    29,641   100.0
Washington               179     0.6     5,576    20.2     9,194    33.3     5,888    21.4     3,897    14.1     2,159     7.8       620     2.2        60     0.2    27,573   100.0
West Virginia             32     1.1       681    24.2     1,027    36.5       505    18.0       321    11.4       191     6.8        52     1.8         3     0.1     2,812   100.0
Wisconsin                114     0.8     3,141    21.3     5,231    35.4     3,156    21.4     1,905    12.9       973     6.6       252     1.7         1     0.0    14,773 + 100.0
Wyoming                    1     0.3        73    24.7        79    26.7        62    20.9        44    14.9        31    10.5         6     2.0         0     0.0       296   100.0

Total                  6,871     0.8   160,242    19.1   286,984    34.2   184,917    22.0   114,893    13.7    60,211     7.2    17,256     2.1     7,996     1.0   839,370   100.0

Abortion ratio @         790               440               376               222               183               256               454                                 290
Abortion rate **           3                26                42                25                14                 8                 2                                  17
------------------------------------------------------------------------------------------------------------------------------------------------------------------------------------
 * All 41 states for which data were available, the District of Columbia, and New York City.
 + Includes residents only.
 & Based on known distribution of 1991 data.
 @ Calculated as the number of legal abortions obtained by women in a given age group per 1,000 live births to women in the same age group for these
   states. For each state, abortions obtained by women of unknown age are distributed according to the known age distribution for that state. Excludes
   states reporting age unknown for >15% of women who obtained an abortion.
** Calculated as the number of legal abortions obtained by women in a given age group per 1,000 women in the same age group for these states. For
   each state, abortions obtained by women of unknown age are distributed according to the known age distribution for that state. Excludes states reporting
   age unknown for >15% of women who obtained an abortion.
======================================================================================================================================================================================
Return to top. Table_5 Note: To print large tables and graphs users may have to change their printer settings to landscape and use a small font size.
TABLE 5. Reported legal abortions obtained by teenagers, by age and state of occurrence -- selected states, * United States,
1992
==================================================================================================================================================
                                                                    Age (yrs)
                    ---------------------------------------------------------------------------------------------------------
                          <15               15                16                17                18                19               Total
                    ---------------   ---------------   ---------------   ---------------   ---------------   ---------------   ---------------
State                 No.       %       No.       %       No.       %       No.       %       No.       %       No.       %      No.        %
-----------------------------------------------------------------------------------------------------------------------------------------------
Alabama                 192     5.8       261     7.9       446    13.4       581    17.5       840    25.3       997    30.1     3,317   100.0
Arizona                  94     3.5       174     6.5       305    11.3       474    17.6       734    27.3       911    33.8     2,692   100.0
Arkansas                 53     3.9        94     6.8       176    12.8       204    14.8       422    30.7       425    30.9     1,374   100.0
Colorado                 87     3.6       140     5.8       353    14.6       520    21.5       644    26.6       680    28.1     2,424   100.0
Georgia                 452     5.7       607     7.6     1,004    12.6     1,278    16.0     2,160    27.0     2,493    31.2     7,994   100.0

Hawaii                   60     4.8       106     8.4       168    13.3       247    19.6       299    23.7       380    30.2     1,260   100.0
Idaho                     6     1.7        24     6.8        43    12.3        44    12.5       126    35.9       108    30.8       351   100.0
Indiana                 118     4.2       195     7.0       330    11.8       383    13.7       881    31.5       890    31.8     2,797   100.0
Kansas                  106     3.9       248     9.2       408    15.1       527    19.5       657    24.4       751    27.8     2,697   100.0
Kentucky                143     5.9       183     7.5       355    14.6       525    21.6       570    23.5       652    26.9     2,428   100.0

Louisiana               191     6.9       232     8.3       323    11.6       378    13.6       822    29.5       842    30.2     2,788   100.0
Maine                    19     3.0        34     5.3        75    11.8       146    22.9       173    27.1       191    29.9       638   100.0
Maryland                191     4.8       324     8.1       548    13.7       715    17.9     1,007    25.3     1,202    30.1     3,987   100.0
Massachusetts           205     3.7       311     5.6       585    10.5       850    15.2     1,604    28.7     2,041    36.5     5,596   100.0
Michigan                301     3.9       515     6.6       933    11.9     1,332    17.0     2,209    28.3     2,523    32.3     7,813   100.0

Minnesota                89     3.1       178     6.2       353    12.4       449    15.7       838    29.3       951    33.3     2,858   100.0
Mississippi             108     5.9       180     9.8       252    13.7       310    16.9       477    25.9       512    27.8     1,839   100.0
Missouri                130     4.9       228     8.5       286    10.7       398    14.9       729    27.2       905    33.8     2,676   100.0
Montana                  29     4.0        54     7.4       118    16.2       142    19.5       201    27.6       185    25.4       729   100.0
Nebraska                 41     3.2        76     6.0       151    11.8       191    15.0       391    30.6       427    33.4     1,277   100.0

Nevada                   61     4.5        81     6.0       191    14.1       239    17.6       381    28.0       406    29.9     1,359   100.0
New Jersey +            269     3.6       489     6.5       865    11.6     1,404    18.8     2,009    26.9     2,434    32.6     7,470   100.0
New Mexico               40     3.1        86     6.7       193    15.1       258    20.1       352    27.5       353    27.5     1,282   100.0
New York              1,251     4.2     2,173     7.3     3,916    13.2     5,737    19.3     7,650    25.8     8,941    30.1    29,668   100.0
  City                  940     4.9     1,508     7.8     2,620    13.5     3,734    19.3     4,820    24.9     5,723    29.6    19,345   100.0
  State                 311     3.0       665     6.4     1,296    12.6     2,003    19.4     2,830    27.4     3,218    31.2    10,323   100.0

North Carolina          370     4.5       578     7.1     1,032    12.7     1,549    19.0     2,144    26.3     2,473    30.4     8,146   100.0
North Dakota              6     1.6        20     5.3        43    11.5        57    15.2       123    32.9       125    33.4       374   100.0
Ohio                    195     3.4       336     5.8       602    10.4       941    16.2     1,517    26.1     2,211    38.1     5,802   100.0
Oregon                   79     2.9       182     6.7       352    13.0       543    20.0       747    27.5       813    29.9     2,716   100.0
Pennsylvania            484     4.7       724     7.0     1,312    12.7     1,865    18.0     2,850    27.6     3,107    30.0    10,342   100.0

Rhode Island             40     3.3        79     6.5       101     8.3       155    12.7       401    32.9       444    36.4     1,220   100.0
South Carolina          113     4.7       210     8.8       243    10.2       447    18.7       661    27.6       720    30.1     2,394   100.0
South Dakota              5     1.7        29     9.9        54    18.5        62    21.2        79    27.1        63    21.6       292   100.0
Tennessee               206     5.1       292     7.2       467    11.5       661    16.3     1,165    28.7     1,268    31.2     4,059   100.0
Texas                   437     2.7       860     5.4     1,764    11.0     2,871    17.9     4,382    27.3     5,737    35.7    16,051   100.0

Utah                     41     5.0        55     6.7        92    11.2       133    16.2       234    28.5       266    32.4       821   100.0
Vermont                  16     2.6        39     6.3        76    12.3       114    18.4       159    25.7       214    34.6       618   100.0
Virginia                232     4.0       381     6.7       716    12.5     1,015    17.7     1,584    27.6     1,801    31.4     5,729   100.0
Washington              179     3.1       422     7.3       743    12.9     1,148    19.9     1,551    27.0     1,712    29.7     5,755   100.0
West Virginia            32     4.5        50     7.0        92    12.9       118    16.5       209    29.3       212    29.7       713   100.0
Wisconsin               114     3.5       220     6.8       387    11.9       553    17.0       889    27.3     1,092    33.5     3,255 & 100.0
Wyoming                   1     1.4         6     8.1         7     9.5        11    14.9        21    28.4        28    37.8        74   100.0

Total                 6,786     4.1    11,476     6.9    20,460    12.3    29,575    17.9    44,892    27.1    52,486    31.7   165,675   100.0

Abortion ratio @        787               553               477               420               450               409               447
Abortion rate **          3                 9                17                24                37                44                13
-----------------------------------------------------------------------------------------------------------------------------------------------
 * All 41 states for which data were available and New York City.
 + Based on known distribution of 1991 data.
 & Includes residents only.
 @ Calculated as the number of legal abortions obtained by women of a given age per 1,000 live births to women of the same age for these states.
** Calculated as the number of legal abortions obtained by women of a given age per 1,000 women of the same age for these states.
==================================================================================================================================================
Return to top. Table_6A Note: To print large tables and graphs users may have to change their printer settings to landscape and use a small font size.
TABLE 6A. Reported legal abortions, by weeks of gestation * and state of occurrence -- selected states, + United States,
1992
======================================================================================================================================================================
                                                                          Weeks of gestation
                      --------------------------------------------------------------------------------------------------------------------------
                           <=8               9-10             11-12             13-15             16-20              >=21            Unknown             Total
                      --------------    --------------    --------------    --------------    --------------    --------------    --------------    ----------------
State                   No.      %        No.      %        No.      %        No.      %        No.      %        No.      %        No.      %         No.       %
--------------------------------------------------------------------------------------------------------------------------------------------------------------------
Alabama &               6,845   51.2      3,702   27.7      1,425   10.7        750    5.6        360    2.7        189    1.4         87    0.7      13,358   100.0
Arkansas                3,045   53.7      1,321   23.3        499    8.8        239    4.2        131    2.3          5    0.1        435    7.7       5,675   100.0
Colorado                3,803   35.9      3,743   35.3      1,642   15.5        771    7.3        497    4.7        129    1.2         22    0.2      10,607   100.0
Dist. of Columbia       4,329   53.1      1,646   20.2      1,333   16.4        562    6.9        226 @  2.8         19 ** 0.2         36    0.4       8,151++ 100.0
Georgia                13,547   35.6     10,386   27.3      6,522   17.1      3,049    8.0      1,696    4.5        787    2.1      2,065    5.4      38,052   100.0

Hawaii &                2,936   49.3      1,540   25.9        656   11.0        366    6.1        336    5.6         59    1.0         61    1.0       5,954   100.0
Idaho                     750   54.4        413   30.0        178   12.9         25    1.8          8    0.6          2    0.1          2    0.1       1,378   100.0
Indiana                 9,490   73.1      2,409   18.6        666    5.1        169    1.3        101    0.8          1    0.0        147    1.1      12,983   100.0
Kansas                  4,677   45.0      2,019   19.4      1,005    9.7        631    6.1        712    6.9        934    9.0        407    3.9      10,385   100.0
Kentucky                3,982   45.8      1,900   21.8      1,118   12.9        654    7.5        629    7.2        240    2.8        173    2.0       8,696   100.0

Louisiana               5,394   43.4      3,696   29.8      1,484   11.9        849    6.8        687    5.5        205    1.7        108    0.9      12,423   100.0
Maine                   1,469   45.5      1,048   32.5        480   14.9        128    4.0         35    1.1          8    0.2         58    1.8       3,226   100.0
Maryland &             11,111   55.9      4,848   24.4      2,153   10.8      1,079    5.4        591    3.0          5    0.0         73    0.4      19,860   100.0
Michigan               19,937   57.8      7,208   20.9      3,524   10.2      2,441    7.1      1,251    3.6        123    0.4         12    0.0      34,496   100.0
Minnesota               8,729   56.1      3,243   20.9      1,757   11.3        831    5.3        716    4.6        270    1.7          0    0.0      15,546   100.0

Mississippi             3,965   52.5      1,722   22.8        836   11.1        582    7.7        267    3.5         54    0.7        129    1.7       7,555   100.0
Missouri                4,718   35.2      4,397   32.8      2,651   19.8      1,051    7.8        496    3.7         76    0.6          1    0.0      13,390   100.0
Montana &               1,700   59.3        587   20.5        282    9.8        152    5.3        120    4.2         21    0.7          7    0.2       2,869   100.0
Nevada                  4,784   59.6      1,648   20.5        959   12.0        326    4.1        222    2.8          6    0.1         77    1.0       8,022   100.0
New Jersey &&          15,724   41.2      6,562   17.2      7,378   19.3      3,073    8.1      2,711    7.1      2,267    5.9        453    1.2      38,168   100.0

New Mexico              2,841   50.5      1,004   17.9        570   10.1        344    6.1        332    5.9         37    0.7        496    8.8       5,624   100.0
New York               88,072   53.6     34,968   21.3     16,440   10.0      8,662    5.3      8,742    5.3      3,306    2.0      4,084    2.5     164,274   100.0
  City                 62,004   54.1     22,937   20.0     11,017    9.6      5,837    5.1      7,608    6.6      3,122    2.7      2,175    1.9     114,700   100.0
  State                26,068   52.6     12,031   24.3      5,423   10.9      2,825    5.7      1,134    2.3        184    0.4      1,909    3.9      49,574   100.0
North Carolina         17,459   49.5      8,413   23.9      4,539   12.9      2,549    7.2        776    2.2         61    0.2      1,456    4.1      35,253   100.0

North Dakota &            827   55.4        347   23.2        160   10.7        138    9.2         20    1.3          0    0.0          1    0.1       1,493   100.0
Oregon                  6,706   52.9      3,433   27.1      1,273   10.0        483    3.8        368    2.9        165    1.3        257    2.0      12,685   100.0
Pennsylvania           24,547   50.1     13,175   26.9      5,801   11.8      3,148    6.4      2,011    4.1        349    0.7         11    0.0      49,042   100.0
Rhode Island            3,331   50.0      2,063   30.9        702   10.5        341    5.1        219    3.3          8    0.1          3    0.0       6,667   100.0
South Carolina          5,970   54.2      3,085   28.0      1,549   14.1        167    1.5         64    0.6         24    0.2        149    1.4      11,008   100.0

South Dakota              645   62.1        263   25.3        126   12.1          2    0.2          0    0.0          0    0.0          2    0.2       1,038   100.0
Tennessee &             9,201   51.0      4,858   26.9      2,540   14.1      1,221    6.8        157    0.9         22    0.1         30    0.2      18,029   100.0
Texas                  49,009   53.8     20,591   22.6     10,102   11.1      6,077    6.7      4,177    4.6        955    1.0        202    0.2      91,113   100.0
Utah                    2,672   67.8        665   16.9        286    7.3        162    4.1        135    3.4          5    0.1         16    0.4       3,941   100.0
Vermont                 1,645   59.2        771   27.8        252    9.1         90    3.2         15    0.5          5    0.2          0    0.0       2,778   100.0

Virginia               16,513   55.7      8,617   29.1      3,133   10.6        724    2.4        446    1.5        120    0.4         88    0.3      29,641   100.0
Washington &           15,356   55.7      6,700   24.3      2,434    8.8      1,428    5.2      1,201    4.4        352    1.3        102    0.4      27,573   100.0
West Virginia             963   34.2      1,073   38.2        502   17.9        178    6.3         37    1.3          1    0.0         58    2.1       2,812   100.0
Wisconsin               7,049   47.7      4,177   28.3      1,825   12.4      1,025    6.9        582    3.9        115    0.8          0    0.0      14,773++ 100.0
Wyoming &                 146   49.3        122   41.2         27    9.1          0    0.0          0    0.0          0    0.0          1    0.3         296   100.0

Total                 383,887   51.3    178,363   23.8     88,809   11.9     44,467    5.9     31,074    4.1     10,925    1.5     11,309    1.5     748,834   100.0
--------------------------------------------------------------------------------------------------------------------------------------------------------------------
 * Reported legal abortions obtained at <=8 weeks of gestation are presented in Table 6B by single weeks of gestation.
 + All 37 states for which data were available, the District of Columbia, and New York City; excludes two states where unknown gestational age is >15%.
 & Weeks of gestation are based on physicians' estimates.
 @ Includes 16-19 weeks only.
** Includes gestation of >=20 weeks.
++ Includes residents only.
&& Based on known distribution of 1991 data.
======================================================================================================================================================================
Return to top. Table_6B Note: To print large tables and graphs users may have to change their printer settings to landscape and use a small font size.
TABLE 6B. Reported legal abortions obtained at <=8 weeks of gestation, by weeks of gestation, and total number of abortions
-- selected states, * United States, 1992
====================================================================================================================================================================
                                Weeks of gestation                        Total abortions obtained
                 -------------------------------------------------   -----------------------------------
                      <=6                7                 8         <=8 wks of gestation   No. obtained
                 --------------   ---------------   --------------   --------------------  at all wks of
State              No.      %       No.       %       No.      %         No.       %         gestation
--------------------------------------------------------------------------------------------------------
Alabama +          2,279   17.1     1,854    13.9     2,712   20.3       6,845    51.2         13,358
Arkansas             875   15.4     1,168    20.6     1,002   17.7       3,045    53.7          5,675
Colorado             819    7.7       812     7.7     2,172   20.5       3,803    35.9         10,607
Georgia            2,636    6.9     4,603    12.1     6,308   16.6      13,547    35.6         38,052
Hawaii +             551    9.3     1,038    17.4     1,347   22.6       2,936    49.3          5,954
Idaho                235   17.1       193    14.0       322   23.4         750    54.4          1,378
Indiana            3,472   26.7     3,161    24.3     2,857   22.0       9,490    73.1         12,983
Kansas               826    8.0     2,035    19.6     1,816   17.5       4,677    45.0         10,385
Kentucky           1,045   12.0     1,159    13.3     1,778   20.4       3,982    45.8          8,696
Louisiana          1,002    8.1     1,767    14.2     2,625   21.1       5,394    43.4         12,423
Maine                287    8.9       460    14.3       722   22.4       1,469    45.5          3,226
Maryland +         4,276   21.5     2,096    10.6     4,739   23.9      11,111    55.9         19,860
Michigan           7,177   20.8     6,037    17.5     6,723   19.5      19,937    57.8         34,496
Minnesota          1,815   11.7     2,614    16.8     4,300   27.7       8,729    56.1         15,546
Mississippi        1,521   20.1     1,304    17.3     1,140   15.1       3,965    52.5          7,555
Missouri             578    4.3     1,342    10.0     2,798   20.9       4,718    35.2         13,390
Montana +            632   22.0       598    20.8       470   16.4       1,700    59.3          2,869
Nevada               639    8.0     2,080    25.9     2,065   25.7       4,784    59.6          8,022
New Jersey &       3,457    9.1     3,053     8.0     9,214   24.1      15,724    41.2         38,168
New York          24,919   15.2    28,494    17.3    34,659   21.1      88,072    53.6        164,274
  City            18,137   15.8    18,508    16.1    25,359   22.1      62,004    54.1        114,700
  State            6,782   13.7     9,986    20.1     9,300   18.8      26,068    52.6         49,574
North Carolina     5,703   16.2     5,984    17.0     5,772   16.4      17,459    49.5         35,253
North Dakota +        89    6.0       349    23.4       389   26.1         827    55.4          1,493
Oregon             1,331   10.5     2,172    17.1     3,203   25.3       6,706    52.9         12,685
Pennsylvania       6,039   12.3     6,302    12.9    12,206   24.9      24,547    50.1         49,042
Rhode Island         537    8.1     1,215    18.2     1,579   23.7       3,331    50.0          6,667
South Carolina     1,968   17.9     1,882    17.1     2,120   19.3       5,970    54.2         11,008
South Dakota          44    4.2       250    24.1       351   33.8         645    62.1          1,038
Tennessee +        2,479   13.8     2,960    16.4     3,762   20.9       9,201    51.0         18,029
Texas             14,282   15.7    14,755    16.2    19,972   21.9      49,009    53.8         91,113
Utah               1,382   35.1       784    19.9       506   12.8       2,672    67.8          3,941
Vermont              350   12.6       702    25.3       593   21.3       1,645    59.2          2,778
Virginia           3,858   13.0     2,980    10.1     9,675   32.6      16,513    55.7         29,641
Washington +       4,136   15.0     4,607    16.7     6,613   24.0      15,356    55.7         27,573
West Virginia         38    1.4        65     2.3       860   30.6         963    34.2          2,812
Wyoming +             17    5.7        30    10.1        99   33.4         146    49.3            296

Total            101,294   14.1   110,905    15.4   157,469   21.9     369,668    51.3        720,286
--------------------------------------------------------------------------------------------------------
* All 35 states for which data were available and New York City. Excludes the District of Columbia, New Mexico, and Wisconsin, which were included in Table 6A but
  did not provide single weeks of gestation for abortions obtained at <=8 weeks.
+ Weeks of gestation are based on physicians' estimates.
& Based on known distribution of 1991 data.
====================================================================================================================================================================
Return to top. Table_7 Note: To print large tables and graphs users may have to change their printer settings to landscape and use a small font size.
TABLE 7. Reported legal abortions, by type of procedure and state in which the procedure was performed -- selected states, *
United States, 1992
======================================================================================================================================================================================
                                                                                       Procedure
                      --------------------------------------------------------------------------------------------------------------------------------------------
                                                                             Intrauterine
                         Suction            Sharp                               saline        Prostaglandin      Hysterotomy/
                        curettage         curettage       All curettage      instillation      instillation      Hysterectomy        Other +           Unknown            Total
                      --------------    --------------    --------------    --------------    --------------    --------------    --------------    --------------    --------------
State                   No.      %        No.      %        No.      %        No.      %        No.      %        No.      %        No.      %        No.      %        No.      %
------------------------------------------------------------------------------------------------------------------------------------------------------------------------------------
Alabama                13,161&  98.5          7    0.1     13,168   98.6          1    0.0         12    0.1          1    0.0         25    0.2        151    1.1     13,358  100.0
Arizona                14,207   99.0          5    0.0     14,212   99.0          0    0.0          0    0.0          0    0.0          0    0.0        141    1.0     14,353  100.0
Arkansas                5,313&  93.6        318    5.6      5,631   99.2         13    0.2          0    0.0          1    0.0         30    0.5          0    0.0      5,675  100.0
Colorado               10,251&  96.6         19    0.2     10,270   96.8         13    0.1         33    0.3          2    0.0        288    2.7          1    0.0     10,607  100.0
Dist. of Columbia       8,120   99.6          0    0.0      8,120   99.6         18    0.2          0    0.0          0    0.0         12    0.1          1    0.0      8,151@ 100.0

Georgia                33,455&  87.9      4,081   10.7     37,536   98.6          6    0.0        486    1.3          3    0.0          0    0.0         21    0.1     38,052  100.0
Hawaii                  5,897   99.0          2    0.0      5,899   99.1          0    0.0         16    0.3          0    0.0         27    0.5         12    0.2      5,954  100.0
Idaho                   1,367   99.2          4    0.3      1,371   99.5          2    0.1          2    0.1          2    0.1          1    0.1          0    0.0      1,378  100.0
Indiana                12,803   98.6         12    0.1     12,815   98.7          0    0.0          0    0.0          0    0.0        140    1.1         28    0.2     12,983  100.0
Kansas                  9,670&  93.1          0    0.0      9,670   93.1          0    0.0          2    0.0          0    0.0          1    0.0        712    6.9     10,385  100.0

Kentucky                7,820&  89.9        771    8.9      8,591   98.8          3    0.0          3    0.0          1    0.0          6    0.1         92    1.1      8,696  100.0
Maine                   3,162&  98.1          8    0.2      3,170   98.3          0    0.0          1    0.0          2    0.1         32    1.0         21    0.7      3,226  100.0
Maryland               19,435   97.9         39    0.2     19,474   98.1         78    0.4        150    0.8          1    0.0        156    0.8          1    0.0     19,860  100.0
Massachusetts          33,119   95.9        179    0.5     33,298   96.4        321    0.9        767    2.2          0    0.0          0    0.0        141    0.4     34,527  100.0
Michigan               34,416&  99.8          0    0.0     34,416   99.8          0    0.0         78    0.2          0    0.0          2    0.0          0    0.0     34,496  100.0

Minnesota              15,305&  98.4          6    0.0     15,311   98.5          1    0.0          2    0.0          1    0.0          7    0.0        224    1.4     15,546  100.0
Mississippi             7,217&  95.5        281    3.7      7,498   99.2          1    0.0         41    0.5          1    0.0          9    0.1          5    0.1      7,555  100.0
Missouri               13,336&  99.6         15    0.1     13,351   99.7          0    0.0         13    0.1          0    0.0         20    0.1          6    0.0     13,390  100.0
Montana                 2,860&  99.7          8    0.3      2,868  100.0          0    0.0          0    0.0          0    0.0          1    0.0          0    0.0      2,869  100.0
Nebraska                5,625   99.7          5    0.1      5,630   99.8          0    0.0          3    0.1          1    0.0          3    0.1          6    0.1      5,643**100.0

Nevada                  7,524   93.8          3    0.0      7,527   93.8        167    2.1          0    0.0          0    0.0          1    0.0        327    4.1      8,022  100.0
New Jersey ++          29,922   78.4      7,542   19.8     37,464   98.2        303    0.8         44    0.1          9    0.0          6    0.0        342    0.9     38,168  100.0
New Mexico              5,269   93.7         11    0.2      5,280   93.9        340    6.0          0    0.0          0    0.0          0    0.0          4    0.1      5,624  100.0
New York              154,907   94.3        880    0.5    155,787   94.8        947    0.6        348    0.2          4    0.0        979    0.6      6,209    3.8    164,274  100.0
  City                111,331&  97.1        732    0.6    112,063   97.7        917    0.8        242    0.2          3    0.0        767    0.7        708    0.6    114,700  100.0
  State                43,576&  87.9        148    0.3     43,724   88.2         30    0.1        106    0.2          1    0.0        212    0.4      5,501   11.1     49,574  100.0

North Carolina +       33,894   96.1         74    0.2     33,968   96.4        109    0.3        176    0.5          1    0.0        121    0.3        878    2.5     35,253  100.0
North Dakota            1,493  100.0          0    0.0      1,493  100.0          0    0.0          0    0.0          0    0.0          0    0.0          0    0.0      1,493  100.0
Oregon                 12,466&  98.3          1    0.0     12,467   98.3          0    0.0         24    0.2          1    0.0          3    0.0        190    1.5     12,685  100.0
Pennsylvania           48,727&  99.4         18    0.0     48,745   99.4        146    0.3         34    0.1          0    0.0        117    0.2          0    0.0     49,042  100.0
Rhode Island            6,609&  99.1         38    0.6      6,647   99.7          1    0.0          5    0.1          0    0.0         13    0.2          1    0.0      6,667  100.0

South Carolina         10,951&  99.5          3    0.0     10,954   99.5          7    0.1         37    0.3          0    0.0          9    0.1          1    0.0     11,008  100.0
South Dakota            1,038  100.0          0    0.0      1,038  100.0          0    0.0          0    0.0          0    0.0          0    0.0          0    0.0      1,038  100.0
Tennessee              17,986&  99.8          4    0.0     17,990   99.8          7    0.0         32    0.2          0    0.0          0    0.0          0    0.0     18,029  100.0
Texas                  89,399&& 98.1         --    0.0     89,399   98.1         --    0.0     544 @@    0.6         10    0.0        843    0.9        317    0.3     91,113  100.0
Utah                    3,921&  99.5          6    0.2      3,927   99.6          0    0.0          1    0.0          0    0.0          7    0.2          6    0.2      3,941  100.0

Vermont                 2,757&  99.2          1    0.0      2,758   99.3          0    0.0          3    0.1          0    0.0         16    0.6          1    0.0      2,778  100.0
Virginia               29,367&  99.1         26    0.1     29,393   99.2         17    0.1         81    0.3          4    0.0         58    0.2         88    0.3     29,641  100.0
Washington             27,449&  99.6          6    0.0     27,455   99.6         12    0.0         45    0.2          0    0.0          9    0.0         52    0.2     27,573  100.0
West Virginia           2,812& 100.0          0    0.0      2,812  100.0          0    0.0          0    0.0          0    0.0          0    0.0          0    0.0      2,812  100.0
Wyoming                   296  100.0          0    0.0        296  100.0          0    0.0          0    0.0          0    0.0          0    0.0          0    0.0        296  100.0

Total                 743,326   95.8     14,373    1.9    757,699   97.6      2,513    0.3      2,983    0.4         45    0.0      2,942    0.4      9,979    1.3    776,161  100.0
------------------------------------------------------------------------------------------------------------------------------------------------------------------------------------
 * All 38 states for which data were available, the District of Columbia, and New York City.
 + Includes instillation procedures not reported as a specific category and procedures reported as "other."
 & Includes dilatation and evacuation procedures.
 @ Includes residents only.
** Does not add to total abortions reported because of some reported combination procedures.
++ Based on known distribution of 1991 data.
&& Includes dilatation and evacuation procedures and all vacuum aspirations.
@@ Includes all chemical inductions.
-- Not reported.
======================================================================================================================================================================================
Return to top. Table_8 Note: To print large tables and graphs users may have to change their printer settings to landscape and use a small font size.
TABLE 8. Reported legal abortions, by race of women who obtained an abortion and
state in which the procedure was performed -- selected states, * United States, 1992
===============================================================================================================
                                                      Race
                      --------------------------------------------------------------------
                         White +            Black             Other            Unknown             Total
                      --------------    --------------    --------------    --------------    ---------------
State                   No.      %        No.      %        No.      %        No.      %        No.       %
-------------------------------------------------------------------------------------------------------------
Alabama                 7,339   54.9      5,567   41.7        224    1.7        228    1.7     13,358   100.0
Arizona                11,673   81.3        786    5.5        809    5.6      1,085    7.6     14,353   100.0
Arkansas                3,944   69.5      1,606   28.3         73    1.3         52    0.9      5,675   100.0
Dist. of Columbia       1,252   15.4      6,735   82.6        130    1.6         34    0.4      8,151 & 100.0
Georgia                18,069   47.5     18,334   48.2        690    1.8        959    2.5     38,052   100.0
Hawaii                  1,823   30.6        176    3.0      3,249   54.6        706   11.9      5,954   100.0
Idaho                   1,314   95.4         11    0.8         50    3.6          3    0.2      1,378   100.0
Indiana                 9,612   74.0      2,868   22.1        203    1.6        300    2.3     12,983   100.0
Kansas                  8,125   78.2      1,766   17.0        294    2.8        200    1.9     10,385   100.0
Kentucky                6,800   78.2      1,622   18.7        209    2.4         65    0.7      8,696   100.0
Louisiana               6,299   50.7      5,890 @ 47.4         --    --         234    1.9     12,423   100.0
Maine                   3,064   95.0         25    0.8         75    2.3         62    1.9      3,226   100.0
Maryland                8,696   43.8      9,830   49.5      1,146    5.8        188    0.9     19,860   100.0
Minnesota              13,146   84.6      1,237    8.0      1,046    6.7        117    0.8     15,546   100.0
Mississippi             3,425   45.3      4,072   53.9         55    0.7          3    0.0      7,555   100.0
Missouri                8,367   62.5      4,662   34.8        308    2.3         53    0.4     13,390   100.0
Montana                 2,383   83.1         12    0.4        184    6.4        290   10.1      2,869   100.0
Nevada                  6,798   84.7        698    8.7        352    4.4        174    2.2      8,022   100.0
New Jersey **          14,070   36.9     16,437   43.1      7,543   19.8        118    0.3     38,168   100.0
New Mexico              4,838   86.0        134    2.4        652   11.6          0    0.0      5,624   100.0
New York               82,654   50.3     69,483   42.3      4,373    2.7      7,764    4.7    164,274   100.0
  City                 48,389   42.2     59,088   51.5      3,851    3.4      3,372    2.9    114,700   100.0
  State                34,265   69.1     10,395   21.0        522    1.1      4,392    8.9     49,574   100.0
North Carolina         19,634   55.7     13,780   39.1      1,228    3.5        611    1.7     35,253   100.0
North Dakota            1,345   90.1         17    1.1        129    8.6          2    0.1      1,493   100.0
Oregon                 11,201   88.3        581    4.6        596    4.7        307    2.4     12,685   100.0
Pennsylvania           30,652   62.5     17,066   34.8      1,292    2.6         32    0.1     49,042   100.0
Rhode Island            5,389   80.8        910   13.6        314    4.7         54    0.8      6,667   100.0
South Carolina          5,907   53.7      4,933   44.8        167    1.5          1    0.0     11,008   100.0
South Dakota              949   91.4          0    0.0         89    8.6          0    0.0      1,038   100.0
Tennessee              11,246   62.4      6,497   36.0        255    1.4         31    0.2     18,029   100.0
Texas                  67,401   74.0     18,228   20.0      3,473    3.8      2,011    2.2     91,113   100.0
Utah                    3,342   84.8         82    2.1        401   10.2        116    2.9      3,941   100.0
Vermont                 2,711   97.6         20    0.7         47    1.7          0    0.0      2,778   100.0
Virginia               17,864   60.3     10,737   36.2        893    3.0        147    0.5     29,641   100.0
West Virginia           2,417   86.0        367   13.1         25    0.9          3    0.1      2,812   100.0
Wisconsin              11,022   74.6      3,111   21.1        507    3.4        133 ++ 0.9     14,773 & 100.0

Total                 414,771   60.1    228,280   33.1     31,081    4.5     16,083    2.3    690,215   100.0

Abortion ratio &&         236               518               352 @@                              295
Abortion rate ***          15                41                22                                  20
-------------------------------------------------------------------------------------------------------------
  * All 34 states for which data were available, the District of Columbia, and New York City; excludes three
    states reporting race unknown for >15% of women who obtained abortions.
  + White race includes women of Hispanic ethnicity.
  & Includes residents only.
  @ Reported as black and "other" races.
 ** Based on known distribution of 1991 data.
 ++ Includes women of "other" race.
 && Calculated as the number of legal abortions obtained by women of a given race per 1,000 live births to
    women of the same race for these states. For each state, data for women of unknown race were
    distributed according to the known racial distribution for that state.
 @@ Ratio for "other" race excludes Louisiana because abortions for blacks and others were grouped together.
*** Calculated as the number of legal abortions obtained by women of a given race per 1,000 women 15-44
    years of age of the same race for these states. For each state, data for women of unknown race were
    distributed according to the known racial distribution for that state.

-- Not reported.
===============================================================================================================
Return to top. Table_9 Note: To print large tables and graphs users may have to change their printer settings to landscape and use a small font size.
TABLE 9. Reported legal abortions, by Hispanic ethnicity of women who obtained an
abortion and state in which the procedure was performed -- selected states, *
United States, 1992
==============================================================================================================
                                            Ethnicity
                       ---------------------------------------------------
                          Hispanic        Non-Hispanic         Unknown            Total
                       ---------------   ---------------   ---------------   ---------------
State                    No.       %       No.       %       No.       %       No.       %
--------------------------------------------------------------------------------------------
Arizona                  3,001    20.9    10,267    71.5     1,085     7.6    14,353   100.0
Arkansas                    17     0.3     5,070    89.3       588    10.4     5,675   100.0
Dist. of Columbia          563     6.9     7,554    92.7        34     0.4     8,151 + 100.0
Georgia                    458     1.2    36,313    95.4     1,281     3.4    38,052   100.0
Idaho                       88     6.4     1,285    93.3         5     0.4     1,378   100.0
Kansas                     399     3.8     9,842    94.8       144     1.4    10,385   100.0
Minnesota                  188     1.2    15,241    98.0       117     0.8    15,546   100.0
Mississippi                 15     0.2     7,530    99.7        10     0.1     7,555   100.0
New Jersey &             5,933    15.5    32,117    84.1       118     0.3    38,168   100.0
New Mexico               2,211    39.3     3,413    60.7         0     0.0     5,624   100.0
New York                32,634    19.9   110,524    67.3    21,116    12.9   164,274   100.0
  City                  30,683    26.8    69,663    60.7    14,354    12.5   114,700   100.0
  State                  1,951     3.9    40,861    82.4     6,762    13.6    49,574   100.0
North Dakota                17     1.1     1,405    94.1        71     4.8     1,493   100.0
Oregon                     578     4.6    11,395    89.8       712     5.6    12,685   100.0
Pennsylvania             1,232     2.5    47,791    97.4        19     0.0    49,042   100.0
Rhode Island               130     1.9     5,620    84.3       917    13.8     6,667   100.0
South Carolina             120     1.1    10,885    98.9         3     0.0    11,008   100.0
Tennessee                   97     0.5    17,909    99.3        23     0.1    18,029   100.0
Texas                   26,364    28.9    62,738    68.9     2,011     2.2    91,113   100.0
Utah                       309     7.8     3,622    91.9        10     0.3     3,941   100.0
Vermont                     11     0.4     2,764    99.5         3     0.1     2,778   100.0
Wisconsin                  494     3.3    14,279    96.7         0     0.0    14,773 + 100.0

Total                   74,859    14.4   417,564    80.2    28,267     5.4   520,690   100.0

Abortion ratio @           307               326                                 323
Abortion rate **            32                21                                  22
--------------------------------------------------------------------------------------------
 * All 20 states for which data were available, the District of Columbia, and New York City; excludes nine
   states where unknown ethnicity was >15%.
 + Includes residents only.
 & Based on known distribution of 1991 data.
 @ Calculated as the number of legal abortions obtained by women of Hispanic origin per 1,000 live births
   to women of Hispanic origin for these states. For each state, data for women of unknown Hispanic origin
   were distributed according to the known distribution of Hispanics for that state.
** Calculated as the number of legal abortions obtained by women of Hispanic origin per 1,000 women
   15-44 years of age to women of Hispanic origin for these states. For each state, data for women of
   unknown Hispanic origin were distributed according to the known distribution of Hispanics for that state.
==============================================================================================================
Return to top. Table_10 Note: To print large tables and graphs users may have to change their printer settings to landscape and use a small font size.
TABLE 10. Reported legal abortions, by marital status of women who obtained an
abortion and state in which the procedure was performed -- selected states, *
United States, 1992
===============================================================================================================
                                         Marital status
                       ---------------------------------------------------
                          Married +        Unmarried &         Unknown            Total
                       ---------------   ---------------   ---------------   ---------------
State                      No.       %       No.       %       No.       %       No.       %
--------------------------------------------------------------------------------------------
Alabama                  2,471    18.5    10,550    79.0       337     2.5    13,358   100.0
Arizona                  2,957    20.6     9,332    65.0     2,064    14.4    14,353   100.0
Arkansas                 1,126    19.8     4,394    77.4       155     2.7     5,675   100.0
Colorado                 2,295    21.6     8,198    77.3       114     1.1    10,607   100.0
Dist. of Columbia        1,125    13.8     6,725    82.5       301     3.7     8,151 @ 100.0
Georgia                  7,460    19.6    30,182    79.3       410     1.1    38,052   100.0
Hawaii                   1,478    24.8     4,431    74.4        45     0.8     5,954   100.0
Idaho                      342    24.8     1,032    74.9         4     0.3     1,378   100.0
Indiana                  2,355    18.1    10,489    80.8       139     1.1    12,983   100.0
Kansas                   1,923    18.5     8,441    81.3        21     0.2    10,385   100.0
Kentucky                 1,502    17.3     7,061    81.2       133     1.5     8,696   100.0
Maine                      688    21.3     2,385    73.9       153     4.7     3,226   100.0
Maryland                 4,194    21.1    15,242    76.7       424     2.1    19,860   100.0
Massachusetts            7,316    21.2    23,753    68.8     3,458    10.0    34,527   100.0
Michigan                 5,765    16.7    28,534    82.7       197     0.6    34,496   100.0
Minnesota                2,426    15.6    12,856    82.7       264     1.7    15,546   100.0
Mississippi              1,094    14.5     6,451    85.4        10     0.1     7,555   100.0
Missouri                 2,952    22.0    10,311    77.0       127     0.9    13,390   100.0
Montana                    573    20.0     2,037    71.0       259     9.0     2,869   100.0
Nevada                   1,893    23.6     5,905    73.6       224     2.8     8,022   100.0
New Jersey**             8,149    21.4    29,889    78.3       130     0.3    38,168   100.0
New Mexico               1,029    18.3     4,541    80.7        54     1.0     5,624   100.0
New York City           23,584    20.6    88,766    77.4     2,350     2.0   114,700   100.0
North Carolina           7,764    22.0    25,456    72.2     2,033     5.8    35,253   100.0
North Dakota               301    20.2     1,190    79.7         2     0.1     1,493   100.0
Ohio                     6,076    16.9    25,904    71.9     4,039    11.2    36,019   100.0
Oregon                   2,821    22.2     9,198    72.5       666     5.3    12,685   100.0
Pennsylvania             8,577    17.5    40,437    82.5        28     0.1    49,042   100.0
Rhode Island             1,498    22.5     5,082    76.2        87     1.3     6,667   100.0
South Carolina           2,230    20.3     8,776    79.7         2     0.0    11,008   100.0
South Dakota               200    19.3       838    80.7         0     0.0     1,038   100.0
Tennessee                3,751    20.8    14,172    78.6       106     0.6    18,029   100.0
Texas                   20,832    22.9    63,194    69.4     7,087     7.8    91,113   100.0
Utah                     1,632    41.4     2,309    58.6         0     0.0     3,941   100.0
Vermont                    629    22.6     1,994    71.8       155     5.6     2,778   100.0
Virginia                 5,262    17.8    23,660    79.8       719     2.4    29,641   100.0
West Virginia              511    18.2     2,300    81.8         1     0.0     2,812   100.0
Wisconsin                2,096    14.2    12,524 ++ 84.8       153     1.0    14,773 @ 100.0
Wyoming                     57    19.3       238    80.4         1     0.3       296   100.0

Total                  148,934    20.0   568,777    76.4    26,452     3.6   744,163   100.0

Abortion ratio &&           84               790                                 289
--------------------------------------------------------------------------------------------
 * All 37 states for which data were available, the District of Columbia, and New York City; excludes two
   states where unknown marital status was >15%.
 + Married includes married and separated.
 & Unmarried includes never married, divorced, and widowed women.
 @ Includes residents only.
** Based on known distribution of 1991 data.
++ Includes women who were reported as being separated.
&& Calculated as the number of legal abortions obtained by women of a given marital status per 1,000 live
   births to women of the same marital status for these states. For each state, data regarding women of
   unknown marital status were distributed according to the known marital status distribution for that state.
===============================================================================================================
Return to top. Table_11 Note: To print large tables and graphs users may have to change their printer settings to landscape and use a small font size.
TABLE 11. Reported legal abortions, by number of previous live births and state in which the procedure was performed --
selected states, * United States, 1992
===========================================================================================================================================================
                                                           No. of previous live births
                    ---------------------------------------------------------------------------------------------------------
                           0                 1                 2                 3                >=4             Unknown            Total
                    ---------------   ---------------   ---------------   ---------------   ---------------   ---------------   ---------------
State                 No.       %       No.       %       No.       %       No.       %       No.       %       No.       %       No.       %
-----------------------------------------------------------------------------------------------------------------------------------------------
Alabama               6,544    49.0     3,558    26.6     2,260    16.9       686     5.1       282     2.1        28     0.2    13,358   100.0
Arizona               6,624    46.2     3,470    24.2     2,597    18.1     1,116     7.8       357     2.5       189     1.3    14,353   100.0
Arkansas              2,558    45.1     1,626    28.7       974    17.2       364     6.4       138     2.4        15     0.3     5,675   100.0
Colorado              5,934    55.9     2,204    20.8     1,622    15.3       543     5.1       245     2.3        59     0.6    10,607   100.0
Georgia              18,281    48.0    10,307    27.1     6,452    17.0     2,039     5.4       892     2.3        81     0.2    38,052   100.0

Hawaii                2,923    49.1     1,393    23.4     1,007    16.9       417     7.0       188     3.2        26     0.4     5,954   100.0
Idaho                   618    44.8       329    23.9       257    18.7       107     7.8        67     4.9         0     0.0     1,378   100.0
Indiana               6,049    46.6     3,257    25.1     2,398    18.5       874     6.7       312     2.4        93     0.7    12,983   100.0
Kansas +              5,493    52.9     2,424    23.3     1,626    15.7       580     5.6       217     2.1        45     0.4    10,385   100.0
Kentucky              4,547    52.3     2,118    24.4     1,272    14.6       477     5.5       153     1.8       129     1.5     8,696   100.0

Maine                 1,534    47.6       703    21.8       537    16.6       157     4.9        60     1.9       235     7.3     3,226   100.0
Maryland              9,170    46.2     5,469    27.5     3,467    17.5     1,222     6.2       532     2.7         0     0.0    19,860   100.0
Michigan             16,301    47.3     8,591    24.9     6,285    18.2     2,273     6.6       981     2.8        65     0.2    34,496   100.0
Minnesota             8,440    54.3     3,146    20.2     2,453    15.8       934     6.0       518     3.3        55     0.4    15,546   100.0
Mississippi           3,439    45.5     2,101    27.8     1,358    18.0       428     5.7       222     2.9         7     0.1     7,555   100.0

Missouri              5,854    43.7     3,511    26.2     2,561    19.1     1,008     7.5       456     3.4         0     0.0    13,390   100.0
Montana               1,544    53.8       594    20.7       453    15.8       183     6.4        95     3.3         0     0.0     2,869   100.0
Nebraska              3,091    54.8     1,071    19.0       886    15.7       407     7.2       182     3.2         0     0.0     5,637   100.0
Nevada                3,386    42.2     2,163    27.0     1,483    18.5       564     7.0       257     3.2       169     2.1     8,022   100.0
New Jersey &         14,793    38.8    10,915    28.6     7,893    20.7     2,963     7.8     1,349     3.5       255     0.7    38,168   100.0

New Mexico            2,737    48.7     1,426    25.4       964    17.1       333     5.9       150     2.7        14     0.2     5,624   100.0
New York             60,217    36.7    43,742    26.6    33,075    20.1    13,628     8.3     9,847     6.0     3,765     2.3   164,274   100.0
  City               37,364    32.6    33,245    29.0    25,109    21.9    10,576     9.2     8,404     7.3         2     0.0   114,700   100.0
  State              22,853    46.1    10,497    21.2     7,966    16.1     3,052     6.2     1,443     2.9     3,763     7.6    49,574   100.0
North Carolina       17,025    48.3     8,874    25.2     5,217    14.8     1,634     4.6       653     1.9     1,850     5.2    35,253   100.0

North Dakota            865    57.9       263    17.6       224    15.0        97     6.5        44     2.9         0     0.0     1,493   100.0
Ohio +               18,311    50.8     8,596    23.9     6,071    16.9     2,127     5.9       908     2.5         6     0.0    36,019   100.0
Oregon                6,077    47.9     3,004    23.7     2,206    17.4       716     5.6       354     2.8       328     2.6    12,685   100.0
Pennsylvania         23,534    48.0    12,681    25.9     8,388    17.1     2,964     6.0     1,445     2.9        30     0.1    49,042   100.0
Rhode Island +        3,384    50.8     1,552    23.3     1,134    17.0       408     6.1       183     2.7         6     0.1     6,667   100.0

South Carolina        5,259    47.8     3,055    27.8     1,878    17.1       580     5.3       236     2.1         0     0.0    11,008   100.0
South Dakota +          575    55.4       169    16.3       182    17.5        72     6.9        40     3.9         0     0.0     1,038   100.0
Tennessee             8,245    45.7     5,123    28.4     2,973    16.5     1,048     5.8       623     3.5        17     0.1    18,029   100.0
Texas                43,809    48.1    22,732    24.9    15,634    17.2     5,858     6.4     2,983     3.3        97     0.1    91,113   100.0
Utah                  1,826    46.3       956    24.3       700    17.8       290     7.4       161     4.1         8     0.2     3,941   100.0

Vermont               1,616    58.2       535    19.3       454    16.3       111     4.0        62     2.2         0     0.0     2,778   100.0
Virginia             14,881    50.2     7,496    25.3     4,721    15.9     1,569     5.3       679     2.3       295     1.0    29,641   100.0
Washington           12,827    46.5     6,900    25.0     4,960    18.0     1,917     7.0       833     3.0       136     0.5    27,573   100.0
West Virginia         1,372    48.8       774    27.5       470    16.7       142     5.0        48     1.7         6     0.2     2,812   100.0
Wyoming                 138    46.6        84    28.4        41    13.9        22     7.4        11     3.7         0     0.0       296   100.0

Total               349,821    45.5   196,912    25.6   137,133    17.8    50,858     6.6    26,763     3.5     8,009     1.0   769,496   100.0

Abortion ratio @        327               229               319               308               255                                 289
-----------------------------------------------------------------------------------------------------------------------------------------------
* All 38 states for which data were available and New York City; excludes one state where the unknown number of previous live births was >15%.
+ Number of living children.
& Based on known distribution of 1991 data.
@ Calculated as the number of legal abortions obtained by women who had a given number of previous live births per 1,000 live births to women with the
  same number of previous live births for these states. For each state, women whose number of previous live births was unknown were distributed according
  to the known number of previous live births for that state.
===========================================================================================================================================================
Return to top. Table_12 Note: To print large tables and graphs users may have to change their printer settings to landscape and use a small font size.
TABLE 12. Reported legal abortions, by number of previous induced legal abortions and state in which the procedure was
performed -- selected states, * United States, 1992
==============================================================================================================================================================
                                                  No. of previous induced abortions
                       ---------------------------------------------------------------------------------------
                              0                 1                 2                >=3             Unknown            Total
                       ---------------   ---------------   ---------------   ---------------   ---------------   ---------------
State                    No.       %       No.       %       No.       %       No.       %       No.       %       No.       %
--------------------------------------------------------------------------------------------------------------------------------
Alabama                  8,786    65.8     3,373    25.3       798     6.0       363     2.7        38     0.3    13,358   100.0
Arizona                  8,809    61.4     3,791    26.4     1,211     8.4       327     2.3       215     1.5    14,353   100.0
Arkansas                 3,722    65.6     1,475    26.0       339     6.0       124     2.2        15     0.3     5,675   100.0
Colorado                 6,735    63.5     2,573    24.3       832     7.8       376     3.5        91     0.9    10,607   100.0
Dist. of Columbia        2,551    31.3     2,875    35.3     1,524    18.7       806     9.9       395     4.8     8,151 + 100.0

Georgia                 21,673    57.0    10,675    28.1     3,793    10.0     1,693     4.4       218     0.6    38,052   100.0
Hawaii                   3,096    52.0     1,569    26.4       754    12.7       481     8.1        54     0.9     5,954   100.0
Idaho                      964    70.0       291    21.1        87     6.3        35     2.5         1     0.1     1,378   100.0
Indiana                  8,722    67.2     2,868    22.1       892     6.9       403     3.1        98     0.8    12,983   100.0
Kansas                   6,677    64.3     2,410    23.2       734     7.1       301     2.9       263     2.5    10,385   100.0

Kentucky                 5,671    65.2     2,015    23.2       530     6.1       217     2.5       263     3.0     8,696   100.0
Maine                    1,989    61.7       786    24.4       218     6.8       103     3.2       130     4.0     3,226   100.0
Maryland                 9,002    45.3     6,215    31.3     3,015    15.2     1,628     8.2         0     0.0    19,860   100.0
Michigan                19,237    55.8     9,089    26.3     3,733    10.8     2,148     6.2       289     0.8    34,496   100.0
Minnesota                9,501    61.1     3,925    25.2     1,377     8.9       693     4.5        50     0.3    15,546   100.0

Mississippi              4,973    65.8     1,802    23.9       530     7.0       243     3.2         7     0.1     7,555   100.0
Missouri                 7,922    59.2     3,742    27.9     1,155     8.6       571     4.3         0     0.0    13,390   100.0
Montana                  1,933    67.4       664    23.1       190     6.6        82     2.9         0     0.0     2,869   100.0
Nebraska                 3,573    63.4     1,338    23.7       437     7.8       273     4.8        16     0.3     5,637   100.0
Nevada                   3,810    47.5     2,162    27.0       988    12.3       724     9.0       338     4.2     8,022   100.0

New Jersey &            16,657    43.6    11,679    30.6     5,558    14.6     3,781     9.9       493     1.3    38,168   100.0
New Mexico               3,636    64.7     1,354    24.1       387     6.9       227     4.0        20     0.4     5,624   100.0
New York                67,696    41.2    44,917    27.3    24,674    15.0    18,535    11.3     8,452     5.1   164,274   100.0
  City                  42,054    36.7    33,324    29.1    20,172    17.6    16,237    14.2     2,913     2.5   114,700   100.0
  State                 25,642    51.7    11,593    23.4     4,502     9.1     2,298     4.6     5,539    11.2    49,574   100.0

North Carolina          21,915    62.2     8,798    25.0     2,591     7.3     1,023     2.9       926     2.6    35,253   100.0
North Dakota             1,066    71.4       313    21.0        85     5.7        29     1.9         0     0.0     1,493   100.0
Oregon                   6,813    53.7     3,589    28.3     1,351    10.7       736     5.8       196     1.5    12,685   100.0
Pennsylvania            28,841    58.8    13,178    26.9     4,577     9.3     2,410     4.9        36     0.1    49,042   100.0
Rhode Island             3,783    56.7     1,792    26.9       704    10.6       369     5.5        19     0.3     6,667   100.0

South Carolina           7,022    63.8     2,832    25.7       818     7.4       335     3.0         1     0.0    11,008   100.0
South Dakota               889    85.6       120    11.6        21     2.0         8     0.8         0     0.0     1,038   100.0
Tennessee               11,532    64.0     4,482    24.9     1,354     7.5       651     3.6        10     0.1    18,029   100.0
Texas                   55,122    60.5    24,408    26.8     7,827     8.6     3,586     3.9       170     0.2    91,113   100.0
Utah                     2,440    61.9       978    24.8       338     8.6       174     4.4        11     0.3     3,941   100.0

Vermont                  1,697    61.1       694    25.0       249     9.0       138     5.0         0     0.0     2,778   100.0
Virginia                16,883    57.0     8,400    28.3     2,743     9.3     1,254     4.2       361     1.2    29,641   100.0
Washington              14,232    51.6     7,767    28.2     3,209    11.6     2,220     8.1       145     0.5    27,573   100.0
West Virginia            1,823    64.8       662    23.5       188     6.7        85     3.0        54     1.9     2,812   100.0
Wyoming                    201    67.9        66    22.3        22     7.4         7     2.4         0     0.0       296   100.0

Total                  401,594    54.2   199,667    26.9    79,833    10.8    47,159     6.4    13,375     1.8   741,628   100.0
--------------------------------------------------------------------------------------------------------------------------------
* All 37 states for which data were available, the District of Columbia, and New York City; excludes two states where the unknown number of previous induced
  abortions was >15%.
+ Includes residents only.
& Based on known distribution of 1991 data.
==============================================================================================================================================================
Return to top. Table_13 Note: To print large tables and graphs users may have to change their printer settings to landscape and use a small font size.
TABLE 13. Reported legal abortions, by race, age group, and marital status of women
who obtained abortions --United States, 1992
=====================================================================================
                                  Race
                    ---------------------------------
                        White +         Black/Other          Total
Age group (yrs)/    ---------------   ---------------   ---------------
Marital status *      No.       %       No.       %       No.       %
-----------------------------------------------------------------------
Age group
    <15               2,512     0.6     3,093     1.2     5,605     0.8
  15-19              81,331    19.8    47,094    18.8   128,425    19.4
  20-24             141,370    34.4    86,887    34.6   228,257    34.5
  25-29              88,307    21.5    59,367    23.6   147,674    22.3
  30-34              57,091    13.9    34,350    13.7    91,441    13.8
  35-39              31,193     7.6    16,184     6.4    47,377     7.2
   >=40               9,414     2.3     4,162     1.7    13,576     2.0

  Total &           411,218   100.0   251,137   100.0   662,355   100.0

Marital status
  Married            83,122    22.9    41,051    17.8   124,173    20.9
  Unmarried         280,360    77.1   189,277    82.2   469,637    79.1

  Total @           363,482   100.0   230,328   100.0   593,810   100.0
-----------------------------------------------------------------------
* Excludes unknowns.
+ Includes Hispanic.
& Reported by 34 states and New York City.
@ Reported by 32 states and New York City.
=====================================================================================
Return to top. Table_14 Note: To print large tables and graphs users may have to change their printer settings to landscape and use a small font size.
TABLE 14. Reported legal abortions, by Hispanic ethnicity, age group, and marital
status of women who obtained abortions --United States, 1992
===================================================================================
                             Hispanic ethnicity
                      --------------------------------
                         Hispanic        Non-Hispanic         Total
Age group (yrs)/      --------------    --------------    --------------
Marital status *        No.      %        No.      %        No.      %
------------------------------------------------------------------------
Age group
    <15                   479    0.7      3,163    0.8      3,642    0.8
  15-19                13,191   18.0     74,961   19.0     88,152   18.9
  20-24                25,332   34.6    135,175   34.3    160,507   34.4
  25-29                17,554   23.9     87,867   22.3    105,421   22.6
  30-34                10,368   14.1     55,093   14.0     65,461   14.0
  35-39                 4,950    6.8     28,856    7.3     33,806    7.2
   >=40                 1,432    2.0      8,506    2.2      9,938    2.1

  Total                73,306  100.0    393,621  100.0    466,927  100.0

Marital status
  Married              17,770   25.3     72,561   20.1     90,331   21.0
  Unmarried            52,502   74.7    288,330   79.9    340,832   79.0

  Total                70,272  100.0    360,891  100.0    431,163  100.0
------------------------------------------------------------------------
* Excludes unknowns. Reported by 19 states and New York City.
===================================================================================
Return to top. Table_15A Note: To print large tables and graphs users may have to change their printer settings to landscape and use a small font size.
TABLE 15A. Reported legal abortions by weeks of gestation and by age group, race, and Hispanic ethnicity of women who
obtained abortions -- United States, 1992
=================================================================================================================================================
                                                                Weeks of gestation
                    ---------------------------------------------------------------------------------------------------------
Age group (yrs)/          <=8              9-10              11-12             13-15             16-20             >=21              Total
Race/Hispanic       ---------------   ---------------   ---------------   ---------------   ---------------   ---------------   ---------------
ethnicity *           No.       %       No.       %       No.       %       No.       %       No.       %       No.       %       No.       %
-----------------------------------------------------------------------------------------------------------------------------------------------
Age group
    <15               2,074    34.7     1,477    24.7       915    15.3       679    11.4       590     9.9       243     4.1     5,978   100.0
  15-19              59,743    43.1    35,581    25.6    20,207    14.6    11,654     8.4     8,416     6.1     3,152     2.3   138,753   100.0
  20-24             123,701    50.6    60,973    24.9    30,865    12.6    15,343     6.3    10,068     4.1     3,657     1.5   244,607   100.0
  25-29              87,792    55.7    37,126    23.5    17,340    11.0     7,980     5.1     5,568     3.5     1,863     1.2   157,669   100.0
  30-34              57,493    58.5    22,320    22.7     9,905    10.1     4,377     4.5     3,148     3.2     1,115     1.1    98,358   100.0
  35-39              30,841    60.3    11,306    22.1     4,694     9.2     2,070     4.0     1,753     3.4       523     1.0    51,187   100.0
   >=40               9,026    61.8     2,993    20.5     1,289     8.8       552     3.8       570     3.9       180     1.2    14,610   100.0

  Total +           370,670    52.1   171,776    24.2    85,215    12.0    42,655     6.0    30,113     4.2    10,733     1.5   711,162   100.0

Race
  White             217,238    54.9    94,016    23.8    44,209    11.2    20,594     5.2    14,417     3.6     5,199     1.3   395,673   100.0
  Black              97,901    45.1    55,857    25.7    30,895    14.2    16,524     7.6    11,677     5.4     4,268     2.0   217,122   100.0
  Other              17,129    57.7     6,236    21.0     3,295    11.1     1,354     4.6     1,083     3.6       591     2.0    29,688   100.0

  Total &           332,268    51.7   156,109    24.3    78,399    12.2    38,472     6.0    27,177     4.2    10,058     1.6   642,483   100.0

Hispanic ethnicity
  Hispanic           36,969    52.7    15,883    22.6     8,505    12.1     4,235     6.0     3,498     5.0     1,068     1.5    70,158   100.0
  Non-Hispanic      201,709    51.3    93,579    23.8    48,566    12.3    24,571     6.2    17,568     4.5     7,309     1.9   393,302   100.0

  Total @           238,678    51.5   109,462    23.6    57,071    12.3    28,806     6.2    21,066     4.5     8,377     1.8   463,460   100.0
-----------------------------------------------------------------------------------------------------------------------------------------------
* Excludes unknowns.
+ Reported by 36 states and New York City.
& Reported by 33 states and New York City.
@ Reported by 19 states and New York City.
=================================================================================================================================================
Return to top. Table_15B Note: To print large tables and graphs users may have to change their printer settings to landscape and use a small font size.
TABLE 15B. Reported legal abortions obtained at <=8 weeks of gestation, * by weeks of gestation, and total number of
abortions, by age group, race, and Hispanic ethnicity of women who obtained abortions -- United States, 1992
======================================================================================================================
                                    Weeks of gestation                           Total abortions obtained
                    ---------------------------------------------------     -----------------------------------
Age group (yrs)/        <=6                 7                 8             <=8 wks of gestation   No. obtained
Race/Hispanic       ---------------   ---------------   ---------------     --------------------   at all weeks
ethnicity +           No.       %       No.       %       No.       %          No.           %     of gestation
---------------------------------------------------------------------------------------------------------------
Age group
    <15                 561     9.4       543     9.1       970    16.2        2,074        34.7       5,978
  15-19              14,397    10.4    17,383    12.5    27,963    20.2       59,743        43.1     138,753
  20-24              32,288    13.2    36,748    15.0    54,665    22.3      123,701        50.6     244,607
  25-29              24,662    15.6    26,371    16.7    36,759    23.3       87,792        55.7     157,669
  30-34              16,928    17.2    17,260    17.5    23,305    23.7       57,493        58.5      98,358
  35-39               9,092    17.8     9,307    18.2    12,442    24.3       30,841        60.3      51,187
   >=40               2,847    19.5     2,686    18.4     3,493    23.9        9,026        61.8      14,610

  Total &           100,775    14.2   110,298    15.5   159,597    22.4      370,670        52.1     711,162

Race
  White              56,608    14.3    65,285    16.5    95,345    24.1      217,238        54.9     395,673
  Black              24,658    11.4    27,324    12.6    45,919    21.1       97,901        45.1     217,122
  Other               4,600    15.5     4,551    15.3     7,978    26.9       17,129        57.7      29,688

  Total @            85,866    13.4    97,160    15.1   149,242    23.2      332,268        51.7     642,483

Hispanic ethnicity
  Hispanic            9,037    12.9    10,738    15.3    17,194    24.5       36,969        52.7      70,158
  Non-Hispanic       50,881    12.9    59,621    15.2    91,207    23.2      201,709        51.3     393,302

  Total **           59,918    12.9    70,359    15.2   108,401    23.4      238,678        51.5     463,460
---------------------------------------------------------------------------------------------------------------
 * Percentages are calculated using total number of abortions obtained at all weeks of gestation.
 + Excludes unknowns.
 & Reported by 34 states and New York City.
 @ Reported by 31 states and New York City.
** Reported by 17 states and New York City.
======================================================================================================================
Return to top. Table_16 Note: To print large tables and graphs users may have to change their printer settings to landscape and use a small font size.
TABLE 16. Reported legal abortions, by weeks of gestation and type of procedure * -- United States, 1992
======================================================================================================================================================
                                                                   Weeks of gestation
                       --------------------------------------------------------------------------------------------------------
                            <=8               9-10              11-12             13-15             16-20             >=21              Total
                       --------------    ---------------    --------------    --------------    --------------    -------------    -----------------
Type of procedure        No.       %       No.       %       No.       %       No.       %       No.       %       No.       %       No.       %
----------------------------------------------------------------------------------------------------------------------------------------------------
Curettage
  (suction or
  sharp) +             362,453    99.9   166,815    99.9    82,911    99.6    40,740    98.2    25,180    86.0    8,505    86.4    686,604    99.0

Intrauterine saline
  instillation              43     0.0 &      32     0.0 &      53     0.1       200     0.5     1,324     4.5      422     4.3      2,074     0.3

Intrauterine
  prostaglandin
  instillation              22     0.0 &      19     0.0 &      36     0.0 &     199     0.5     1,273     4.3      469     4.8      2,018     0.3

Hysterotomy/
  Hysterectomy              11     0.0 &       7     0.0 &       3     0.0 &       3     0.0 &      11     0.0 &      6     0.1         41     0.0 &

Other @                    282     0.1        70     0.0 &     211     0.3       325     0.8     1,495     5.1      437     4.4      2,820     0.4

Total **               362,811   100.0   166,943   100.0    83,214   100.0    41,467   100.0    29,283   100.0    9,839   100.0    693,557   100.0
----------------------------------------------------------------------------------------------------------------------------------------------------
 * Excludes unknowns.
 + Includes dilatation and evacuation.
 & <=0.05%.
 @ Includes instillation procedures not reported as a specific category.
** Reported by 35 states and New York City.
======================================================================================================================================================
Return to top. Table_17 Note: To print large tables and graphs users may have to change their printer settings to landscape and use a small font size.
TABLE 17. Number and case-fatality rates * of abortion-related deaths reported to CDC,
by type of abortion -- United States, 1972-1990
========================================================================================
                     Type of abortion
        ------------------------------------------
            Induced
        ----------------                              Total no.    Case-fatality
Year    Legal    Illegal    Spontaneous    Unknown    of deaths        rate
--------------------------------------------------------------------------------
1972      24       39            25           2          90             4.1
1973      25       19            10           3          57             4.1
1974      26        6            21           1          54             3.4
1975      29        4            14           1          48             3.4
1976      11        2            13           1          27             1.1
1977      17        4            16           0          37             1.6
1978       9        7             9           0          25             0.8
1979      22        0            10           0          32             1.8
1980       9        1             7           2          19             0.7
1981       8        1             3           0          12             0.6
1982      11        1             6           0          18             0.8
1983      11        1             7           0          19             0.9
1984      12        0             6           0          18             0.9
1985      11        1             8           1          21             0.8
1986      11        0             5           2          18             0.8
1987       7        2             8           0          17             0.5
1988      16        0             8           0          24             1.2
1989      12        1             4           0          17             0.9
1990       5        0             5           0          10             0.3

Total    276       89           185          13         563             1.3
--------------------------------------------------------------------------------
* Legal induced abortion-related deaths per 100,000 legal induced abortions.
========================================================================================
Return to top. Figure_1 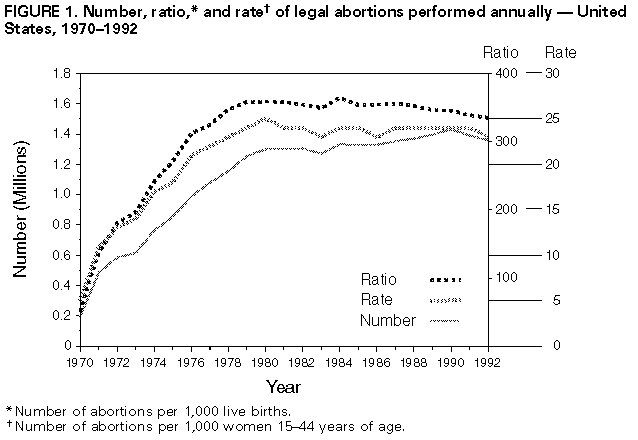 Return to top. Figure_2 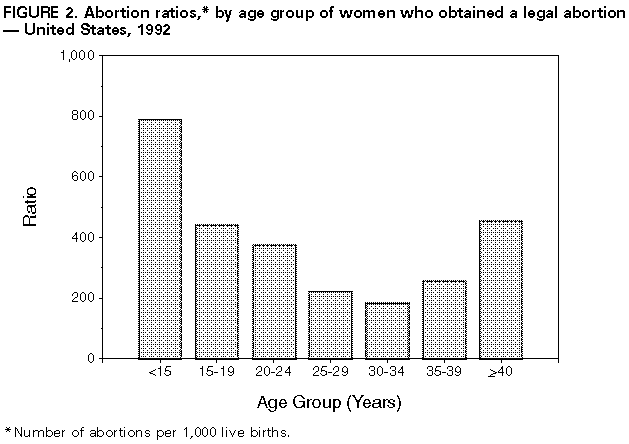 Return to top. Figure_3 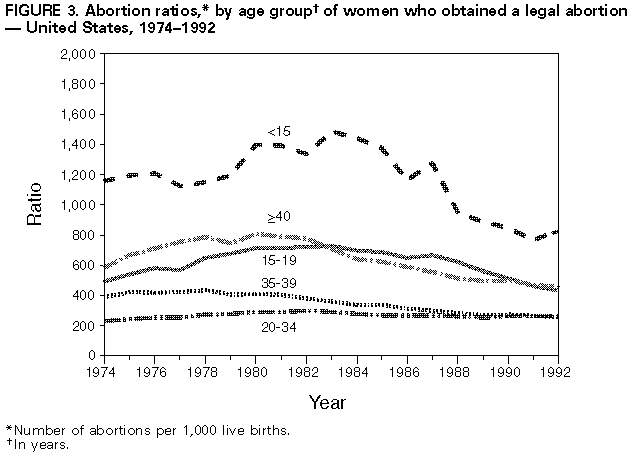 Return to top. Figure_4 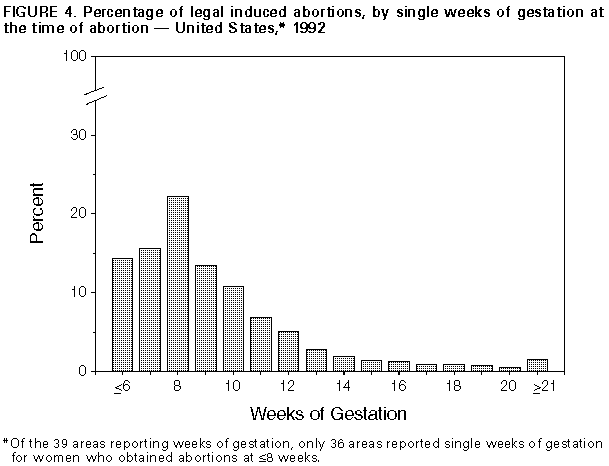 Return to top. Figure_5 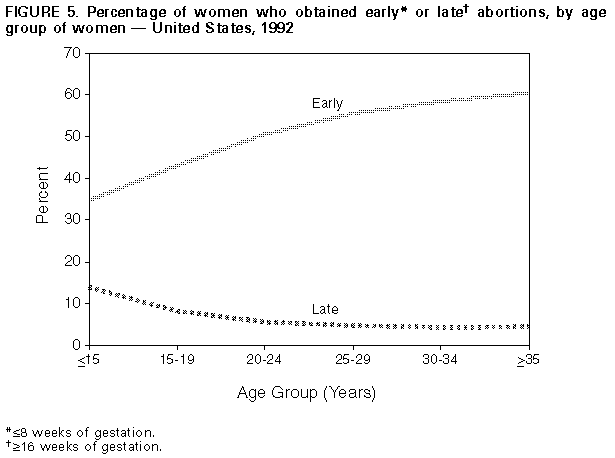 Return to top. Figure_6 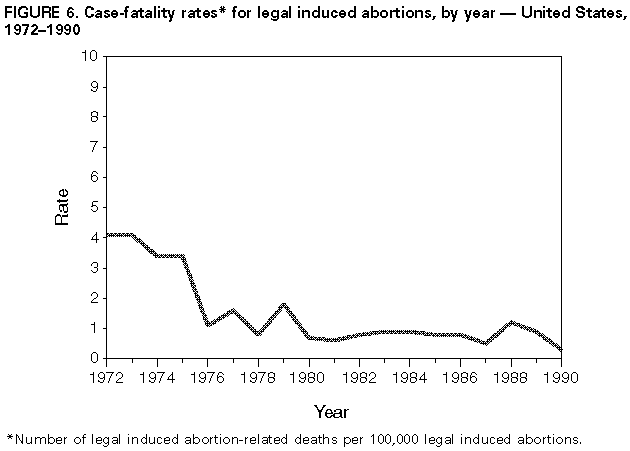 Return to top. Figure_7 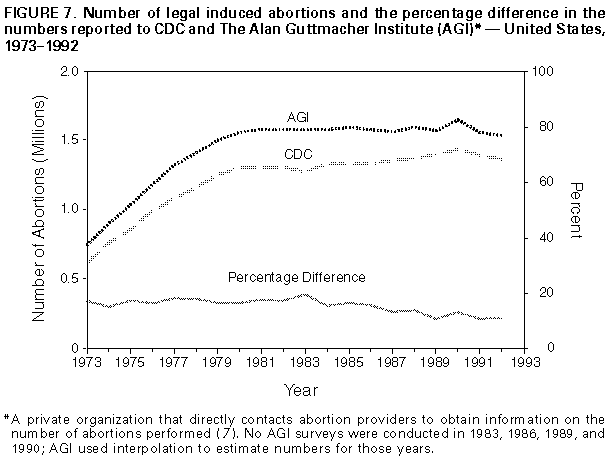 Return to top. Disclaimer All MMWR HTML versions of articles are electronic conversions from ASCII text into HTML. This conversion may have resulted in character translation or format errors in the HTML version. Users should not rely on this HTML document, but are referred to the electronic PDF version and/or the original MMWR paper copy for the official text, figures, and tables. An original paper copy of this issue can be obtained from the Superintendent of Documents, U.S. Government Printing Office (GPO), Washington, DC 20402-9371; telephone: (202) 512-1800. Contact GPO for current prices. **Questions or messages regarding errors in formatting should be addressed to mmwrq@cdc.gov.Page converted: 09/19/98 |
|||||||||
This page last reviewed 5/2/01
|