 |
|
|
|
|
|
|
| ||||||||||
|
|
|
|
|
|
|
||||
| ||||||||||
|
|
|
|
|
Persons using assistive technology might not be able to fully access information in this file. For assistance, please send e-mail to: mmwrq@cdc.gov. Type 508 Accommodation and the title of the report in the subject line of e-mail. Surveillance for Certain Health Behaviors Among States and Selected Local Areas --- Behavioral Risk Factor Surveillance System, United States, 2004Elizabeth Hughes, DrPH, Melissa McCracken, MPH, Henry Roberts, PhD, Ali H. Mokdad, PhD, Balarami Valluru, MS,
Corresponding author: Ruth Jiles, PhD, Division of Adult and Community Health, National Center for Chronic Disease Prevention and Health Promotion, MS K-66, 4770 Buford Hwy, N.E., Atlanta, GA 30341. Telephone: 770-488-5145; Fax: 770-488-8150; E-mail: rxg0@cdc.gov. AbstractProblem: Continuous monitoring of behaviors that increase the risk for chronic diseases and use of preventive practices are essential for the development, implementation, and evaluation of health promotion programs and policies, and other intervention strategies to prevent morbidity and mortality. Data from states/territories, selected metropolitan and micropolitan statistical areas (MMSAs), and counties provide the impetus for policymakers and other stakeholders to develop and promote the improvement of their community's overall health status. Reporting Period Covered: Data in this report were collected during January 1--December 31, 2004, from states/territories, MMSAs, and counties that participated in the 2004 Behavioral Risk Factor Surveillance System (BRFSS). Description of the System: BRFSS is an ongoing, state-based, random-digit--dialed telephone survey that employs a multistage cluster design. BRFSS collects information on health risk behaviors and preventive health practices related to the leading causes of death from the U.S. civilian, noninstitutionalized population aged >18 years. During 2004, a total of 49 states, the District of Columbia (DC), Puerto Rico, and the U.S. Virgin Islands participated in BRFSS. Among these states and territories, completed surveys were collected from a selection of 134 MMSAs and 199 counties. Results: Prevalence of high-risk behaviors for chronic diseases, awareness of specific medical conditions, screening for certain cancers, and use of preventive health services varied substantially by state/territory, MMSA, and county. The proportion of the population that achieved Healthy People 2010 (HP 2010) objectives also varied by state/territory, MMSA, and county. In 2004, HP 2010 objectives for 100% health-care coverage and vaccination for pneumonia and influenza among persons aged >65 years were not achieved by any state/territory, MMSA, or county. Twelve states/territories, 47 MMSAs, and 74 counties achieved the HP 2010 objective of <20% of adults engaged in no leisure-time physical activity or exercise. The HP 2010 objective to reduce the proportion of adults who currently smoke cigarettes to <12% was achieved by two states/territories, four MMSAs, and six counties. One MMSA and one county achieved the HP 2010 target of <6% who engage in binge drinking during the month preceding the survey. The HP 2010 target of <15% of adults who are obese was obtained by one MMSA and eight counties. The HP 2010 objective to reduce the proportion to <20% for older adults who have had all of their natural teeth extracted was achieved by 23 states/territories, 51 MMSAs, and 45 counties. The HP 2010 target for adults aged >50 years who have ever received a sigmoidoscopy is 50%. BRFSS measured both sigmoidoscopy and colonoscopy. Using this measure, 38 states, 110 MMSAs, and 154 counties achieved the 50% goal. Four counties achieved the HP 2010 objective of 50% for adults who received a blood stool test within the previous 2 years. The HP 2010 objective to increase the proportion of women aged >18 years who had a Papanicolaou (Pap) test within the preceding 3 years is 90%. Twenty-four MMSAs and 49 counties achieved this objective. The HP 2010 objective for women aged >40 years who have received a mammogram within the preceding 2 years is 70%. Thirty-nine states, 112 MMSAs, and 168 counties achieved the objective. This report includes several risk behaviors and conditions that, although not included in HP 2010 goals, are important public health problems. These include self-reported fair-to-poor health status, heavy alcohol consumption, asthma, diabetes, and prostate cancer screening. The 2004 BRFSS data indicate great variability in the prevalence of self-reported fair-to-poor health status (5.7%--34.8%) and use of prostate cancer screening (34.7%--65.2%) by states/territories, MMSAs, and counties. Among these areas, the prevalence of current asthma ranged from 4.1% to 12.4%, and the prevalence of diabetes ranged from 3.2% to 12.5%. Interpretation: The findings in this report indicate variations in health risk behaviors and use of preventive health screenings and health services among adults at the state, local, and county levels. These variations substantiate the continued need for public health surveillance in designing, implementing, monitoring, and evaluating public health policies and health-care use programs to reduce morbidity and mortality from the effect of high-risk health behaviors and subsequent chronic disease outcomes. Public Health Action: Data from BRFSS are essential for monitoring prevalence of high-risk health behaviors, specific diseases, and use of preventive health services; dictating the design, focus, implementation, and evaluation of prevention health programs and strategies; and monitoring progress toward obtaining local, state, and national health objectives. Data from the 2004 BRFSS indicate a continual necessity to initiate and implement health promotion strategies for identifying specific health risk behaviors and practices and for assessing progress toward achieving disease prevention and health promotion objectives at state and local levels throughout the United States. Introduction Chronic diseases are the leading causes of morbidity and mortality in the United States. Practicing healthy behaviors (e.g., eating a nutritious diet, being physically active, and avoiding tobacco use) has been linked to chronic disease prevention (1--5). In addition, the use of preventive health-care services e.g., cancer screenings and receiving recommended immunizations has been shown to reduce morbidity and mortality attributed to chronic diseases (6). Healthy People 2010 (HP 2010) established objectives that, if achieved, will decrease morbidity and premature mortality by reducing the prevalence of high-risk behaviors and increase use of preventive services (7). The Behavioral Risk Factor Surveillance System (BRFSS) is an ongoing, state-based surveillance system and a key source for information on health risk behavior, preventive health practices, and access to health care. BRFSS has been a source of risk behavior data since 1984, providing comparable state-specific prevalence estimates of selected health risk behaviors that are associated with chronic diseases. The growth in states' BRFSS sample size facilitated calculation of prevalence estimates for selected metropolitan and micropolitan statistical areas (MMSAs) and selected counties for the first time using 2002 BRFSS data. MMSAs used in BRFSS and included in this report are defined by the U.S. Census Bureau based on county population density (8). This report provides comparable prevalence estimates for selected risk behaviors by states/territories, MMSAs, and counties using 2004 BRFSS data. Comparisons are made between 2004 prevalence estimates and HP 2010 objectives (Table 1). The history, rationale, use, reliability, and validity of measures of BRFSS and new challenges facing this surveillance system have been described previously (9,10). MethodsBRFSS is a cross-sectional telephone survey conducted by all state health departments, the District of Columbia (DC), Puerto Rico, and the U.S. Virgin Islands with assistance from CDC. BRFSS employs a multistage cluster design based on random-digit--dialing methods to select a representative sample of the U.S. civilian, noninstutionalized population aged >18 years. The BRFSS questionnaire includes questions regarding personal behaviors that increase risk for one or more of the 10 leading causes of death in the United States. This report consists of summary data from states/territories, selected MMSAs, and their corresponding counties in 49 states, DC, Puerto Rico, and the U.S. Virgin Islands with a sample size of >500 respondents or 19 per weighting class. Within these states/territories, 134 MMSAs, and 199 counties had an adequate sample size to produce stable prevalence estimates. Statistics for selected MMSAs and counties were reported as not available if the denominator was <50 or if the confidence interval half width was >10. In 2004, a total of 303,822 interviews were completed. QuestionnaireThe 2004 BRFSS questionnaire included three components: the core, optional modules, and state-added questions. The core consisted of standardized questions asked of all respondents in each state and territory. The optional modules consisted of standardized questions that addressed specific topics relevant to health behaviors and health-related conditions. Each state has the option to choose from these modules for inclusion in the survey. The state-added questions consisted of questions developed and used by one or more states to address state-specific criteria. The 2004 BRFSS questionnaire incorporated core questions that addressed demographics, health status, healthy days--health-related quality of life, health-care access, no leisure-time physical activity or exercise, environmental factors, excess sun exposure, tobacco/cigarette use, alcohol consumption, asthma, diabetes, oral health, immunization, veteran's status, women's health, prostate cancer screening, colorectal cancer screening, family planning, disability, human immunodeficiency virus/acquired immunodeficiency syndrome (HIV/AIDS), and firearms. In addition, in 2004, states selected the following optional modules that addressed health issues: diabetes (45 states), childhood asthma (28), adult asthma history (26), secondhand smoke policy (21), smoking cessation (21), binge drinking (14), folic acid (14), influenza (14), other tobacco products (14), arthritis burden (nine), hypertension awareness (nine), arthritis management (eight), cardiovascular disease (eight), reactions to race (eight), heart attack and stroke (seven), cholesterol awareness (six), healthy days-symptoms (four), indoor air quality (four), home environment (three), and sexual behavior (two). Two states did not select optional modules for administration. For this report, measures reported include health-care coverage and health-care status; no leisure-time physical activity or exercise; cigarette smoking behavior; alcohol consumption behavior; prevalence of overweight and obesity, asthma, and diabetes; oral health; women's health screenings (Papanicolaou [Pap] test and mammogram); prostate cancer screening (prostate specific antigen [PSA] test); colorectal cancer screening (sigmoidoscopy and colonoscopy, blood stool test); and influenza and pneumococcal vaccination for persons aged >65 years. Data Collection and ProcessingBRFSS data are collected monthly by each state and sent to CDC, which then checks the data for reliability and prepares it for analyses. In 2004, a computer-assisted telephone interviewing (CATI) system was used to collect data in 49 states, DC, Puerto Rico, and the U.S. Virgin Islands. Data Weighting and AnalysisAt the end of the survey year, data from all states are submitted to CDC, where monthly files are used to create a yearly data file for each state. The annual state file is weighted inversely to the respondent's probability of being selected and the 2004 age-race-sex-specific population data using the 2004 census projections reported by the U.S. Census Bureau for each state and selected MMSAs. These sampling weights are then used to calculate BRFSS state and MMSA level prevalence estimates. Detailed weighting and analytic methodologies are documented elsewhere (11). SAS® and SUDAAN® were used in this analyses to account for the complex sampling design and to calculate the standard errors and 95% confidence intervals (CI) (12,13). In 2004, the number of interviews completed ranged from 2,565 in Alaska to 18,125 in Washington (median: 4,864), and the response rates ranged from 32.2% in New Jersey to 75.9% in Puerto Rico (median: 52.7%) based on Council of American Survey and Research Organizations guidelines. The quality of BRFSS data has been judged to be reliable based on a number of measures. When compared with demographic distributions in census data, BRFSS data have minimal bias. Bias estimates in 2000 were lower than those reported for 1995, when the response rates were higher (9). When BRFSS data are compared with other surveys, estimates are similar, suggesting these data are reliable and valid (10). Aggregate BRFSS data provide national prevalence estimates that are used to monitor progress toward achieving health promotion and disease prevention goals (14). ResultsHealth Risk BehaviorsHealth-Care Coverage Respondents were classified as having health-care coverage if they reported having health insurance or a type of governmental health plan such as Medicare and Medicaid. In 2004, the estimated prevalence of adults who had health-care coverage ranged from 92.1% in both Minnesota (CI = 91.1%--93.2%) and Puerto Rico (CI = 90.8%--93.3%) to 70.2% (CI = 68.0%--72.4%) in the U.S. Virgin Islands (median: 85.1%) (Table 2). Among MMSAs, respondents who had health-care coverage ranged from 93.0% (CI = 91.3%--94.7%) in Cambridge-Newton-Framingham, Massachusetts, to 63.5% (CI = 58.7%--68.4%) in El Paso, Texas (median: 85.6%) (Table 3). For selected counties, respondents who had health-care coverage ranged from 96.8% (CI = 94.3%--99.3%) in Dakota County, Minnesota, to 63.5% (CI = 58.7%--68.4%) in El Paso County, Texas (median: 86.0%) (Table 4). The HP 2010 objective is to increase the proportion of persons with health insurance to 100%. In 2004, no state/territory, MMSA, or county achieved this objective. Health Status Fair or Poor Health. Respondents were asked to rate their general health as poor, fair, good, very good, or excellent. Respondents were classified into two groups: those with reported fair or poor health and those with good, very good, or excellent health. In 2004, the self-reported prevalence of fair or poor health among adults ranged from 34.8% (CI = 33.0%--36.6%) in Puerto Rico to 10.0% (CI = 9.1%--11.0%) in Minnesota (median: 15.1%) (Table 5). Among the 134 MMSAs, self-reported prevalence of fair or poor health ranged from 27.3% (CI = 23.0%--31.5%) in El Paso, Texas, to 5.7% (CI = 3.0%--8.4%) in Fargo, North Dakota-Minnesota (median: 14%) (Table 6). The self-reported prevalence of fair or poor health among counties ranged from 27.5% (CI = 22.0%--32.9%) in Gaston County, North Carolina, to 6.4% (CI = 4.1%--8.6%) in Cass County, North Dakota (median: 13.7%) (Table 7). Leisure-Time Physical Activity. Leisure-time physical activity was measured by the respondent's indication of no participation in exercise (e.g., running, calisthenics, golf, gardening, or walking) other than their regular job during the preceding month. In 2004, the estimated prevalence of no participation in leisure-time activity ranged from 46.6% (CI = 44.6%--48.6%) in Puerto Rico to 15.9% (CI = 14.7%--17.1%) in Minnesota (median: 22.9%) (Table 8). Among all selected MMSAs, estimated prevalence of no participation in leisure-time physical activity ranged from 38.2% (CI = 33.3%--43.2%) in Houma-Boyou Cane-Thibodaux, Louisiana, to 14.3% (CI = 11.0%--17.6%) in Provo-Orem, Utah (median: 21.9%) (Table 9); among counties, the prevalence ranged from 39.0% (CI = 33.0%--44.9%) in Wyandotte County, Kansas, to 12.7% (CI = 7.4%--17.9%) in Summit County, Utah (median: 21.4%) (Table 10). Thirteen states/territories, 47 MMSAs, and 74 counties achieved the HP 2010 objective to reduce the proportion of adults who engage in no leisure-time physical activity to 20%. Current Cigarette Smoking. Respondents were classified as current smokers if they reported having smoked at least 100 cigarettes during their lifetime and acknowledged smoking every day or some days during the time of the survey. In 2004, the estimated prevalence of adults who were classified as current cigarette smokers ranged from 9.4% (CI = 8.0%--10.8%) in the U.S. Virgin Islands to 27.5% (CI = 25.8%--29.3%) in Kentucky (median: 20.8%) (Table 11). The prevalence of current cigarette smoking among MMSAs ranged from 6.2% (CI = 4.0%--8.5%) in Provo-Orem, Utah, to 29.9% (CI = 25.1%--34.8%) in Houma-Boyou Cane-Thibodaux, Louisiana (median: 21.5%) (Table 12). Current cigarette smoking among counties ranged from 6.3% (CI = 4.0%--8.6%) in Utah County, Utah, to 32.0% (CI = 25.1%--38.8%) in Stewart County, Tennessee (median: 20.8%) (Table 13). Two states/territories, four MMSAs, and six counties achieved the HP 2010 current cigarette smoking goal of 12% prevalence. Alcohol Consumption. Two measures of alcohol consumption are reported for 2004: binge drinking and heavy drinking. Binge drinking. Binge drinking was defined as having five or more drinks on at least one occasion during the preceding month. In 2004, the estimated prevalence of binge drinking among adults ranged from 21.8% (CI = 20.3%--23.4%) in Wisconsin to 8.3% (CI = 6.9%--9.6%) in Tennessee (median: 14.9%) (Table 14). The prevalence of binge drinking for selected MMSAs ranged from 24.3% (CI = 18.4%--30.2%) in Fargo, North Dakota-Minnesota, to 3.7% (CI = 2.1%--5.2%) in Provo-Orem, Utah (median: 14.5%) (Table 15), and for counties, the prevalence ranged from 26.5% (CI = 21.7%--31.3%) in Cass County, North Dakota, to 3.6% (CI = 2.0%--5.2%) in Utah County, Utah (median: 14.9%) (Table 16). One MMSA and one county achieved the HP 2010 binge drinking goal of 6% prevalence among adults. Heavy drinking. Heavy drinking was defined as having an average of two or more drinks per day for men or one or more drinks per day for women during the month preceding the interview. In 2004, the estimated prevalence of heavy drinking among adults ranged from 7.4% in both Rhode Island (CI = 6.2%--8.5%) and Wisconsin (CI = 6.4%--8.4%) to 2.8% in both Tennessee (CI = 2.1%--3.5%) and Utah (CI = 2.3%--3.4%) (median: 4.8%) (Table 17). The prevalence of heavy drinking in selected MMSAs ranged from 8.5% (CI = 6.5%--10.5%) in Reno-Sparks, Nevada, to 1.6% in both Provo-Orem, Utah (CI = 0.5%--2.7%), and Scottsbluff, Nebraska (CI = 0.4%--2.8%) (median: 4.7%) (Table 18); for counties, the estimated prevalence ranged from 10.8% (CI = 4.4%--17.2%) in Franklin County, Ohio, to 1.2% (CI = 0.3%--2.1%) in Johnston County, North Carolina (median: 4.8%) (Table 19). Chronic Conditions Overweight and Obesity. Self-reported weight and height were used to calculate body mass index (BMI) (weight [kg]/height [m2]). Overweight or obesity was classified as a BMI of >25.0, and obesity alone was classified as BMI of >30.0. In 2004, the estimated prevalence of overweight or obese adults ranged from 65.6% (CI = 63.9%--67.2%) in Mississippi to 53.0% (CI = 51.2%--54.8%) in Colorado (median: 60.4%) (Table 20). Among MMSAs, the prevalence of overweight or obese adults ranged from 67.1% (CI = 61.7%--72.4%) in Huntington-Ashland, West Virginia-Kentucky-Ohio, to 46.1% (CI = 41.3%--51.0%) in Santa Fe, New Mexico (median: 59.9%) (Table 21); among counties, the estimated prevalence ranged from 70.2% (CI = 64.7%--75.6%) in Johnston County, North Carolina, to 43.5% (CI = 38.3%--48.8%) in New York County, New York (median: 59.4%) (Table 22). The estimated prevalence of obesity among adults ranged from 29.5% (CI = 27.9%--31.0%) in Mississippi to 16.8% (CI = 15.4%--18.1%) in Colorado (median: 23.2%) (Table 23). Among selected MMSAs, obesity prevalence ranged from 32.5% (CI = 26.4%--38.6%) in Huntington-Ashland, West Virginia-Kentucky-Ohio, to 14.5% (CI = 10.9%--18.2%) in Santa Fe, New Mexico (median: 22.7%) (Table 24) and among counties from 35.1% (CI = 29.4%--40.8%) in Lake County, Indiana, to 8.9% (CI = 4.4%--13.5%) in Summit County, Utah (median: 22.5%) (Table 25). One MMSA and eight counties achieved the HP 2010 goal of 15% for obesity prevalence. Asthma. Respondents who reported that they were ever told by a health-care professional they had asthma and still have asthma were classified as currently having asthma. Respondents currently having asthma ranged from 10.3% (CI = 9.3%--11.3%) in New Hampshire to 4.6% (CI = 3.6%--5.6%) in the U.S. Virgin Islands (median: 8.3%) (Table 26). The estimated prevalence of adults who currently have asthma in selected MMSAs ranged from 12.0% (CI = 8.9%--15.2%) in Norwich-New London, Connecticut, to 5.0% (CI = 3.2%--6.8%) in Shreveport-Bossier City, Louisiana (median: 8.1%) (Table 27); among counties, the estimated prevalence ranged from 12.4% (CI = 8.3%--16.6%) in Philadelphia County, Pennsylvania, to 4.1% (CI = 1.8%--6.5%) in Orange County, Florida (median: 8.4%) (Table 28). Diabetes. Persons were classified as having diabetes if they reported ever being told by a doctor that they have diabetes. Gestational diabetes was not included in these reported estimates. In 2004, diabetes prevalence ranged from 11.0% (CI = 9.9%--12.2%) in West Virginia to 4.2% (CI = 3.2%--5.3%) in Alaska (median: 7.1%) (Table 29). Among selected MMSAs, diabetes prevalence estimates ranged from 12.2% (CI = 9.5%--15.0%) in Charleston, West Virginia, to 3.2% (CI = 1.8%--4.5%) in Provo-Orem, Utah (median: 6.6%) (Table 30). Among selected counties, the prevalence of diabetes ranged from 12.5% (CI = 8.3%--16.7%) in Aiken County, South Carolina, to 3.2% (CI = 1.8%--4.6%) in Utah County, Utah (median: 6.5%) (Table 31). Preventive Practices Influenza Vaccination. In 2004, state-specific prevalence estimates for adults aged >65 years who had received an influenza vaccination during the preceding 12 months ranged from 78.8% (CI = 75.8%--81.9%) in Colorado to 35.3% (CI = 31.6%--39.1%) in Puerto Rico (median: 67.9%) (Table 32). The estimated prevalence among selected MMSAs ranged from 81.6% (CI = 74.0%--89.2%) in Cheyenne, Wyoming, to 54.9% (CI = 46.9%--62.9%) in Las Vegas-Paradise, Nevada (median: 68.0 %) (Table 33); among selected counties, the estimated prevalence of influenza vaccination ranged from 87.8% (CI = 78.0%--97.7%) in Sarpy County, Nevada, to 50.1% (CI = 40.8%--59.5%) in Miami-Dade County, Florida (median: 70.3%) (Table 34). In 2004, the HP 2010 goal of 90% influenza vaccination for persons aged >65 years was not achieved by any state/territory, MMSA, or county. Pneumococcal Vaccination. The estimated prevalence of adults aged >65 years who ever had a pneumococcal vaccination ranged from 71.6% (CI = 68.2%--75.0%) in Montana to 32.7% (CI = 28.9%--36.5%) in Puerto Rico (median: 64.6%) (Table 35). Among selected MMSAs, the prevalence ranged from 79.9% (CI = 71.9%--87.8%) in Billings, Montana, to 52.0% (CI = 42.0%--61.9%) in Memphis, Tennessee-Mississippi-Arkansas (median: 65.4%) (Table 36). For selected counties, the estimated prevalence for ever receiving a pneumococcal vaccination ranged from 83.5% (CI = 76.2%--90.9%) in Yellowstone County, Montana, to 34.9% (CI = 25.0%--44.8%) in Hudson County, New Jersey (median: 67.1%) (Table 37). The HP 2010 goal of 90% pneumococcal vaccination for persons aged >65 years was not achieved by any state/territory, MMSA, or county. Oral Health. In 2004, among states/territories, the estimated prevalence of adults aged >65 years who had all their natural teeth extracted ranged from 42.9% (CI = 39.2%--46.6%) in West Virginia to 12.4% (CI = 10.4%--14.4%) in Connecticut (median: 21.2%) (Table 38). For selected MMSAs, the estimated prevalence ranged from 45.1% (CI = 36.5%--53.8%) in Charleston, West Virginia, to 5.2% (CI = 1.7%--8.7%) in Bethesda-Frederick-Gaithersburg, Maryland (median: 18.9%) (Table 39). Among selected counties, the estimated prevalence of adults aged >65 years who had all natural teeth extracted ranged from 34.6% (CI = 25.2%--44.0%) in Kanawha County, West Virginia, to 6.1% (CI = 2.5%--9.6%) in Monmouth County, New Jersey (median: 17.6%) (Table 40). The HP 2010 target to reduce the proportion of older adults who have had all their natural teeth extracted is 20%. In 2004, a total of 23 states, 68 MMSAs, and 97 counties achieved the target. Dentists, dental specialists such as orthodontists, or health professionals employed by dental clinics are considered to be dental health-care professionals. The estimated prevalence of adults who had visited a dental health-care professional within the preceding year ranged from 80.6% (CI = 79.4%--81.9%) in Connecticut to 59.4% (CI = 57.8%--61.0%) in Mississippi (median: 70.2%) (Table 41). Among MMSAs, the estimated prevalence ranged from 84.2% (CI = 80.9%--87.6%) in Concord, New Hampshire, to 58.9% (CI = 54.1%--63.7%) in El Paso, Texas (median: 72.6%) (Table 42); among selected counties, respondents who had visited a dental health-care professional ranged from 88.1% (CI = 83.4%--92.8%) in Dakota County, Minnesota, to 58.9% (CI = 54.1%--63.7%) in El Paso County, Texas (median: 73.6%) (Table 43). Colorectal Cancer Screening. The estimated prevalence of adults aged >50 years who ever had a sigmoidoscopy or colonoscopy ranged from 66.3% (CI = 64.1%--68.4%) in Minnesota to 33.6% (CI = 31.1%--36.1%) in Puerto Rico (median: 53.0%) (Table 44). Among selected MMSAs, the estimated prevalence of sigmoidoscopy or colonoscopy ranged from 70.2% (CI = 67.4%--73.1%) in Minneapolis-St.Paul-Bloomington, Minnesota-Wisconsin, to 43.7% (CI = 36.0%--51.4%) in Huntington-Ashland, West Virginia-Kentucky-Ohio (median: 55.8%) (Table 45); among selected counties, prevalence estimates ranged from 74.5% (CI = 66.8%--82.2%) in Dakota County, Minnesota, to 38.0% (CI = 28.0%--48.0%) in Adams County, Colorado (median: 57.4%) (Table 46). The HP 2010 objective for adults aged >50 years who have ever received a sigmoidoscopy is 50%. Data from BRFSS included prevalence estimates for both sigmoidoscopy and colonoscopy combined. In 2004, a total of 37 states, 110 MMSAs, and 153 counties achieved the target of 50% for ever having a sigmoidoscopy or colonoscopy. Prevalence estimates for adults aged >50 years who had a blood stool test within the preceding 2 years ranged from 40.3% (CI = 38.9%--41.7%) in North Carolina to 3.5% (CI = 2.6%--4.5%) in Puerto Rico (median: 26.5%) (Table 47). The estimated prevalence among selected MMSAs ranged from 49.4% (CI = 44.0%--54.8%) in Durham, North Carolina, to 13.9% (CI = 9.5%--18.2%) in Las Cruces, New Mexico (median: 28.4%) (Table 48). Among selected counties, the estimated prevalence of adults aged >50 years who had a blood stool test ranged from 51.8% (CI = 43.0%--60.6%) in Durham County, North Carolina, to 13.9% (CI = 9.5%--18.2%) in Dona Ana County, New Mexico (median: 29.6%) (Table 49). In 2004, the HP 2010 target of 50% for adults aged >50 years who had a blood stool test within the preceding 2 years was achieved by four counties. Women's Health Screenings. For women aged >18 years who had a Pap test within the preceding 3 years, the prevalence estimates ranged from 89.8% (CI = 88.2%--91.3%) in New Hampshire to 72.5% (CI = 69.8%--75.1%) in Puerto Rico (median: 85.9%) (Table 50). Among selected MMSAs, the prevalence ranged from 92.7% (CI = 89.9%--95.6%) in Essex County, Massachusetts, to 79.5% (CI = 72.3%--86.7%) in Lewiston, Idaho-Washington (median: 87.1%) (Table 51). Among selected counties, the prevalence estimates for women aged >18 years who had a Pap test within the preceding 3 years ranged from 94.2% (CI = 90.7%--97.7%) in Ramsey County, Minnesota, to 78.0% (CI = 68.4%--87.6%) in Nez Perce County, Idaho (median: 87.3%) (Table 52). In 2004, a total of 24 MMSAs and 49 counties achieved the HP 2010 objective of 90% for women aged >18 years who had a Pap test within the preceding 3 years. In 2004, state-specific prevalence estimates for women aged >40 years who had a mammogram within the preceding 2 years ranged from 82.5% (CI = 80.8%--84.2%) in Massachusetts to 61.1% (CI = 57.6%--64.6%) in the U.S. Virgin Islands (median: 74.6%) (Table 53). Among selected MMSAs, the estimated prevalence ranged from 86.1% (CI = 81.8%--90.4%) in Essex County, Massachusetts, to 61.8% (CI = 54.0%--69.6%) in Provo-Orem, Utah (median: 75.8%) (Table 54); among counties, the estimated prevalence ranged from 86.8% (CI = 81.6%--91.9%) in Oakland County, Michigan, to 62.0% (CI = 54.1%--69.9%) in Utah County, Utah (median: 76.3%) (Table 55). The HP 2010 objective for women aged >40 years who had received a mammogram within the preceding 2 years is 70%. In 2004, a total of 39 states/territories, 112 MMSAs, and 168 counties achieved the objective. Prostate Cancer Screening. The PSA test measures the level of prostate-specific antigen in the blood. As a rule, the higher the PSA level in the blood, the more likely a prostate problem is present. Although the PSA test is not a definitive test for prostate cancer, elevated levels suggest the need for further tests to determine if prostate cancer is present. In 2004, the estimated prevalence of men aged >40 years who had a PSA test during the preceding 2 years ranged from 60.9% (CI = 57.1%--64.7%) in Puerto Rico to 44.5% (CI = 41.0%--48.0%) in Maine (median: 52.1%) (Table 56). Among MMSAs, the prevalence ranged from 65.1% (CI = 56.8%--73.3%) in Billings, Montana, to 34.7% (CI = 25.8%--43.5%) in Austin-Round Rock, Texas (median: 51.7%) (Table 57); among selected counties, the estimated prevalence ranged from 65.2% (CI = 56.5%--73.8%) in Yellowstone County, Montana, to 37.8% (CI = 29.0%--46.5%) in Ramsey County, Minnesota (median: 51.7%) (Table 58). DiscussionThe findings in this report indicate variations in the estimated prevalence of selected health risk behaviors, chronic disease indicators, and preventive screening practices among U.S. adults at the state, MMSA, and county levels. State-specific BRFSS estimates can be used by policymakers, public health officials, and community activists to identify local health requirements and assist in planning, directing, implementing, and monitoring the effectiveness of intervention and prevention strategies while concentrating on areas within states exhibiting the most deficiency. When analyzing data presented in this report, other factors must be considered. Variations in state-specific estimates might indicate differences in demographic and socioeconomic indicators, access to health services, state laws and local ordinances, use of preventive screenings, and subsequent reimbursement by insurance providers for preventive health screenings. The HP 2010 objective for health insurance coverage is 100%. In addition, the Institute of Medicine also recommended 100% health-care coverage in their 2004 report, "Insuring America's Health: Principles and Recommendations" (15). In 2004, no state/territory, MMSA, or county achieved the HP 2010 goal of 100% health insurance coverage. Self-reported health status is a multi-dimensional concept that includes physical health problems, functional capacities, health behaviors, and psychological aspects (16,17). Poor self-assessed health increases the mortality risk, even after controlling for more objective indicators of health status (18,19). In 2004, the proportion of adults who reported fair or poor health varied across states, MMSAs, and counties, from 34.8% in Puerto Rico to 5.7% in El Paso, Texas. These large variations suggest differences in the underlying aspects of the measure, which might reflect differences in prevalence and severity of health problems, lack of or inadequate medical care, or difficulty accessing treatment for underlying conditions. Regular physical activity has numerous health benefits. In addition to reducing the risk for major chronic diseases (e.g., coronary heart disease, colon cancer, diabetes, and hypertension), regular physical activity also can help to control weight, relieve pain from arthritis, and reduce symptoms associated with anxiety and depression (1). Despite these proven benefits of regular physical activity, only 13 states/territories, 47 MMSAs, and 74 counties achieved the HP 2010 objective to reduce the proportion of adults who engage in no leisure-time physical activity to 20%. Since the release of the first Surgeon General's Report in 1964 on cigarette smoking, the public health community has acknowledged the adverse health consequences of smoking (20). In the 42 years since the release of that report, cigarette smoking has been recognized as the single most preventable cause of morbidity and mortality in the United States (2); scientific knowledge of the health hazards of smoking and the benefits of quitting have been documented, and nearly half of all living adults who ever smoked have quit. Despite these accomplishments, smoking rates remain high in the majority of states/territories, MMSAs, and counties. Overall, the HP 2010 goal of <12% for current cigarette smoking was achieved by two states/territories, four MMSAs, and six counties. Continued high smoking prevalence is indicative of the need for continuing and expanding prevention efforts. Excessive drinking, including binge and heavy drinking, can result in chronic diseases such as liver cirrhosis, pancreatitis, high blood pressure, and various cancers (3). Excess alcohol consumption also has been linked to acute health consequences such as motor-vehicle injuries, falls, domestic violence, rape, and child abuse (3,21). A national health objective for 2010 is to reduce the prevalence of binge drinking to 6%; however, in 2004, only one MMSA and one county achieved this goal, highlighting the need for continued alcohol-related prevention strategies. The increase in overweight and obesity among adults continues to be a national health concern, because overweight and obesity increase the risk for various chronic diseases such as hypertension, dyslipidemia, heart disease, stroke, diabetes, arthritis-related disabilities, and certain cancers (4). Although one of the HP 2010 objectives is to reduce the prevalence of obesity among adults to <15%, data for 2004 indicate that only one MMSA and eight counties achieved this goal. Asthma is a prevalent chronic illness of the lungs that disproportionately affects inner-city residents, minorities, and the poor (22). The effect of asthma is demonstrated in the loss of workdays, activity limitations, increased hospitalizations, and increased asthma-associated outpatient and emergency department visits (23). In 2004, BRFSS data indicated variability in asthma prevalence by state/territory, MMSA, and county. Diabetes, a disease in which blood glucose levels are above normal, can result in heart disease, blindness, kidney failure, and lower-extremity amputations (24). The serious health implications of diabetes necessitate that the prevalence of this disease, along with the prevalence of associated health risk behaviors such as lack of physical activity and obesity, be monitored continuously. Although BRFSS does not distinguish between the different types of diabetes, it does indicate that the overall prevalence of diabetes was as high as 12.2% at the MMSA level and 12.5% at the county level in 2004. Influenza and pneumonia continue to be leading causes of morbidity and mortality among persons aged >65 years (25). However, influenza and pneumococcal inoculation have been shown to substantially decrease the effect of these diseases on this target population (26). The HP 2010 objective for influenza and pneumonia vaccination among this age group is 90%. In 2004, no state/territory, MMSA, or county achieved the objective of 90% for influenza vaccination. In addition, no state/territory, MMSA, or county achieved the HP 2010 target of 90% for persons aged >65 years who ever had received a pneumococcal vaccination. For several decades, the percentage of older adults who have retained their natural teeth has increased, and the trend is expected to continue. With the retention of natural teeth, the overall oral functioning and quality of life of older adults will improve (27). In 2004, a total of 23 states/territories achieved the HP 2010 objective of <20% of adults aged 65--74 years having lost or had all of their natural teeth extracted. Cancer is the second leading cause of mortality in the United States, and colorectal cancer is the second leading cause of cancer-related deaths. Colorectal cancer is the third most common form of cancer diagnosed in men and women, resulting in approximately 100,000 U.S. residents diagnosed each year (28,29). To reduce mortality from colorectal cancer, early detection of precancerous polyps or abnormal cell growth must be detected (30). Two screenings are recommended: sigmoidoscopy/colonoscopy and blood stool test. In 2004, respondents aged >50 years were asked if they had a sigmoidoscopy or colonoscopy and blood stool test within the preceding 2 years. The HP 2010 objective for persons aged >50 years who had ever received a sigmoidoscopy was 50%. Thirty-eight states/territories, 110 MMSAs, and 154 counties achieved the 50% goal for sigmoidoscopy. The HP 2010 objective for persons aged >50 years who had a blood stool test within the preceding 2 years was 50%. In 2004, only four counties achieved the HP 2010 objective. No state/territory or MMSA achieved the 50% objective. Although cervical cancer was once the leading cause of mortality among women in the United States, incidence and mortality have declined because of widespread use of the Pap test. The Pap test can detect abnormalities in cells and precancerous lesions in the cervix at an early stage when it is most curable or preventable (31). The HP 2010 objective of 90% Pap test screening for women aged >18 years was achieved by 24 MMSAs and 49 counties. No state/territory achieved the 90% objective. In the United States, breast cancer is the second most often diagnosed cancer among women. Breast cancer is second only to lung cancer as the primary cause of mortality among women (32). Mammography is presently the best available method of screening for breast cancer. Early detection can substantially reduce mortality from breast cancer. Screening among women aged >50 years can reduce mortality by approximately 20%--30% compared with women who are not screened (33). The HP 2010 objective for women aged >40 years who had received a mammogram during the preceding 2 years is 70%. Thirty-nine states/territories, 112 MMSAs, and 168 counties achieved the 70% objective. In the United States, prostate cancer is the second leading cause of mortality among men and the most common form of cancer among men. In addition, prostate cancer the sixth leading overall cause of death for men (34). In 2004, approximately 230,110 new cases of prostate cancer were diagnosed; an estimated 29,900 men might die from the disease (35). Although evidence suggests that PSA screening is helpful in detecting early-stage prostate cancer, inconclusive evidence exist whether early detection of prostate cancer improves health outcomes compared with possible harms related to prostate cancer screening process (35--37). No target guidelines have been established by HP 2010 for prostate cancer screening. However, CDC acknowledges the need for an informed decision regarding prostate cancer screening and potential risks. CDC has developed "Prostate Cancer Screening: A Decision Guide," an informational brochure that helps men make an informed decision regarding the screening (38). The findings in this report are subject to at least two limitations. First, BRFSS is a telephone-based survey, which only queries persons with telephone access. Differences might exist in the characteristics of persons who reside in households with telephones compared with those without telephone access. Consequently, these data might not be generalizable to persons who reside in households without telephones. Second, prevalence estimates are self-reported and, for certain behaviors, the reported estimates might be subject to recall bias. Despite these limitations, BRFSS is a cost-effective and timely telephone survey that provides essential information for state and local public health programs and policies designed to decrease overall morbidity and mortality from chronic disease conditions. Furthermore, the reliability and validity of BRFSS data have been assessed and well-documented (10). Overall, these data document high prevalence of health risk behaviors associated with leading causes of morbidity and mortality in the United States. BRFSS is a unique surveillance tool that continues to demonstrate its usefulness at gathering comparable state-specific and local area health behavioral data, monitoring health risk behaviors over time, and supporting focused prevention and intervention programs and policies at the national, state, and local levels. References
2004 Behavioral Risk Factor Surveillance System State and Territory Project Coordinators Alabama, Sondra Reese, MPH; Alaska, Jill Hughes-Richey, PhD; Arizona, Brian Bender, MBA; Arkansas, Neha Thakkar; California, Bonnie Davis, PhD; Colorado, Becky Rosenblatt; Connecticut, Diane Aye, PhD; Delaware, Fred Breukelman; District of Columbia, John Davies-Cole, PhD; Florida, Marie Bailey, MSW; Georgia, Pranesh Chowdhury, MPH; Guam, Cynthia Naval, MS; Idaho, Kathy Simplot-Weygandt; Illinois, Bruce Steiner, MS; Indiana, Linda Stemnock; Iowa, Donald Shepherd, PhD; Kansas, Mona Arnold; Kentucky, Tracey Sparks; Louisiana, Buddy Bates, MSPH; Maine, Phil Haines; Maryland, Helio Lopez; Massachusetts, Zi Zhang, MPH; Michigan, Michele Cook, MPH; Minnesota, Nagi Salem, PhD; Mississippi, Ron McAnally; Missouri, John Hubbs; Montana, Joanne Oreskovich, PhD; Nebraska, Larry Andelt, PhD; Nevada, Wei Yang, PhD; New Hampshire, Andrew Chalsma, HSDM; New Jersey, Kenneth O'Dowd, PhD; New Mexico, Wayne Honey, MPH; New York, Colleen Baker; North Carolina, Ziya Gizlice, PhD; North Dakota, Stephen Pickard, PhD; Ohio, Patricia (Pullen) Coss; Oklahoma, Derek Pate, MPH; Oregon, Kathryn Pickle, MPH; Pennsylvania, Robert Dewar, MS; Puerto Rico, Brenda Santiago; Rhode Island, Jana Hesser, PhD; South Carolina, Beili Dong, MD; South Dakota, Mark Gildemaster; Tennessee, David Ridings; Texas, Jimmy Blanton, MPA; Utah, Kathy Marti; Vermont, Rodney McCormick, PhD; U.S. Virgin Islands, Sharon William, MS; Virginia, Gerges Seifen, MD; Washington, Katrina Wynkoop Simmons, PhD; West Virginia, Fred King; Wisconsin, Anne Ziege, PhD; and Wyoming, Menlo Futa, MA.
2004 Behavioral Risk Factor Surveillance System Team Indu Ahluwalia, PhD; Umed Ajani, MD; Lina Balluz, ScD; William Bartoli, MS; Jody Brown; Julie Brown; Pranesh Chowdhury, MPH; Gloria J. Colclough; Kathy A. Douglas, PhD; Evelyn Dunn; Nicole Flowers, MD; Earl Ford, MD; Kristi Fultz-Butts, MPH; Suzianne Garner, MPA; William S. Garvin, III; David Gilbertz, MSc; Ronald N. Goodson, MSW; Elizabeth Hughes, DrPH; Ruth Jiles, PhD; Georgina Kirunda; Kenneth J. Laliberte, MPA; Michael Link, PhD; Melissa McCracken, MPH; Lisa McGuire, PhD; Ali Mokdad, PhD; Wil Murphy; Margaret Ochner, MPH; Catherine Okoro, MS; Kathryn O'Neill; Henry Roberts, PhD; Ajay Sharma; Herbert Stackhouse, MS; Tara Strine, MPH; Michelle Sussman Walsh, MEd; Horace Thompson; Machell Town, MSc; Justin Vigeant; and Yuna Zhong, MD; Division of Adult and Community Health, National Center for Chronic Disease Prevention and Health Promotion, CDC, Atlanta, Georgia. Table 1 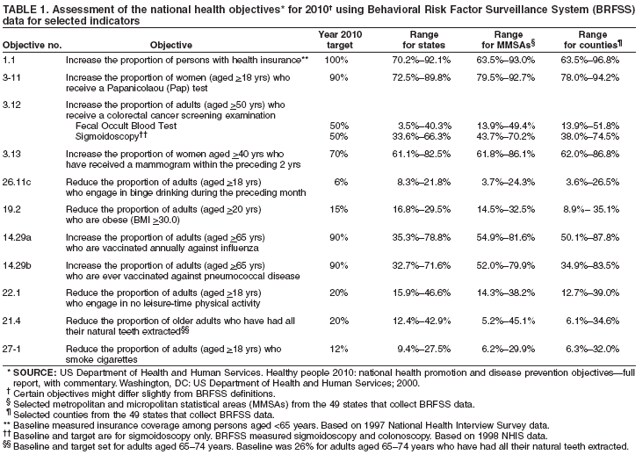 Return to top. Table 2 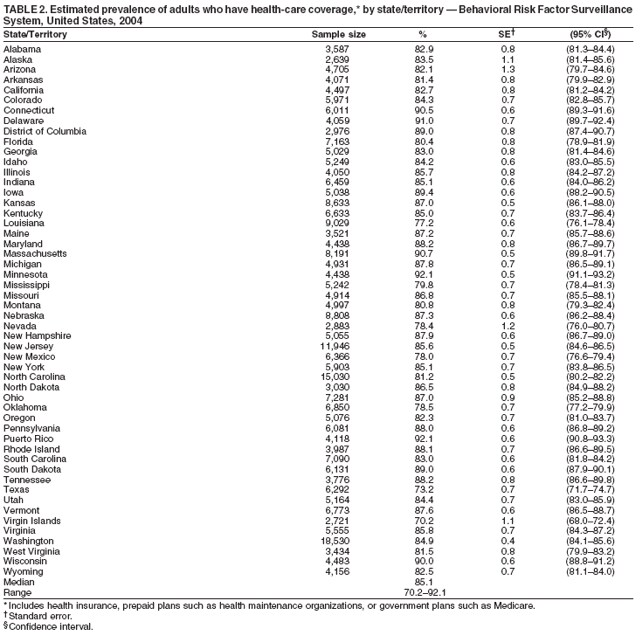 Return to top. Table 3 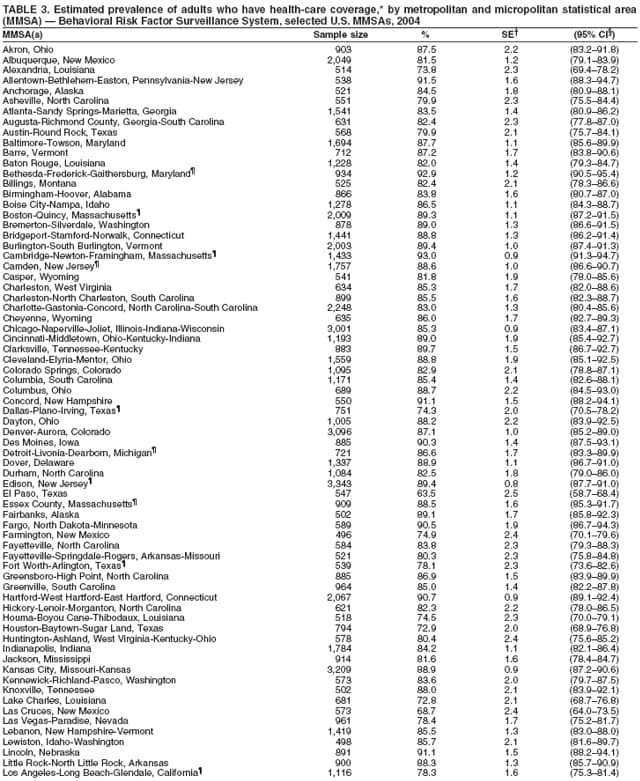 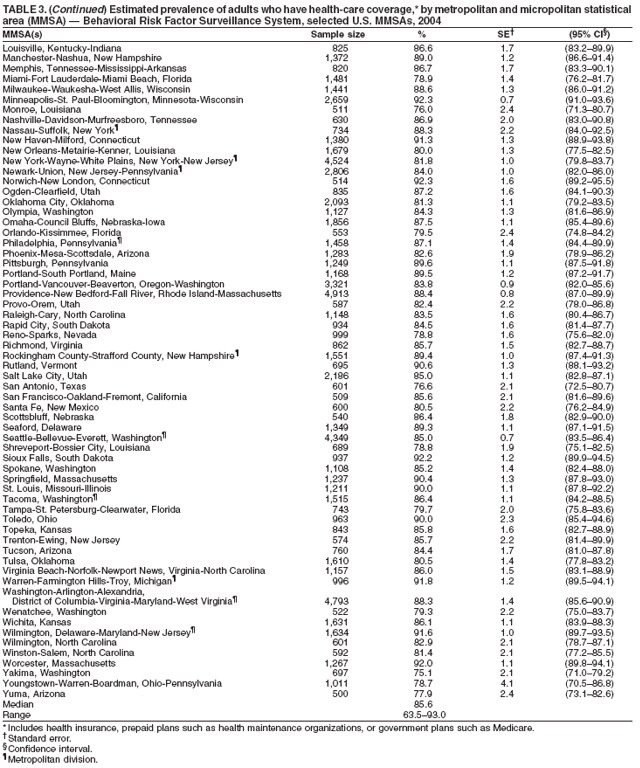 Return to top. Table 4 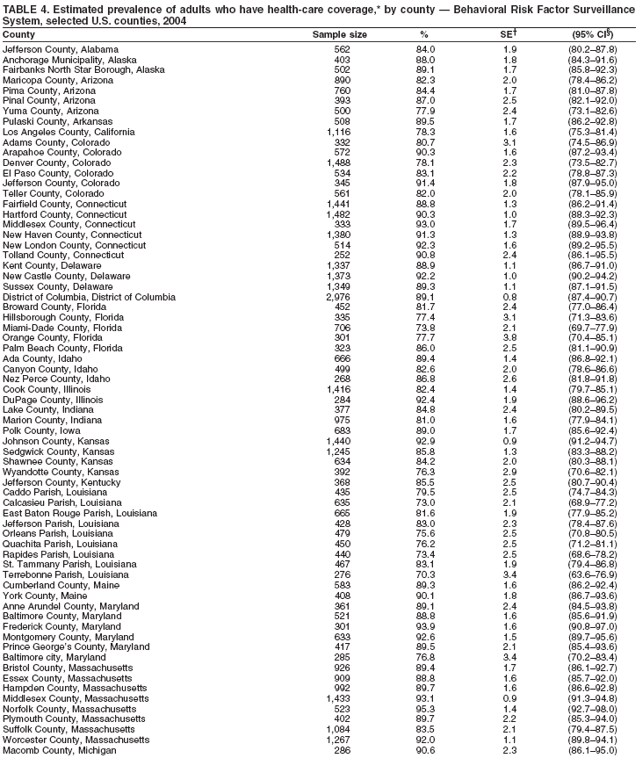  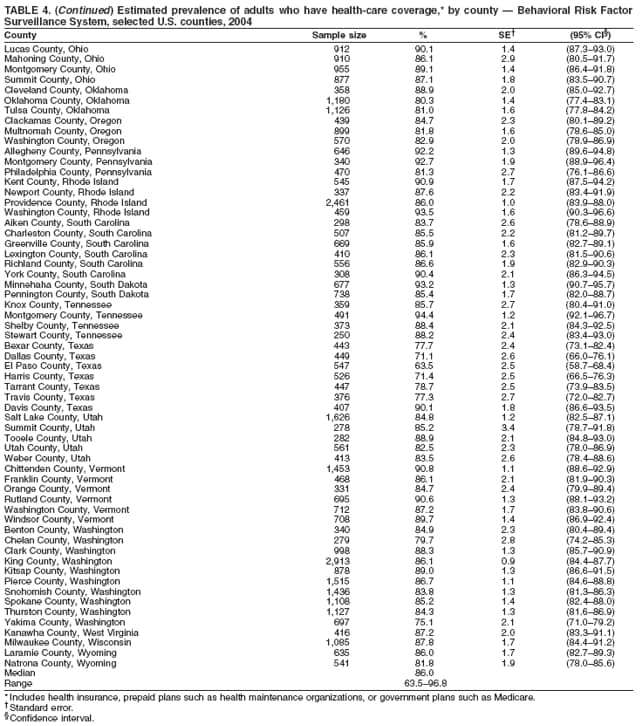 Return to top. Table 5 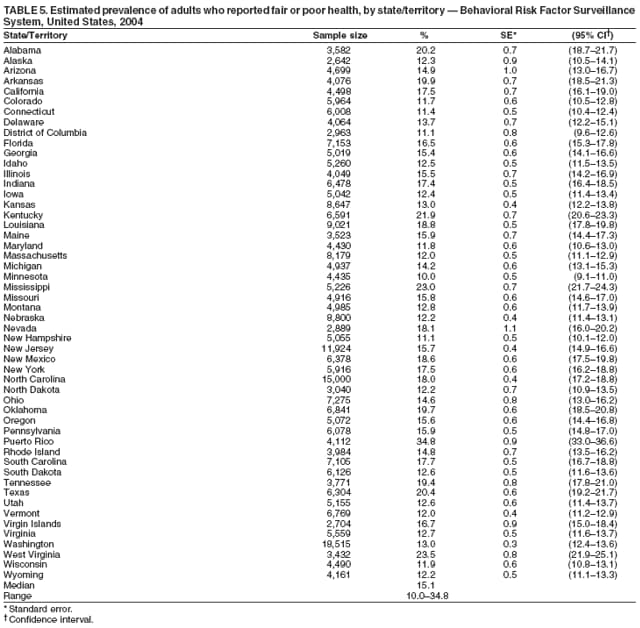 Return to top. Table 6 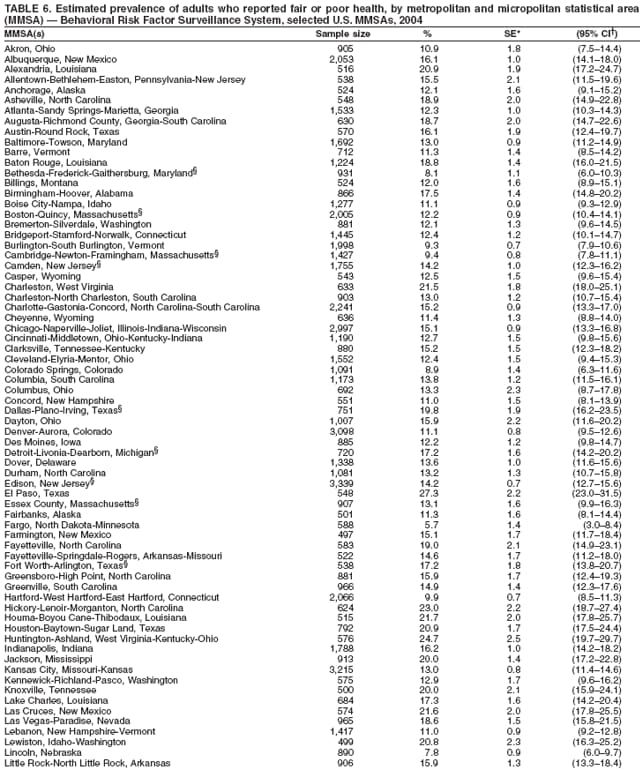  Return to top. Table 7 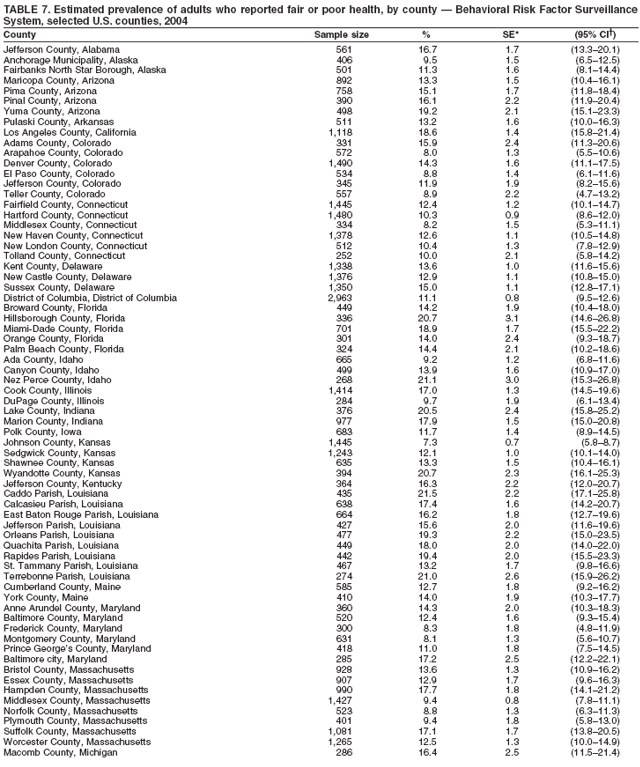  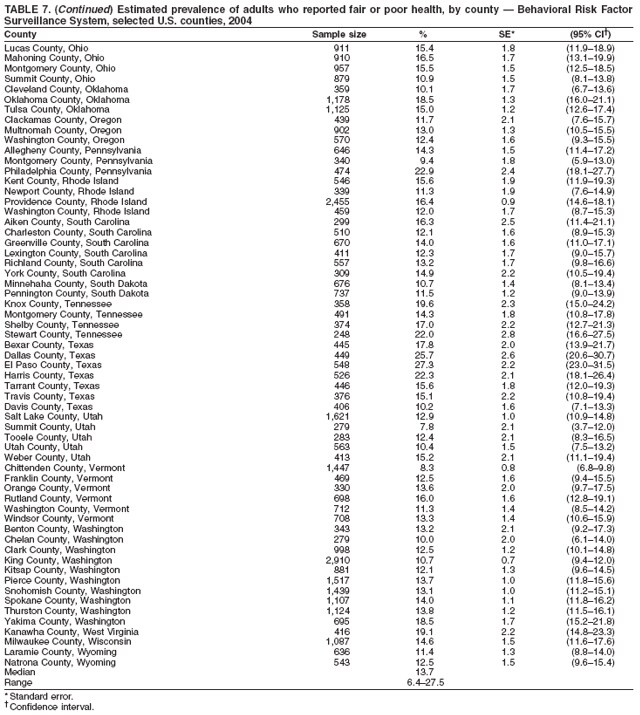 Return to top. Table 8 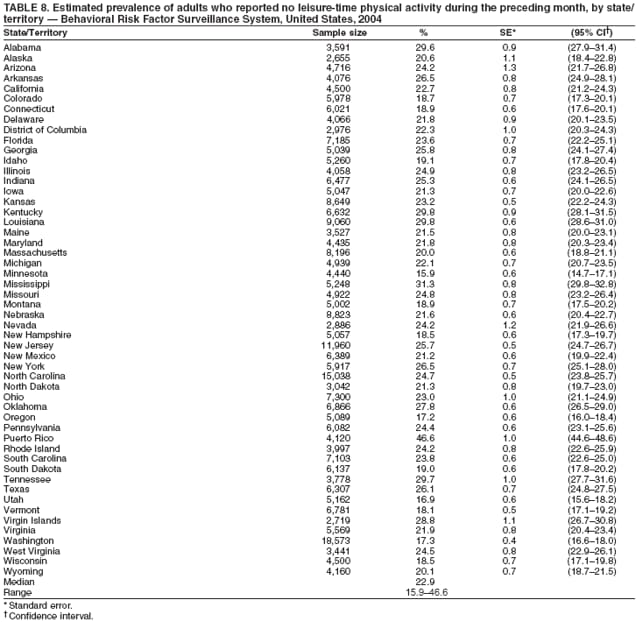 Return to top. Table 9   Return to top. Table 10 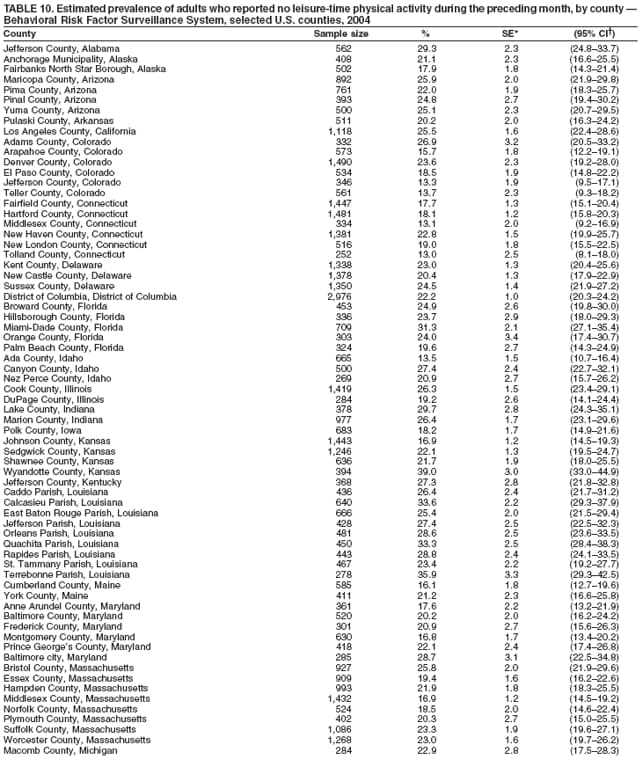  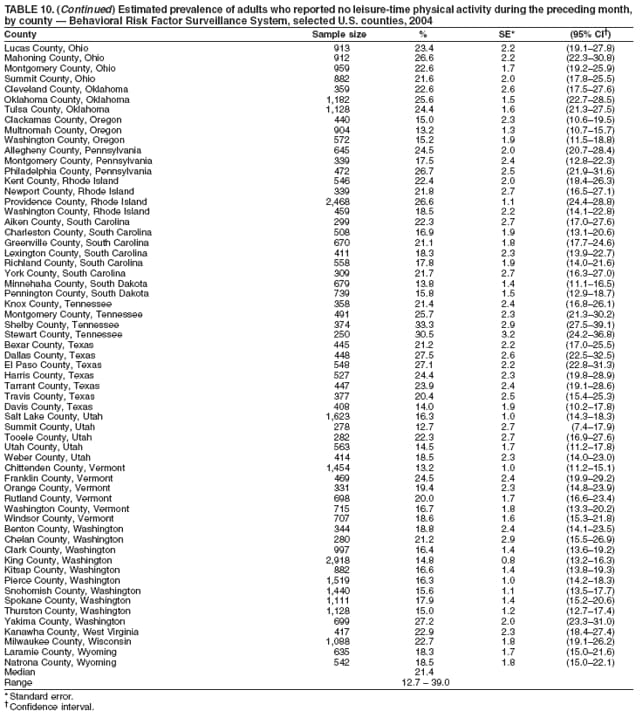 Return to top. Table 11 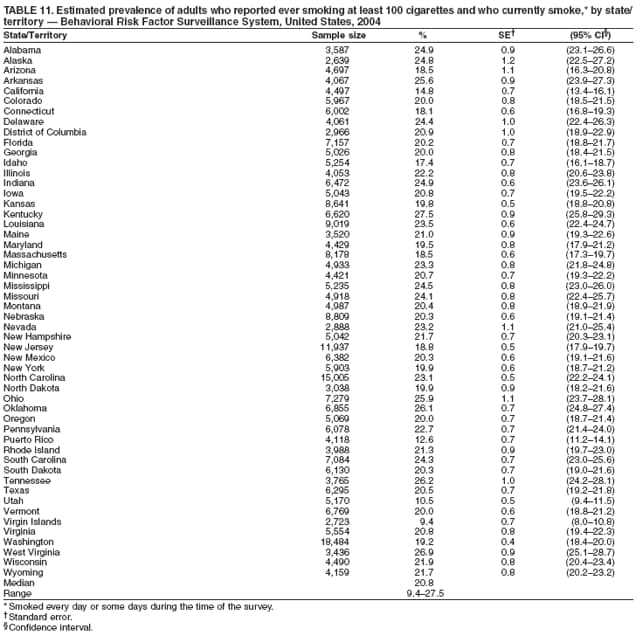 Return to top. Table 12 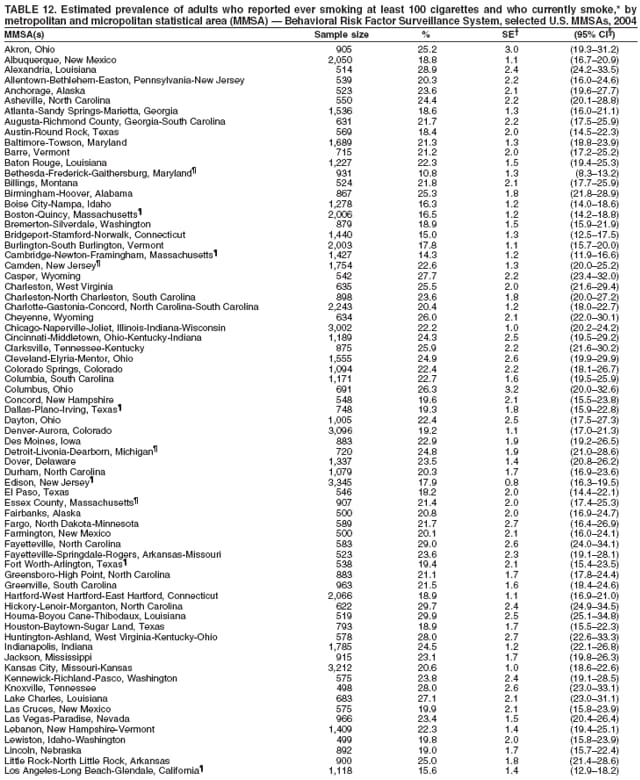 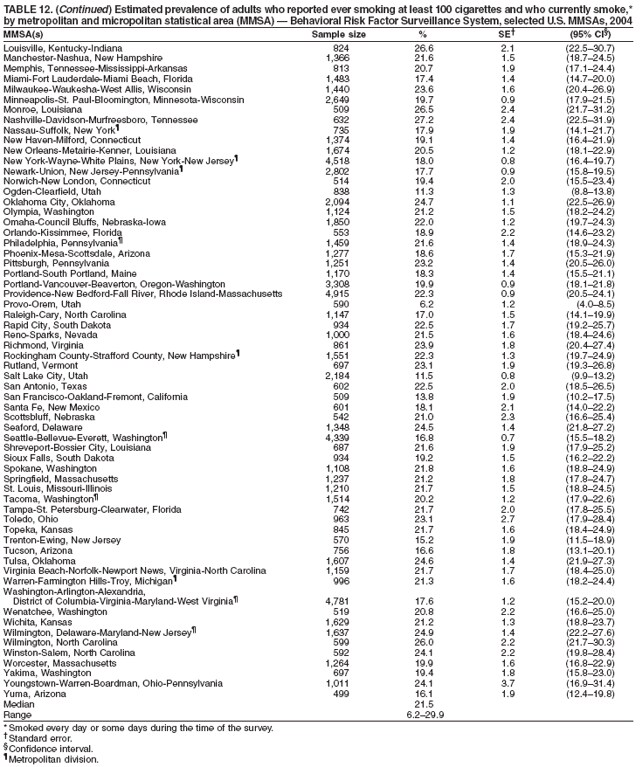 Return to top. Table 13   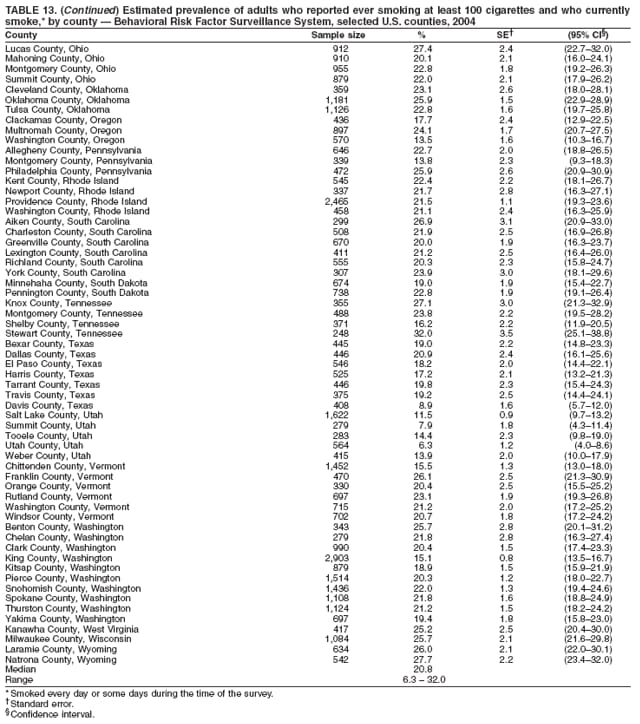 Return to top. Table 14 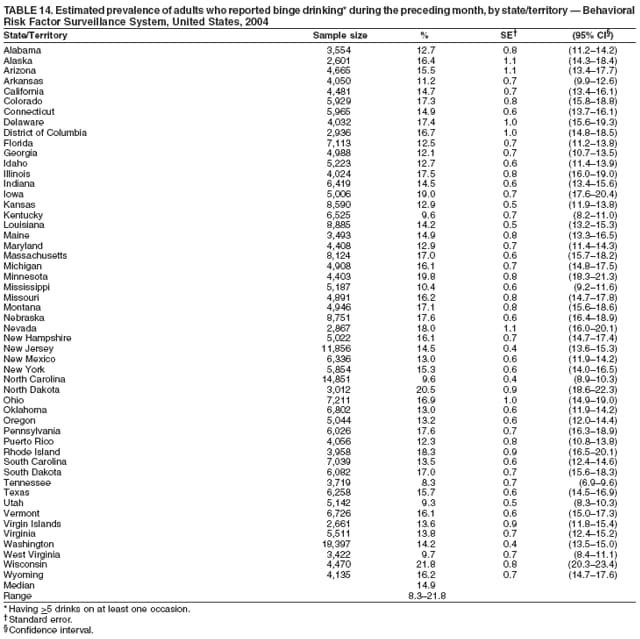 Return to top. Table 15 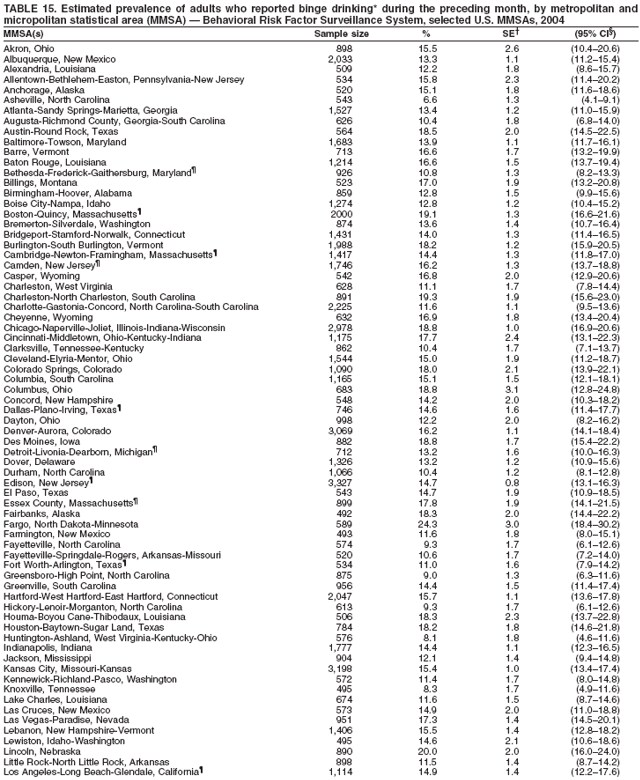 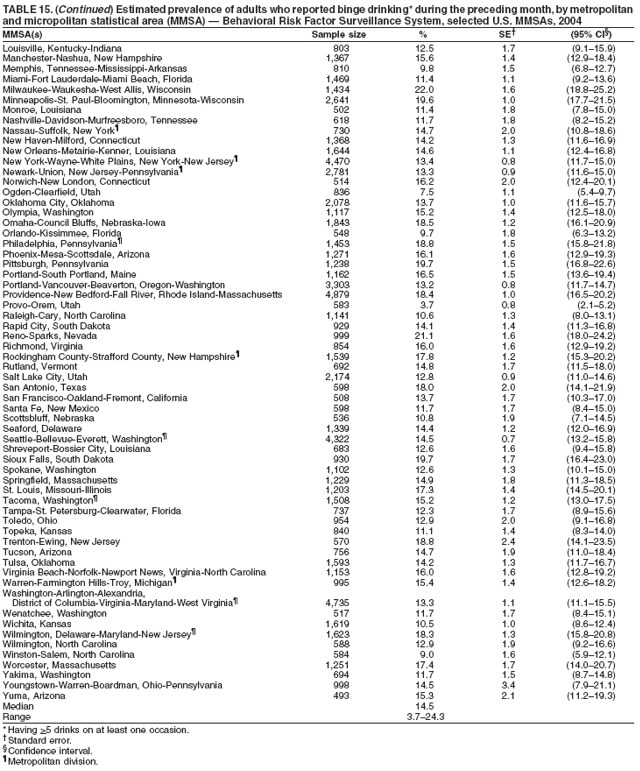 Return to top. Table 16 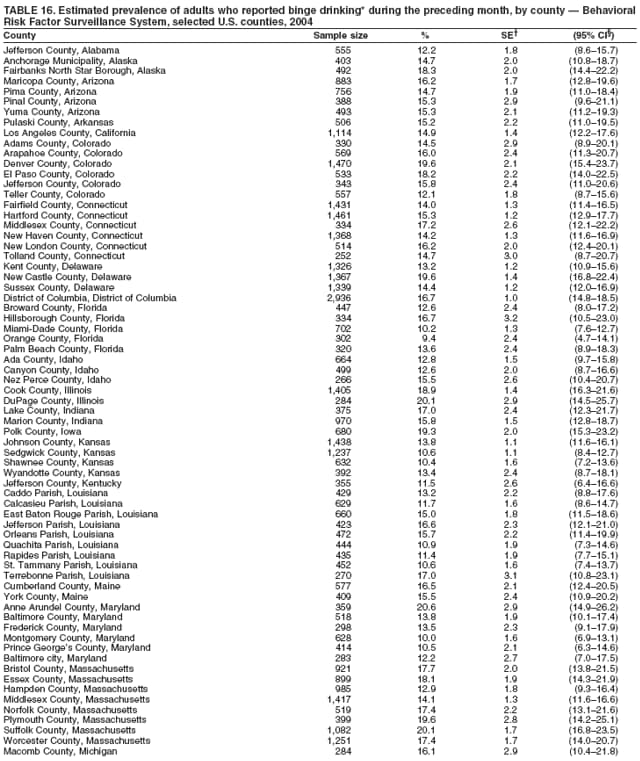 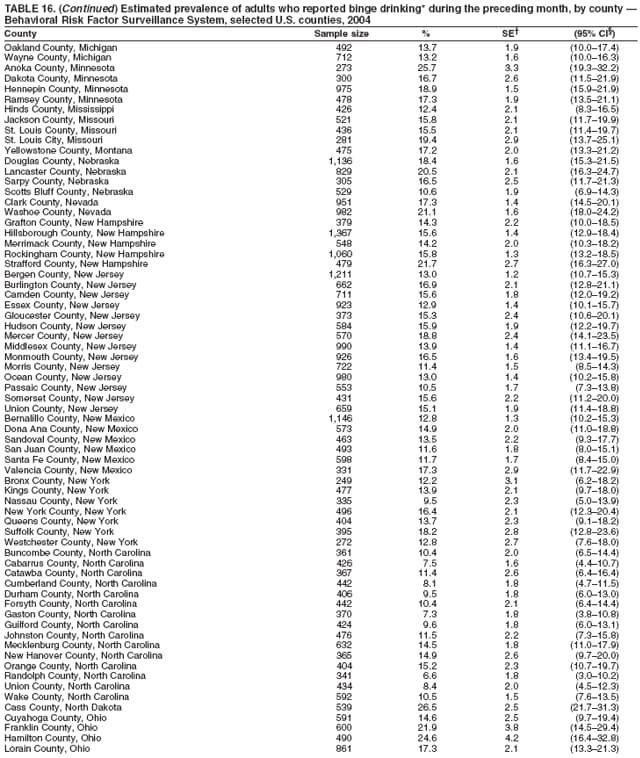 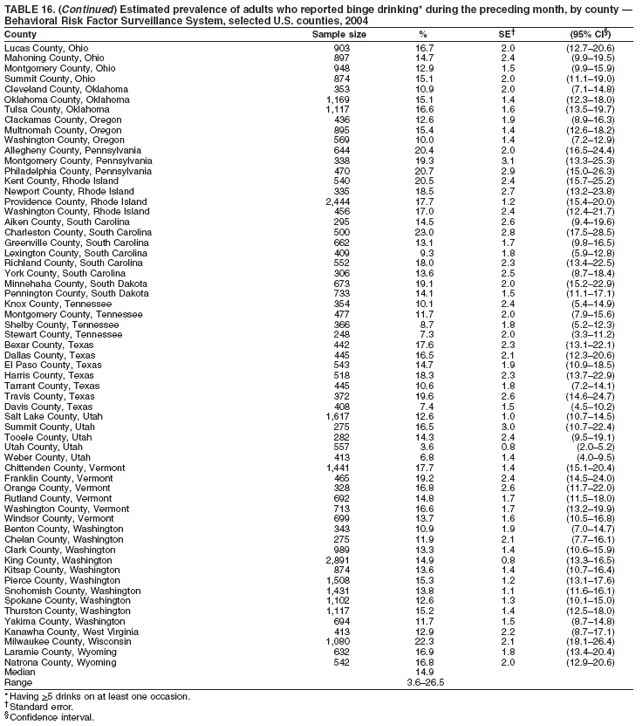 Return to top. Table 17 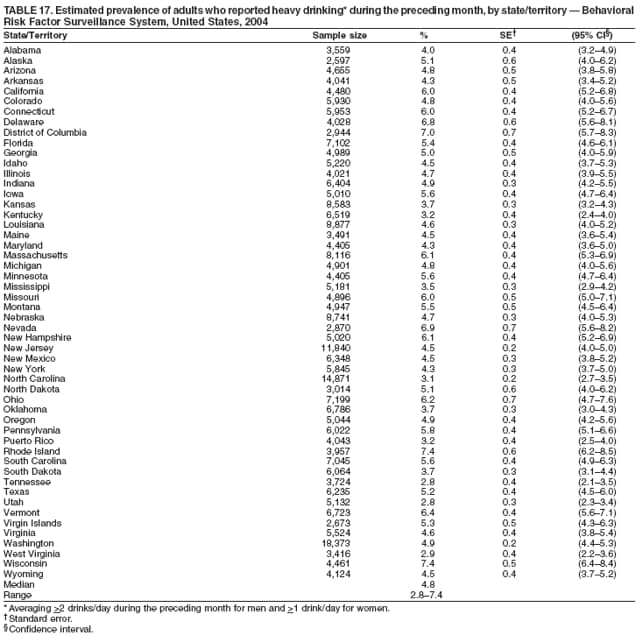 Return to top. Table 18 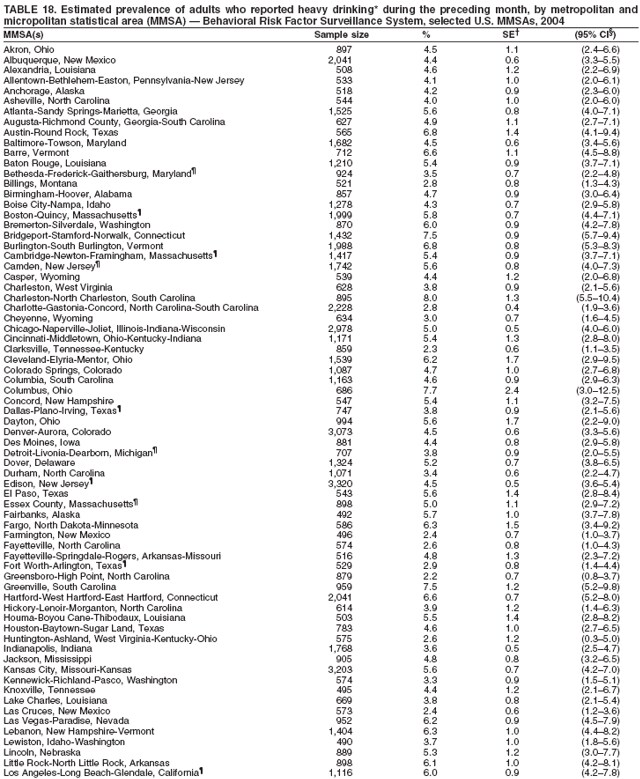 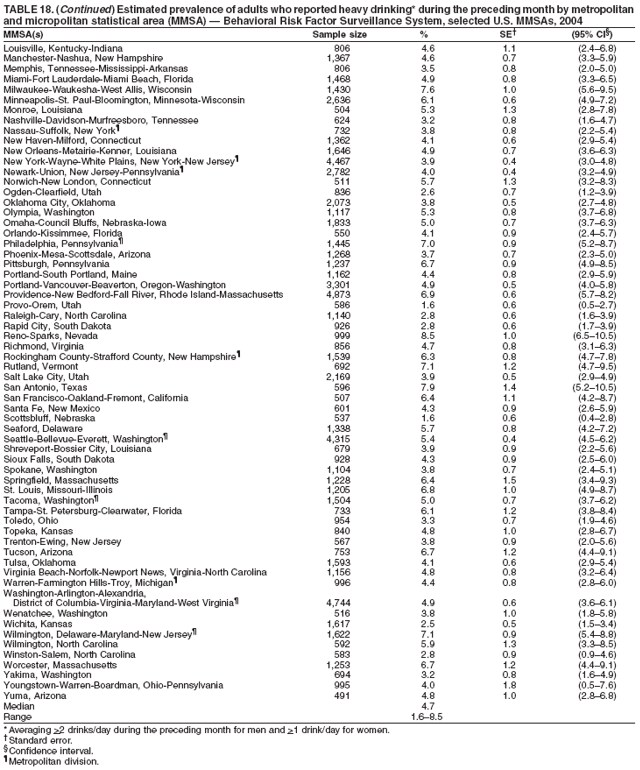 Return to top. Table 19   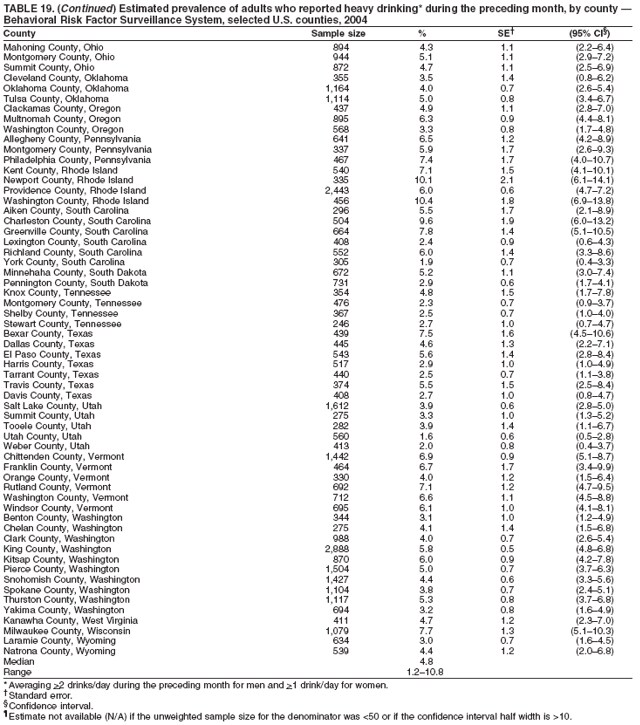 Return to top. Table 20 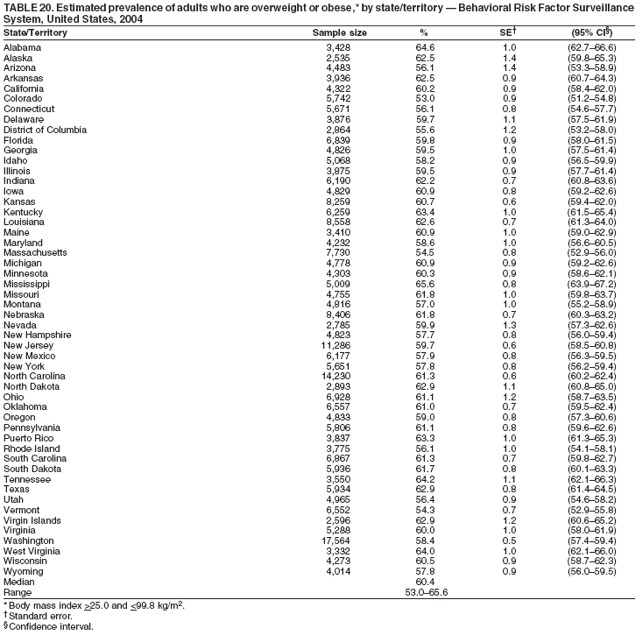 Return to top. Table 21  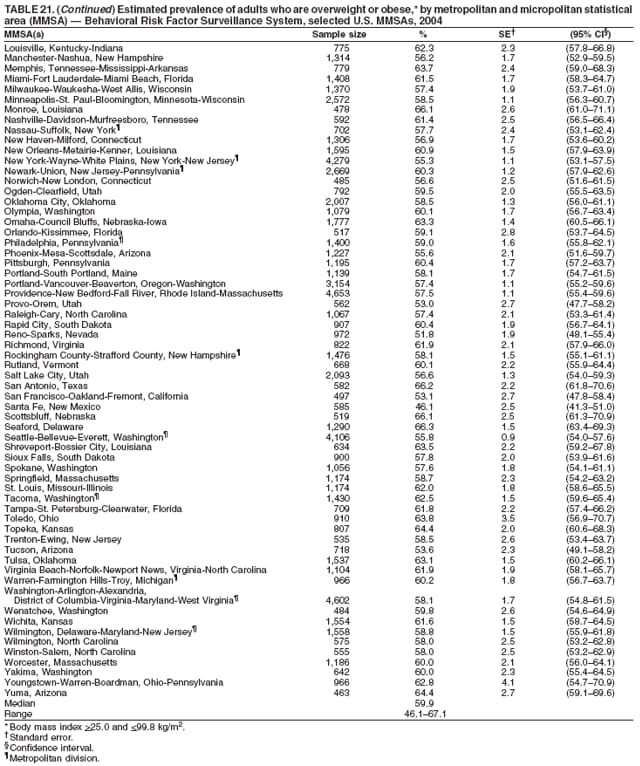 Return to top. Table 22  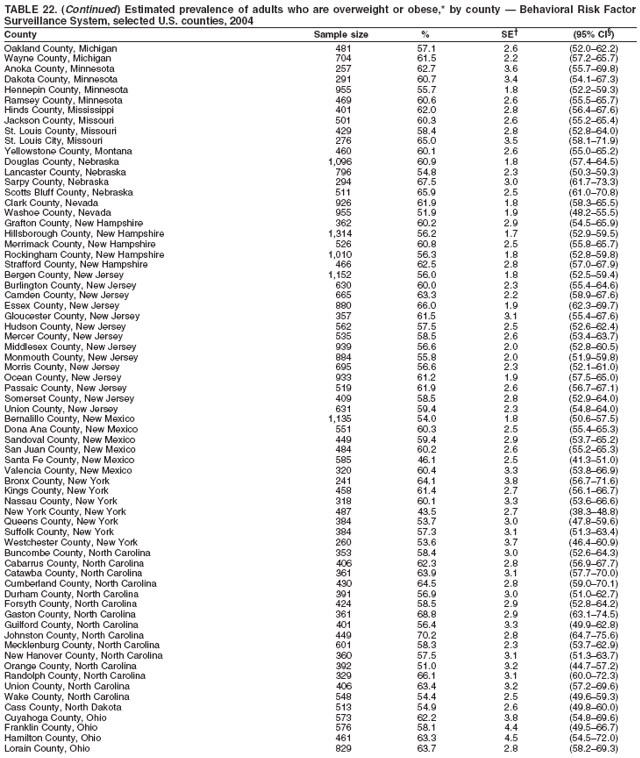 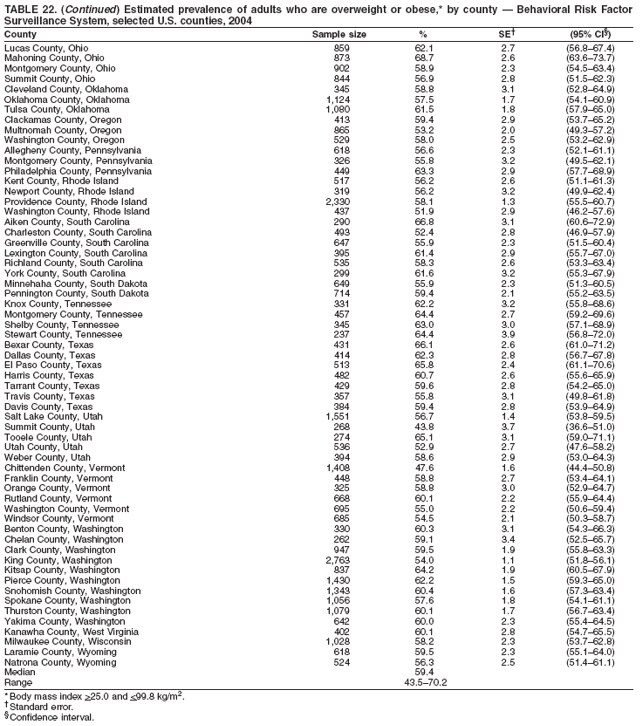 Return to top. Table 23 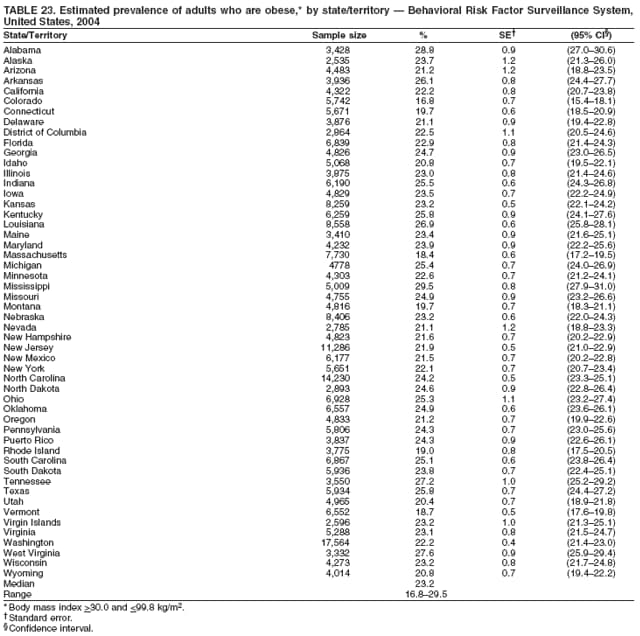 Return to top. Table 24 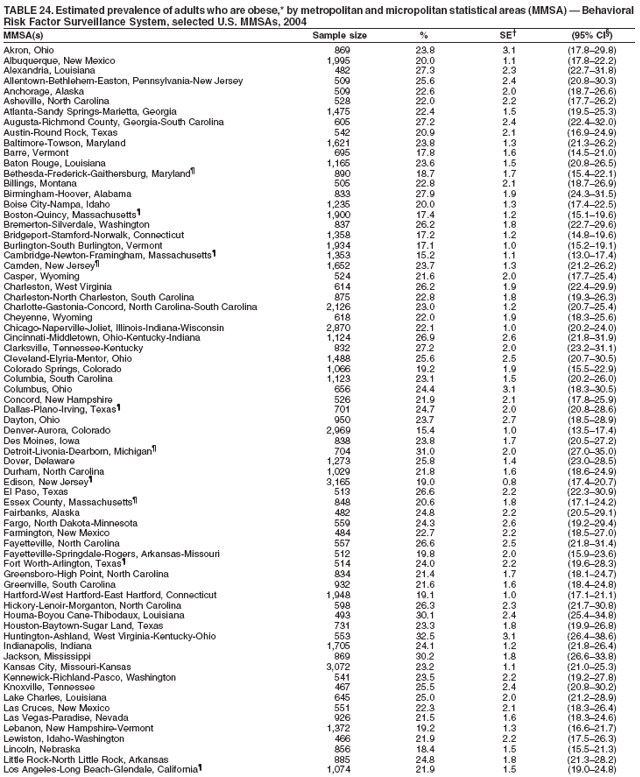 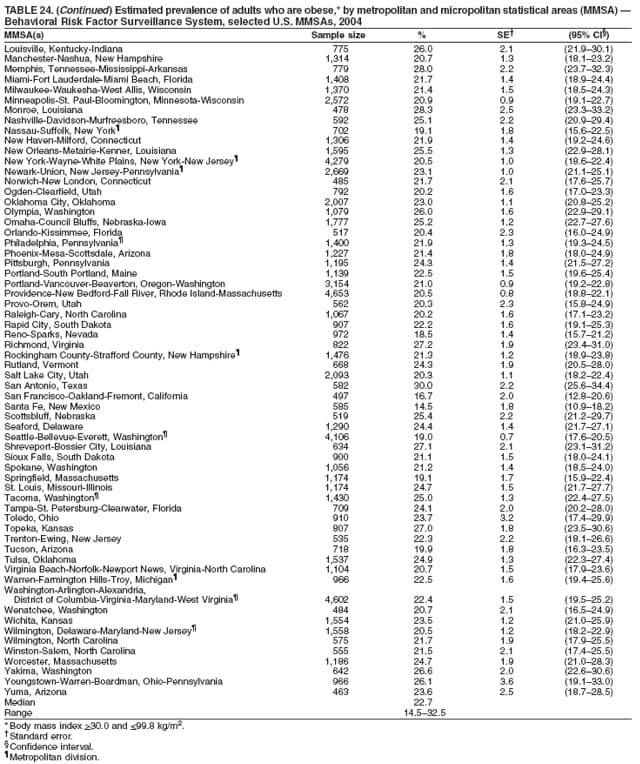 Return to top. Table 25 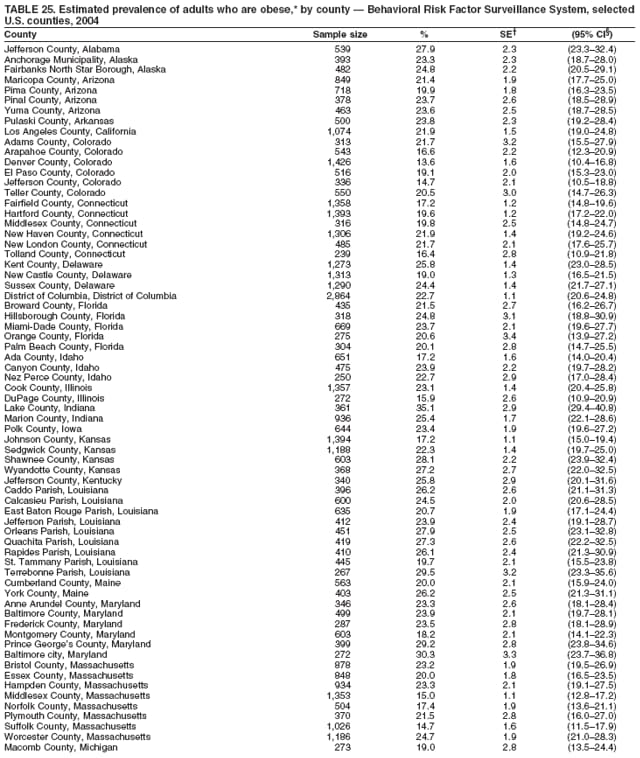 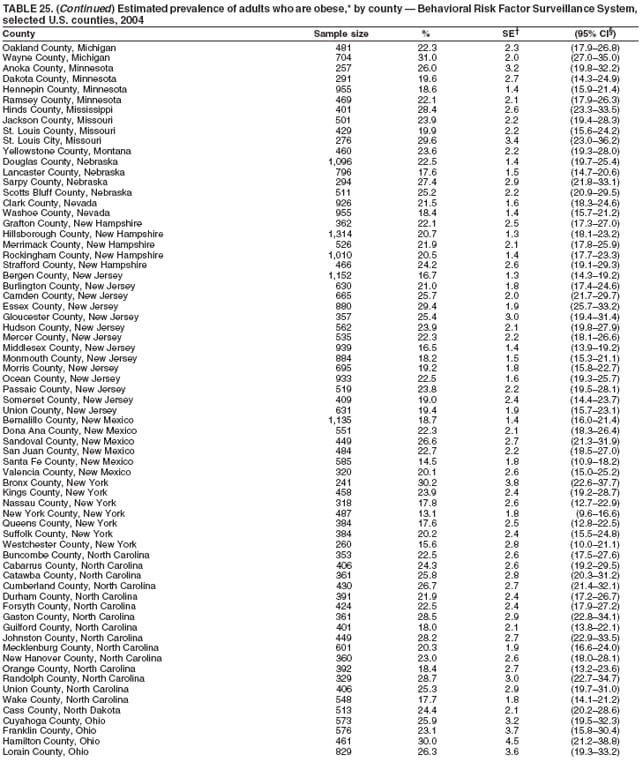 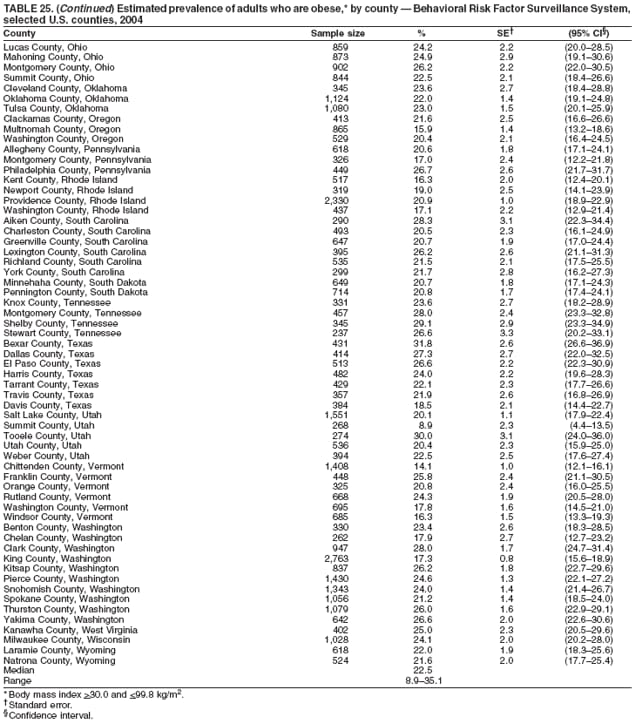 Return to top. Table 26 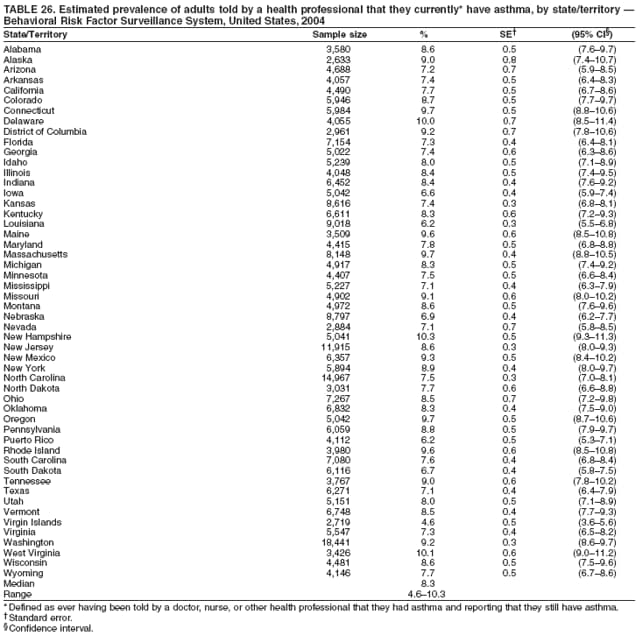 Return to top. Table 27 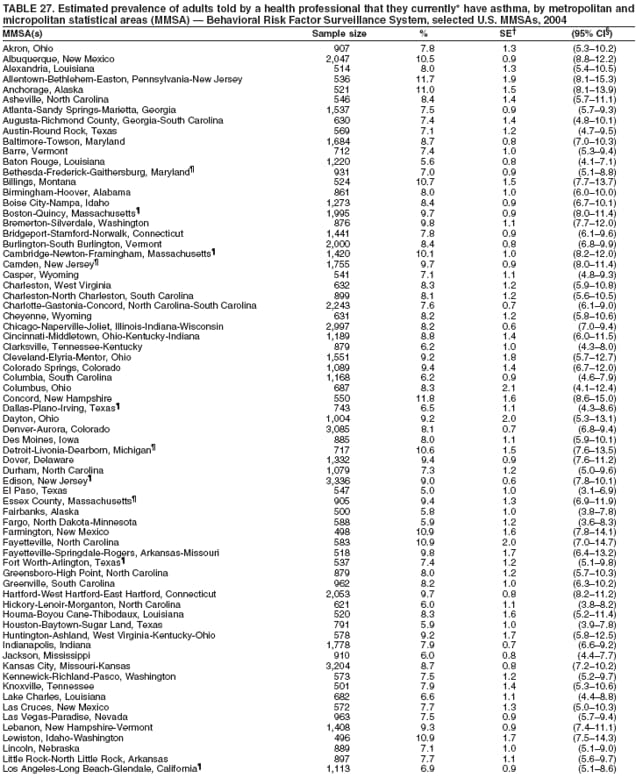 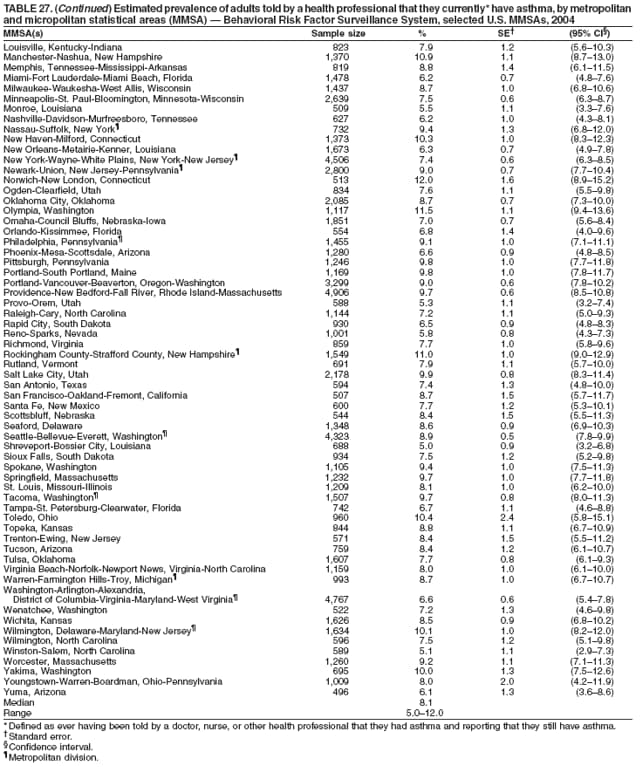 Return to top. Table 28 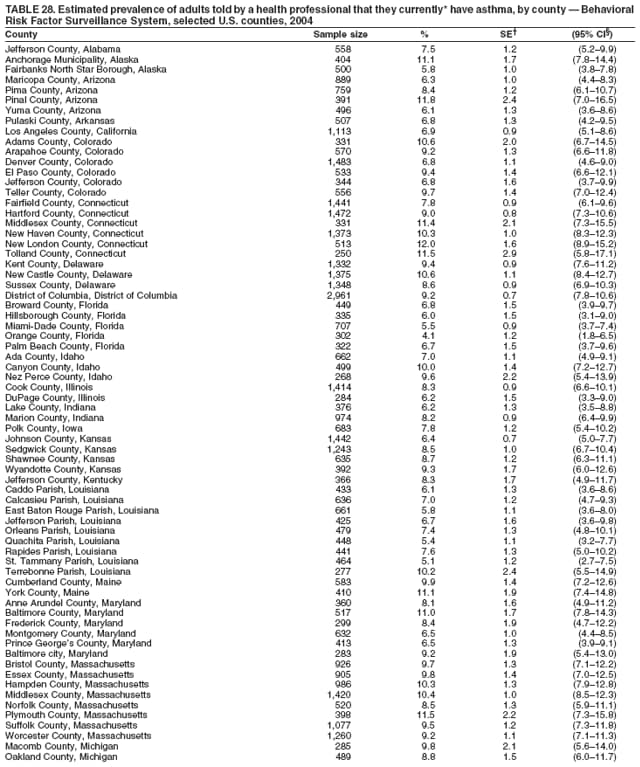 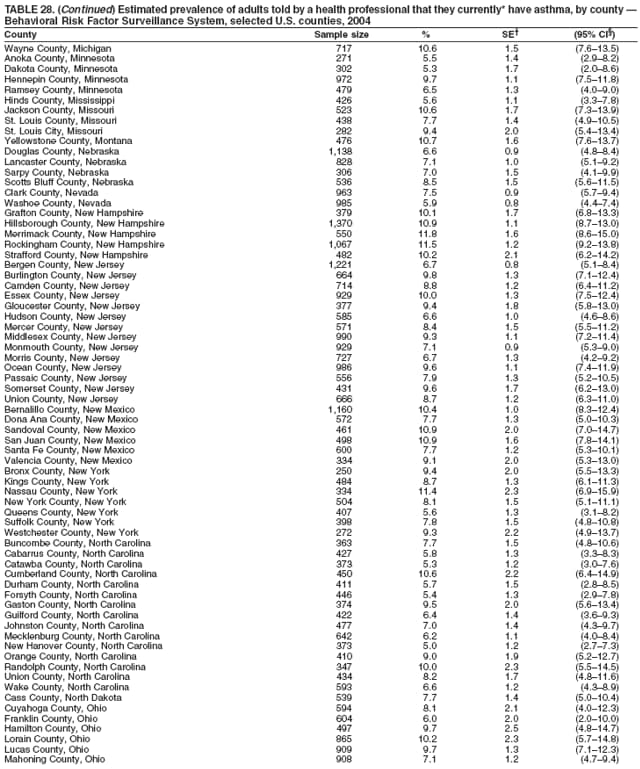 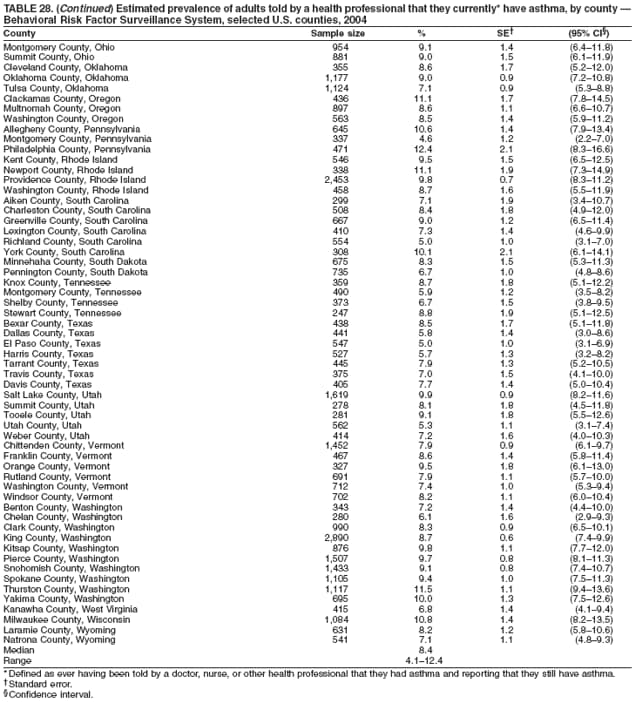 Return to top. Table 29 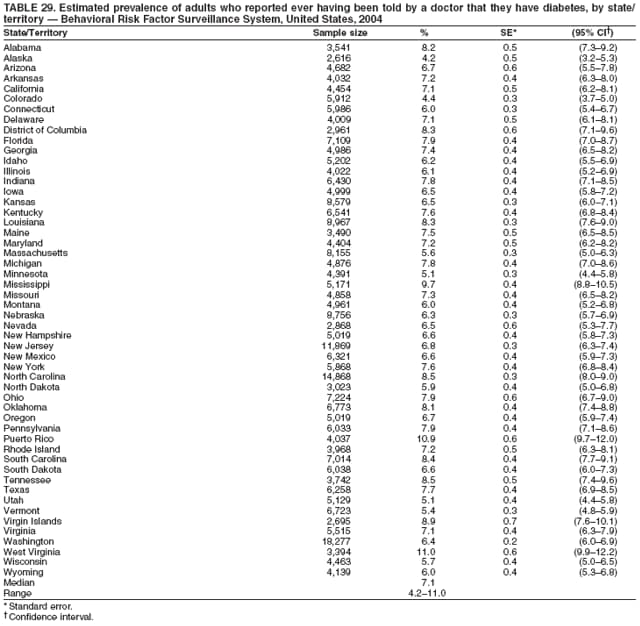 Return to top. Table 30 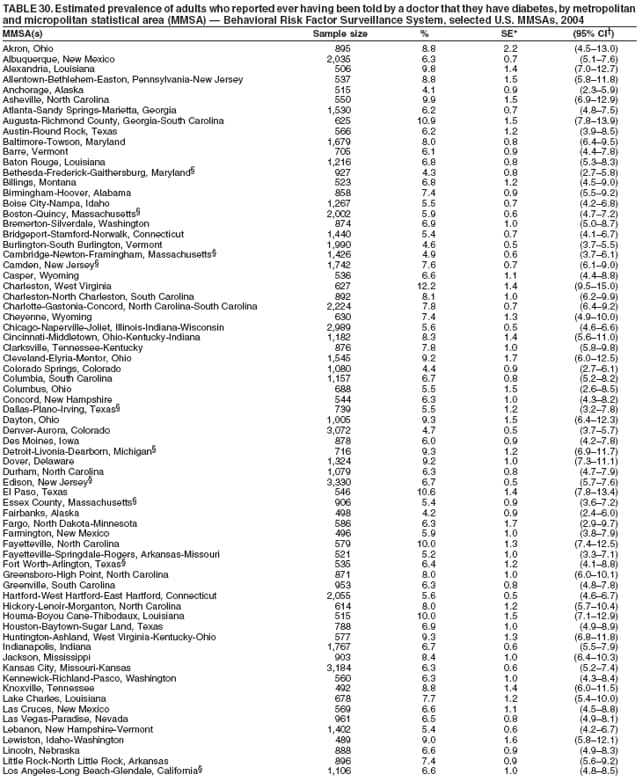 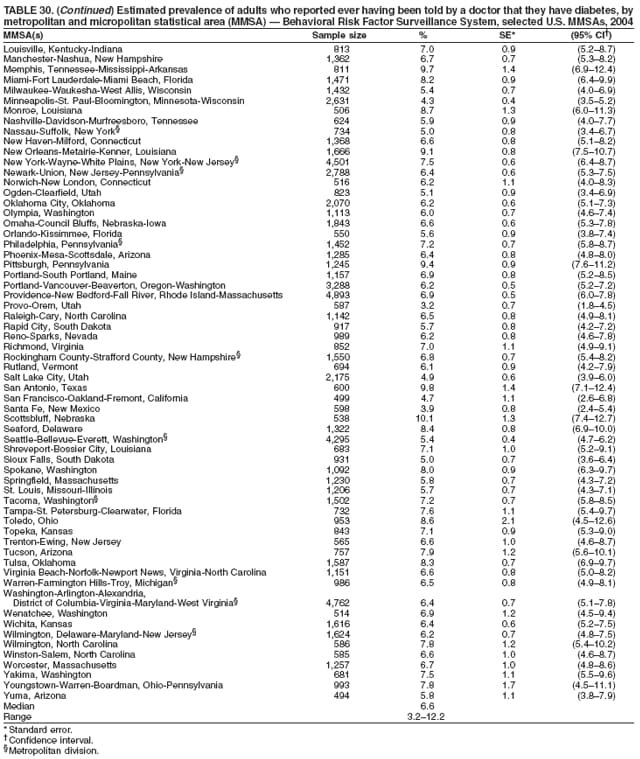 Return to top. Table 31 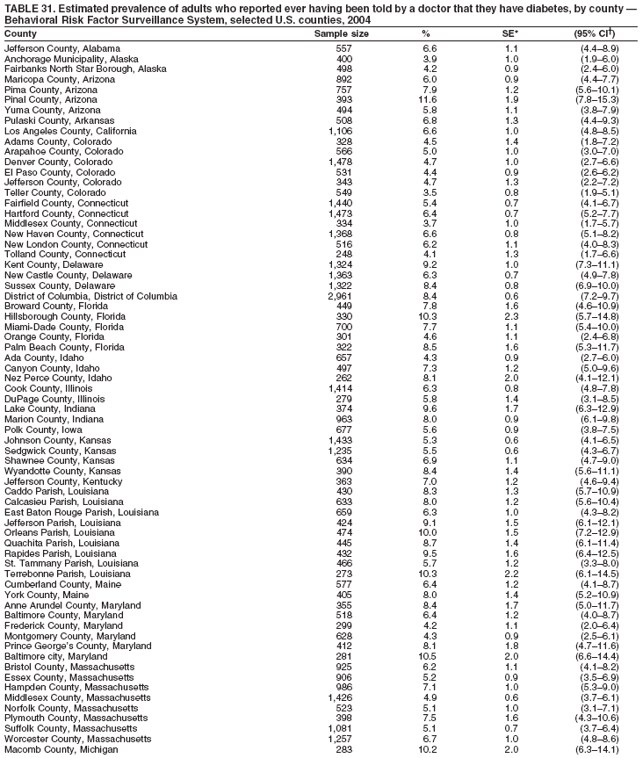   Return to top. Table 32 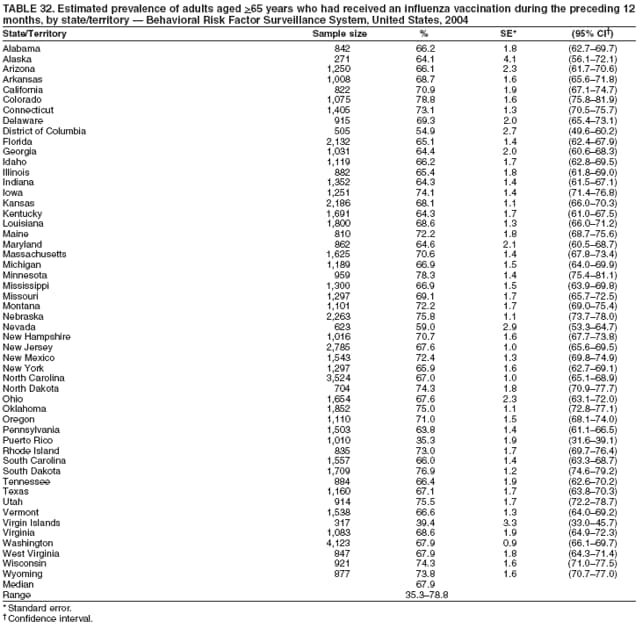 Return to top. Table 33 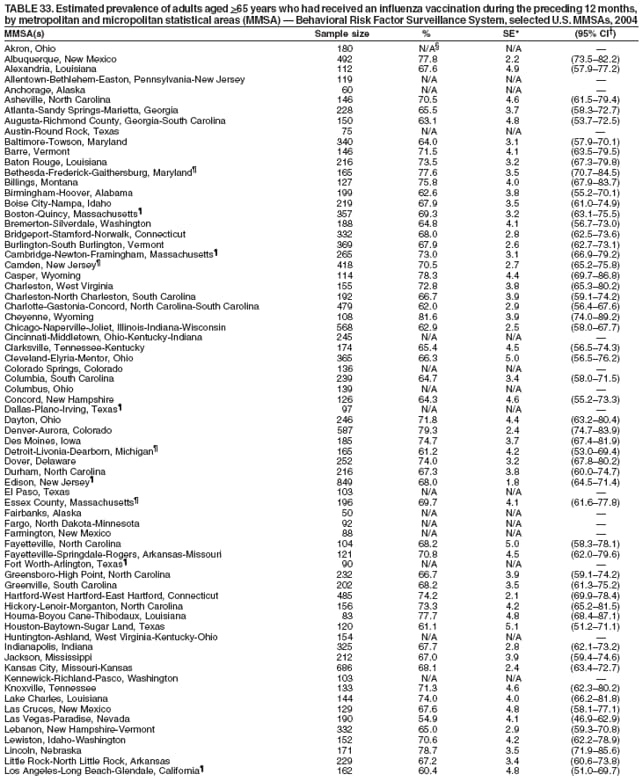 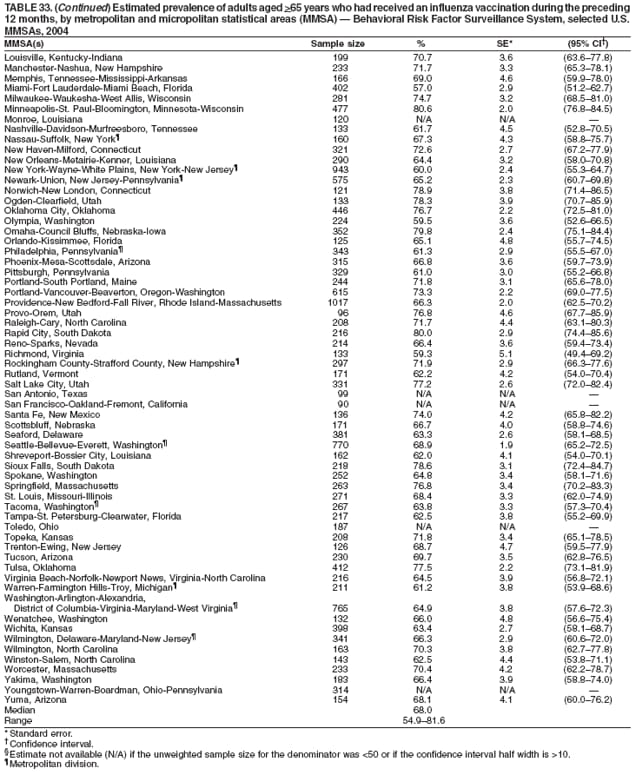 Return to top. Table 34 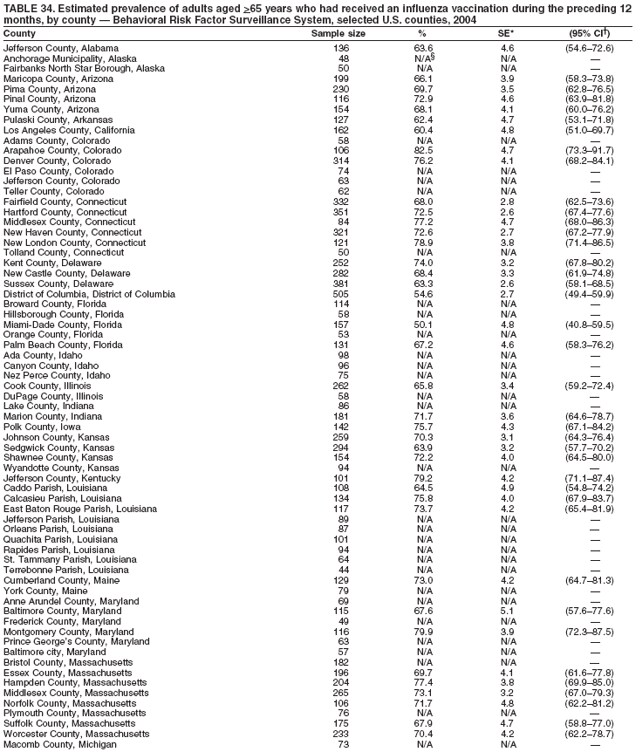 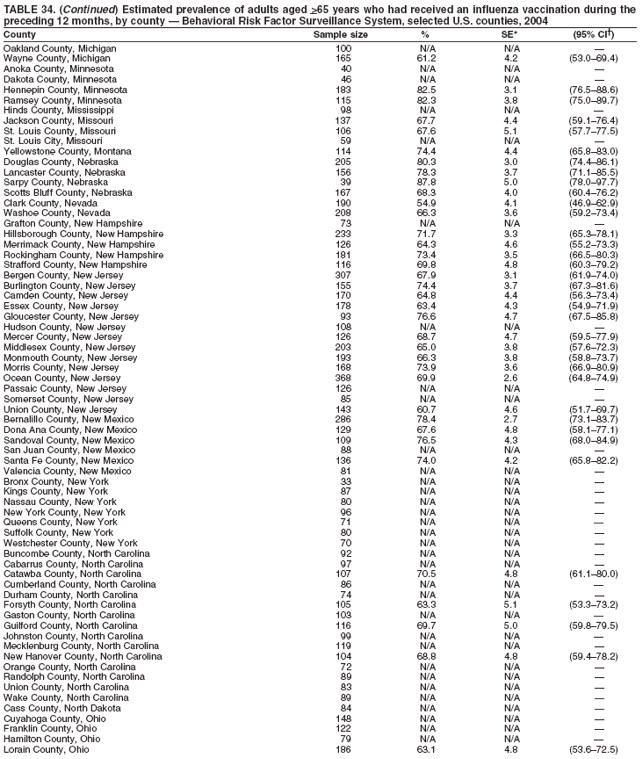 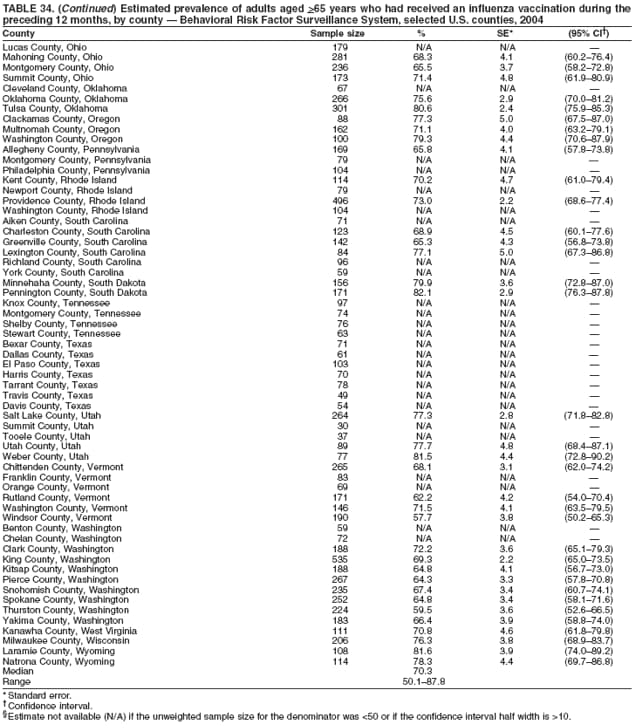 Return to top. Table 35 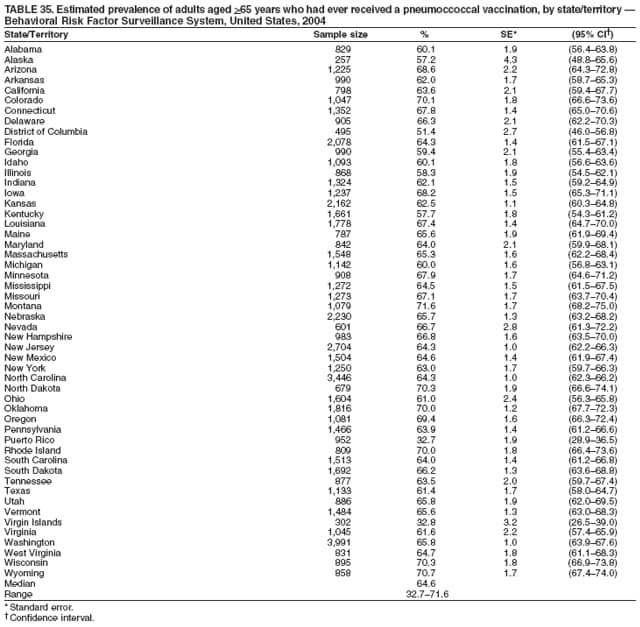 Return to top. Table 36 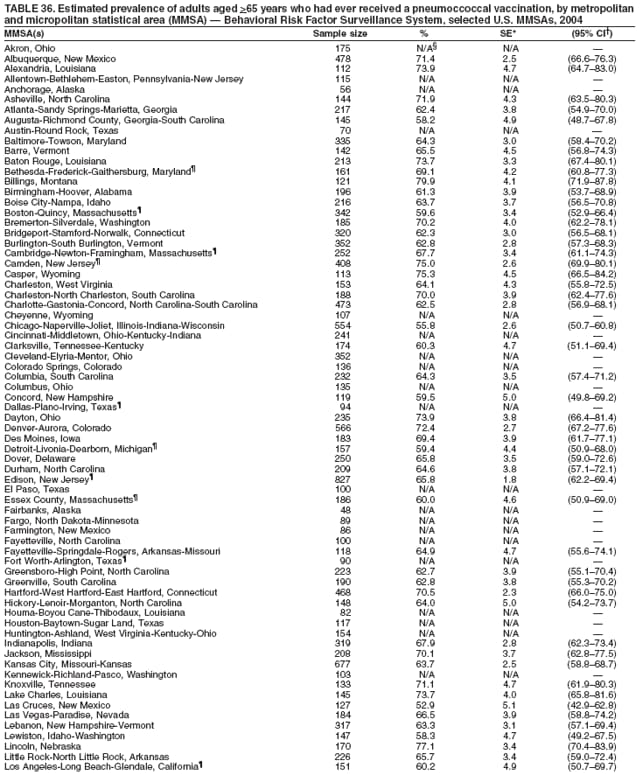  Return to top. Table 37 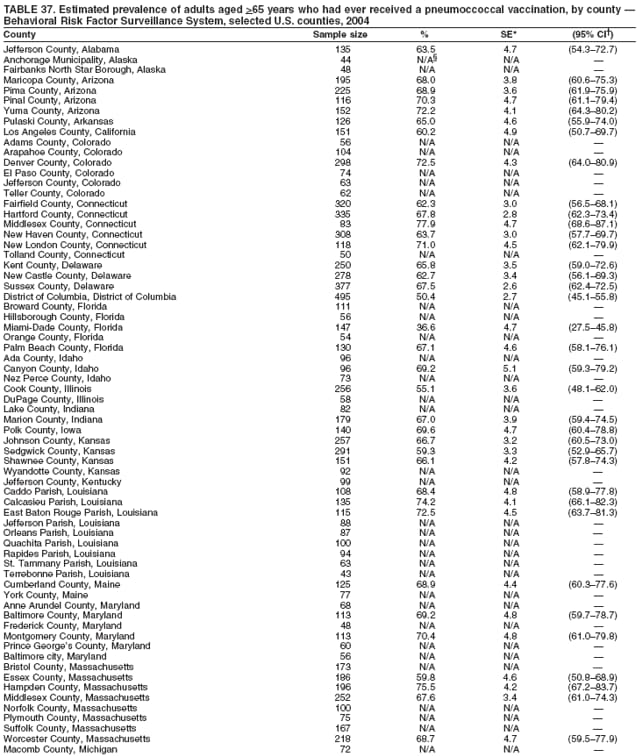 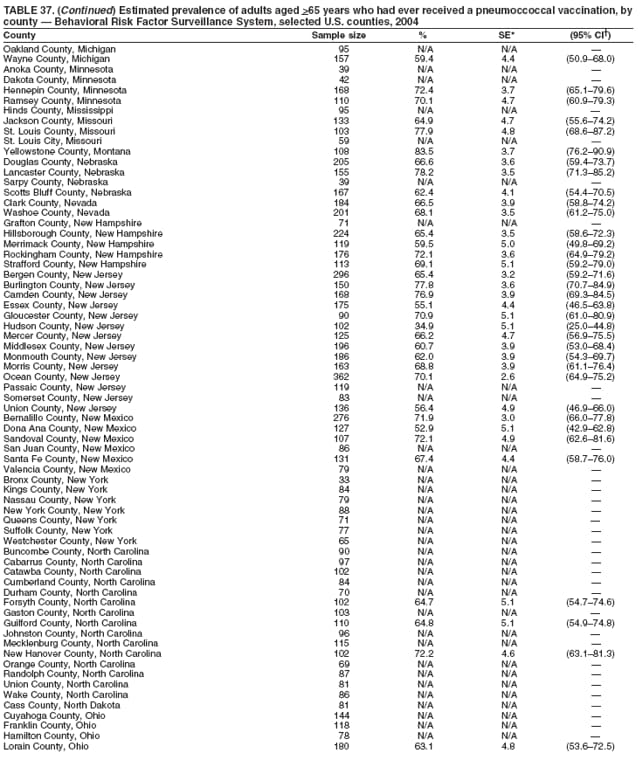 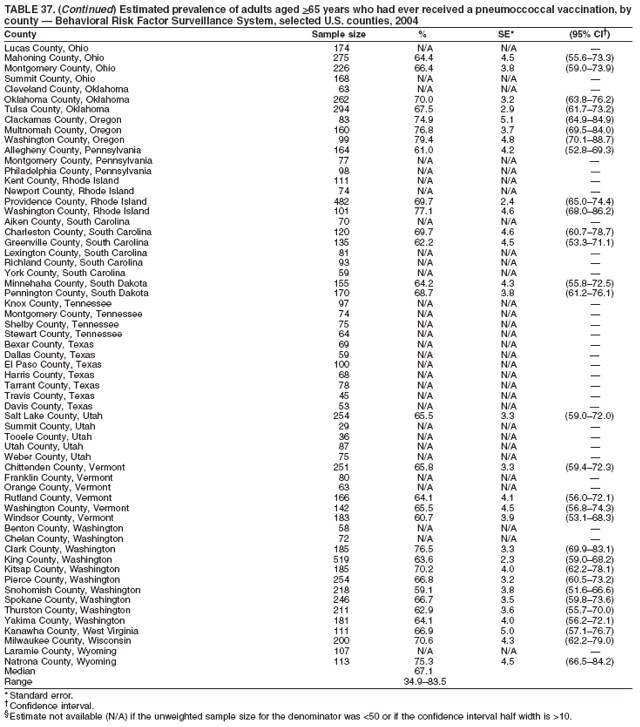 Return to top. Table 38 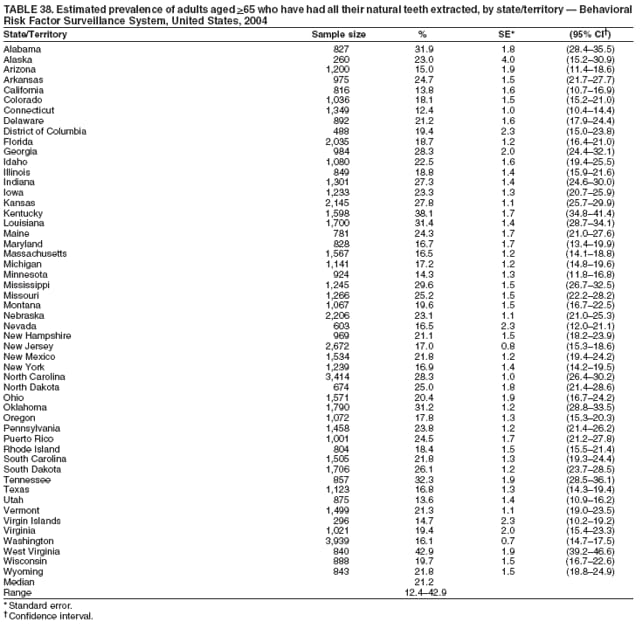 Return to top. Table 39 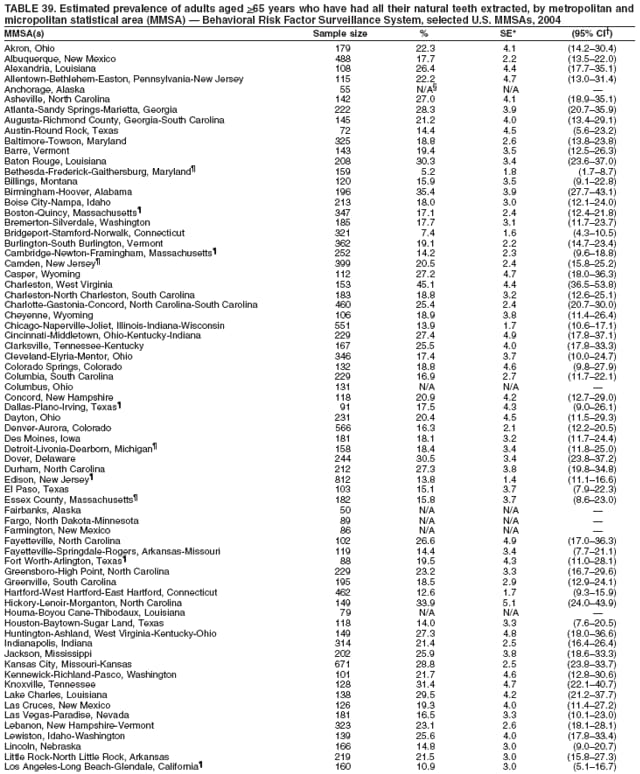  Return to top. Table 40 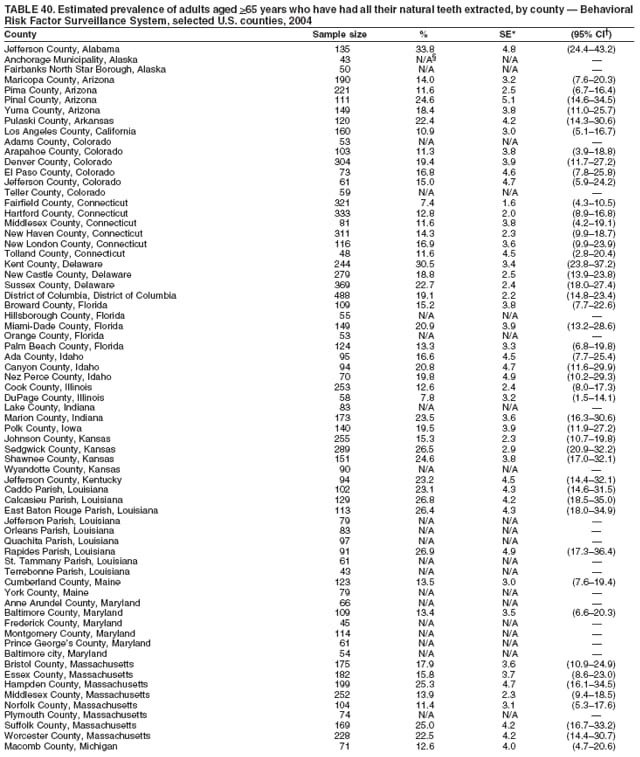 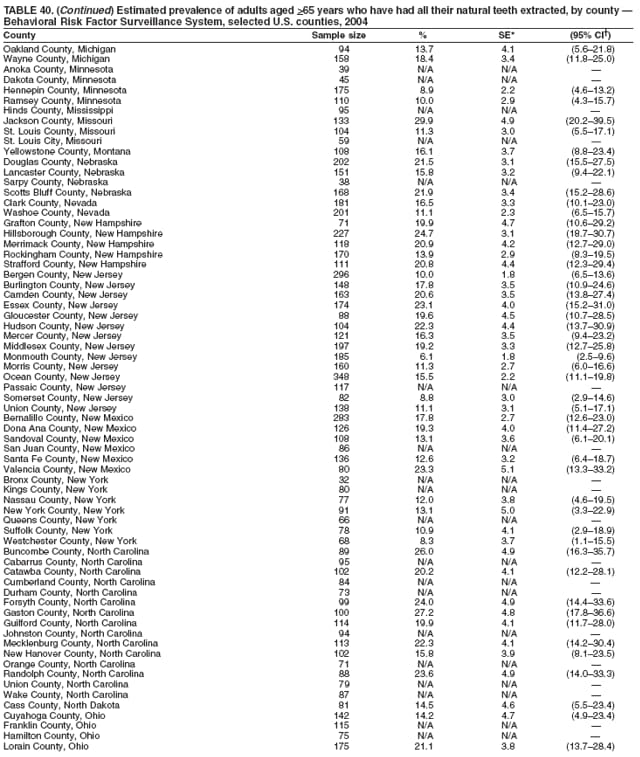 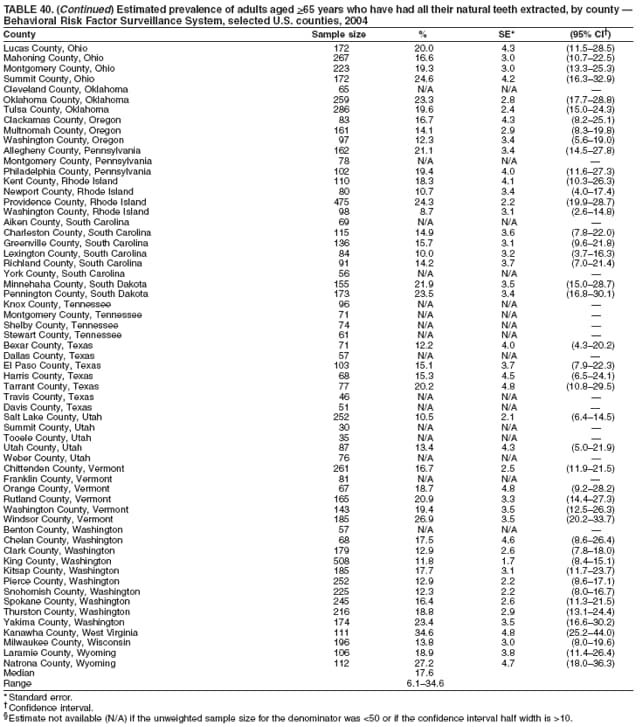 Return to top. Table 41 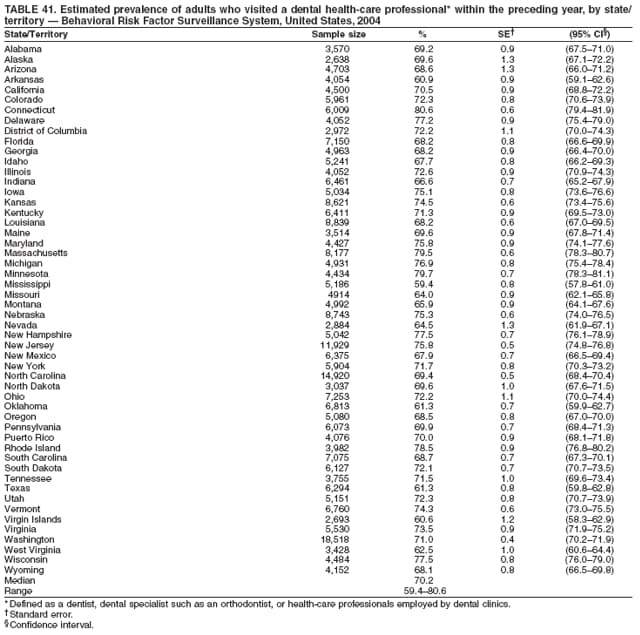 Return to top. Table 42 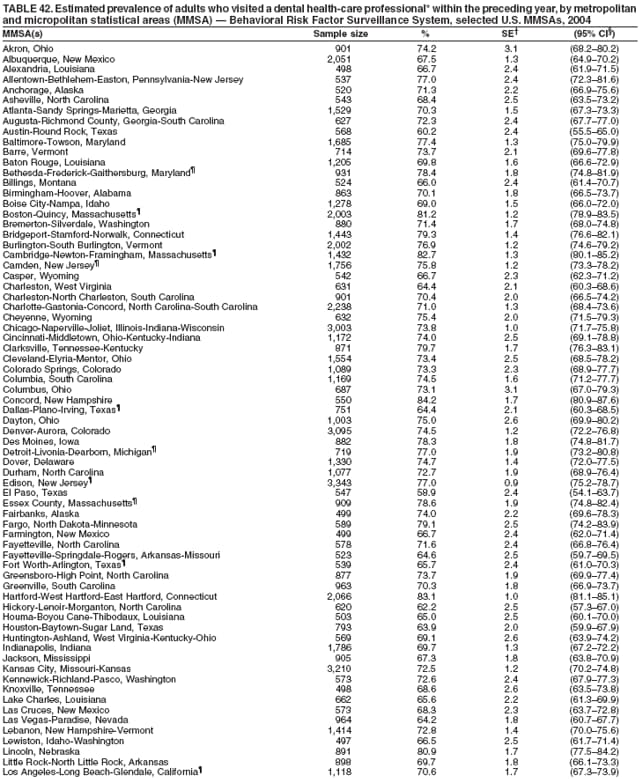 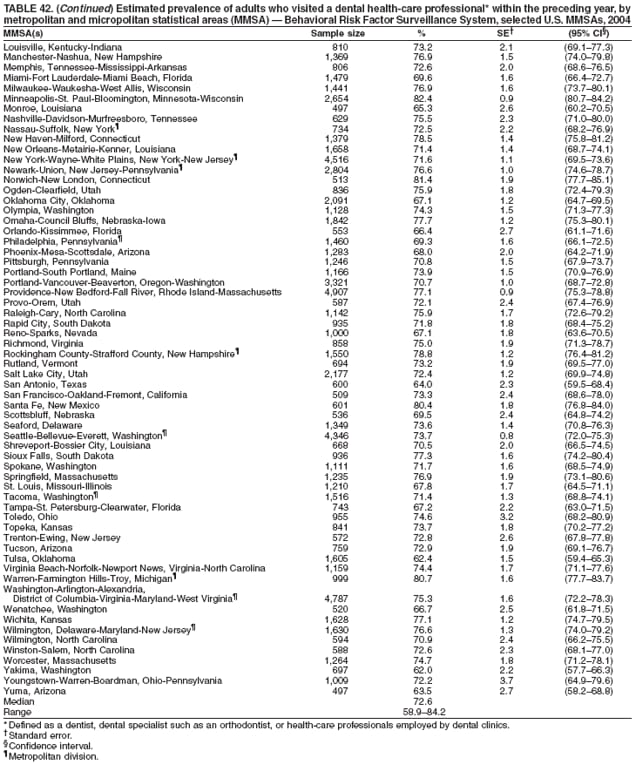 Return to top. Table 43  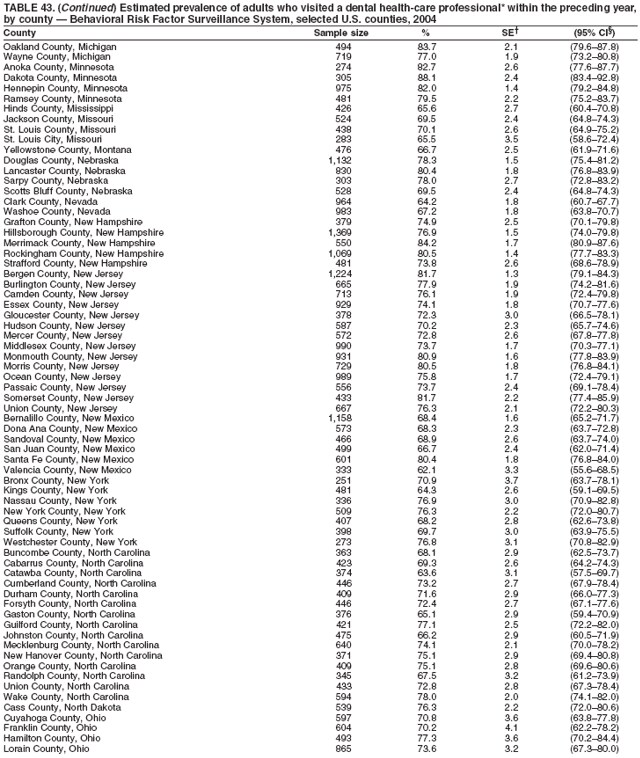 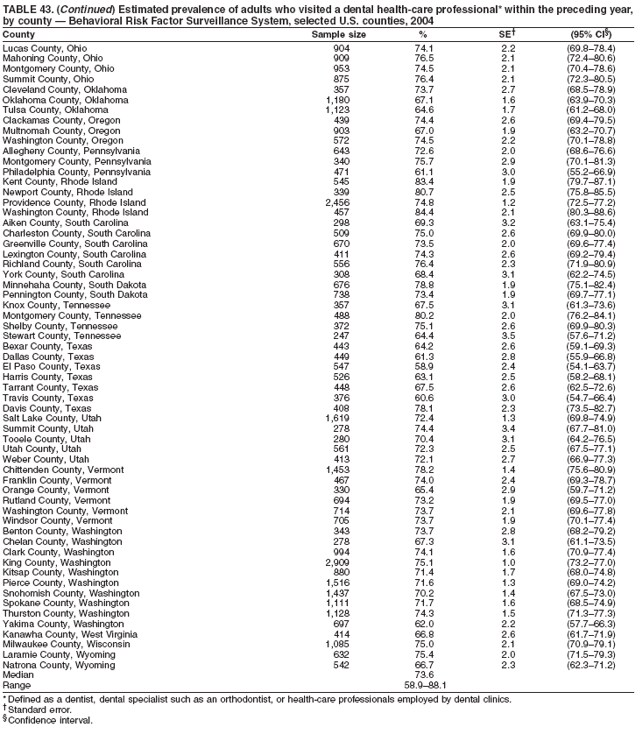 Return to top. Table 44 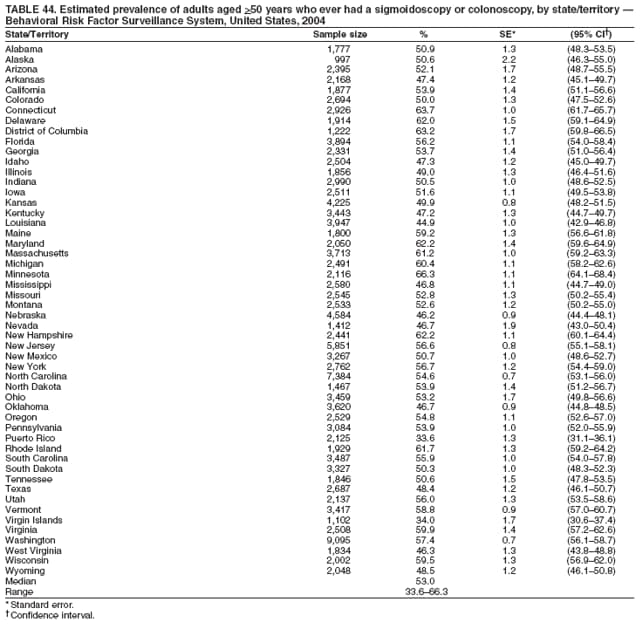 Return to top. Table 45 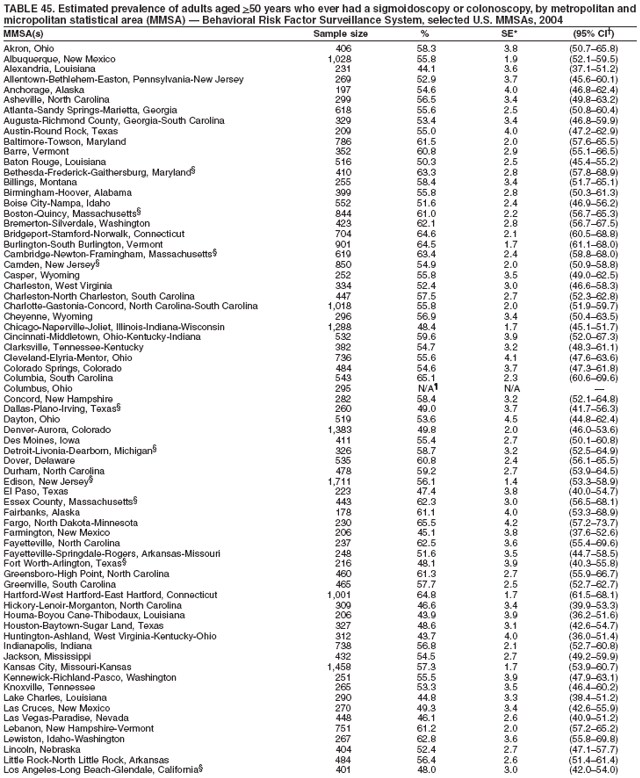 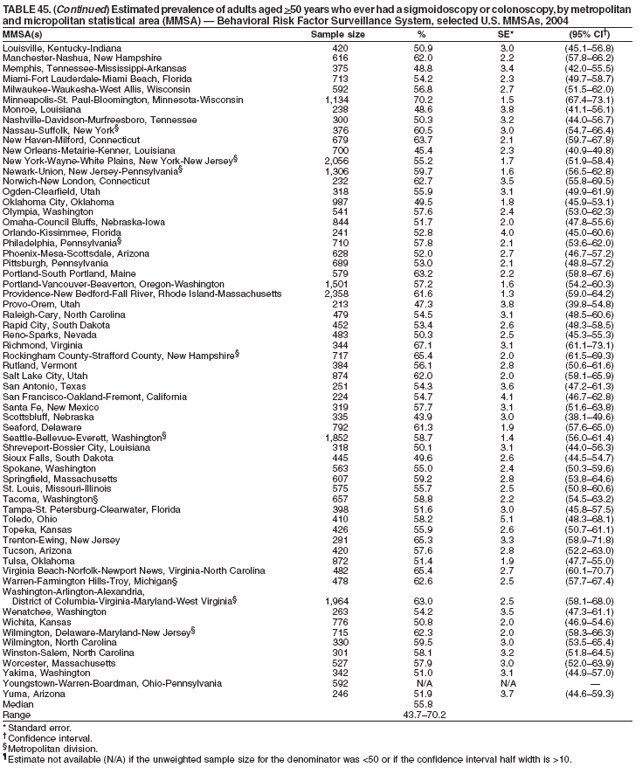 Return to top. Table 46 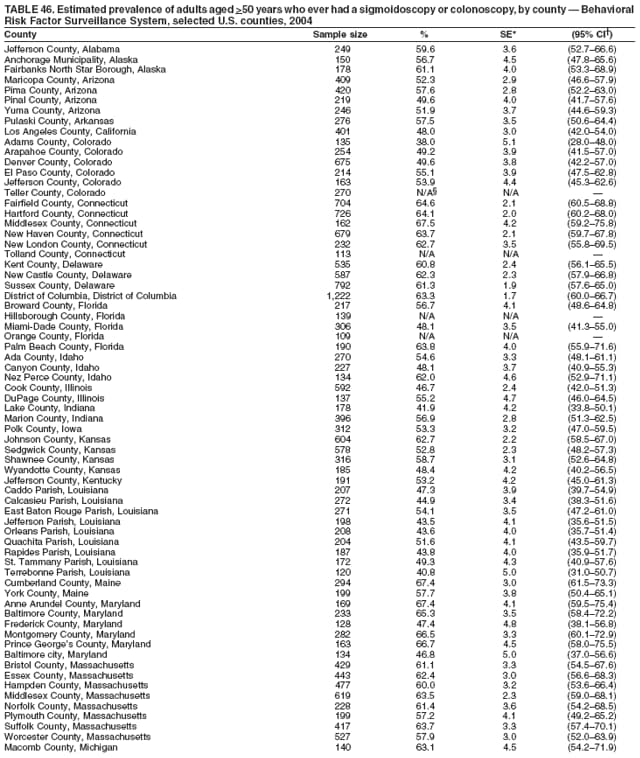 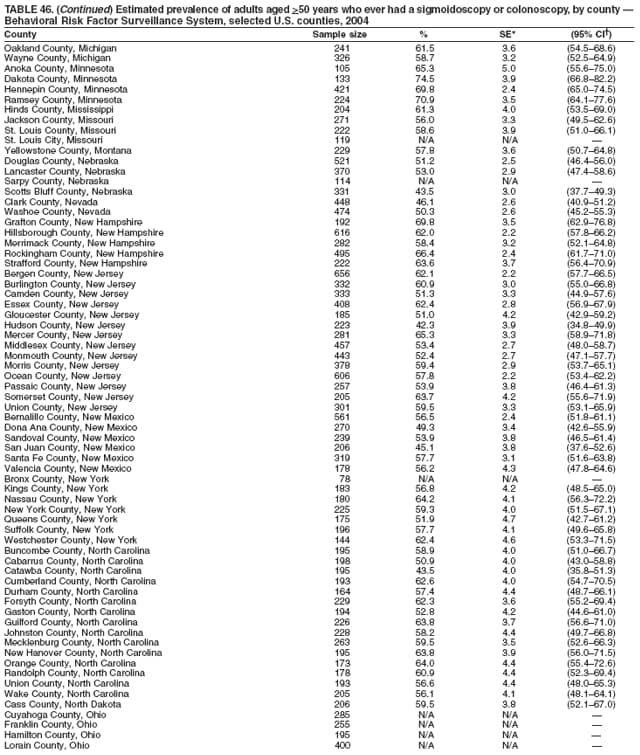 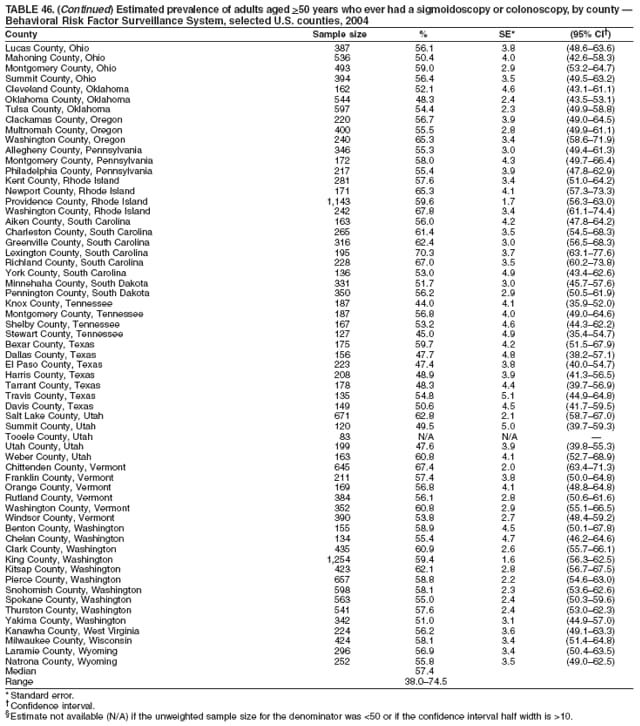 Return to top. Table 47 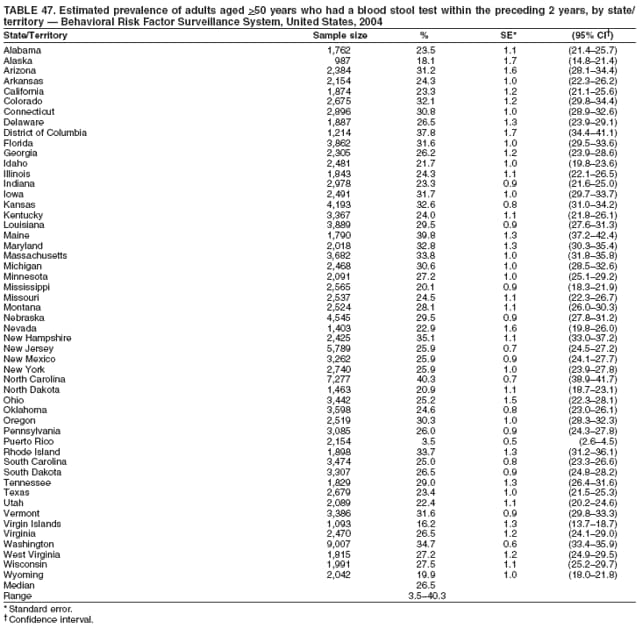 Return to top. Table 48  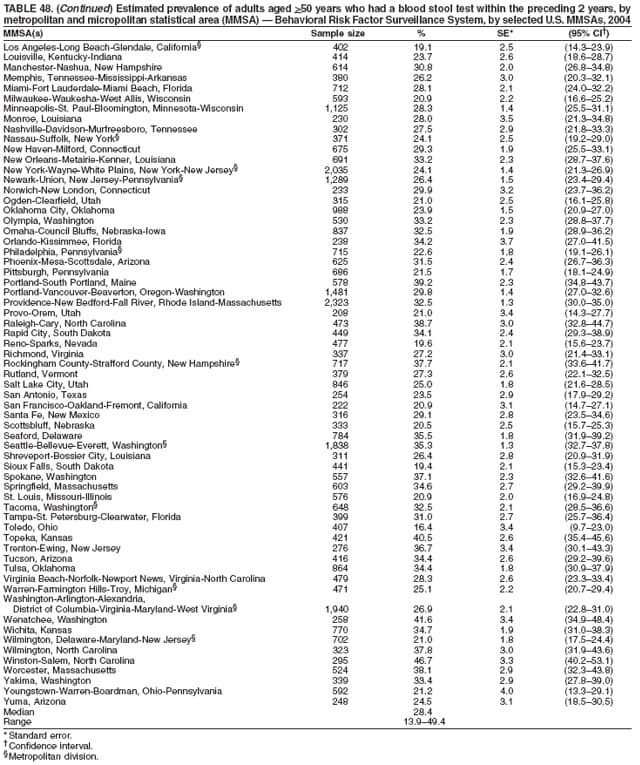 Return to top. Table 49  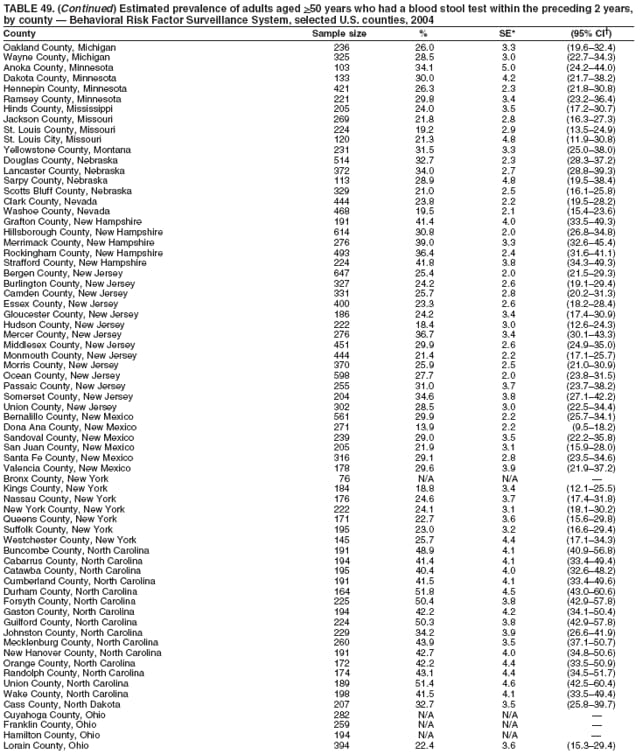 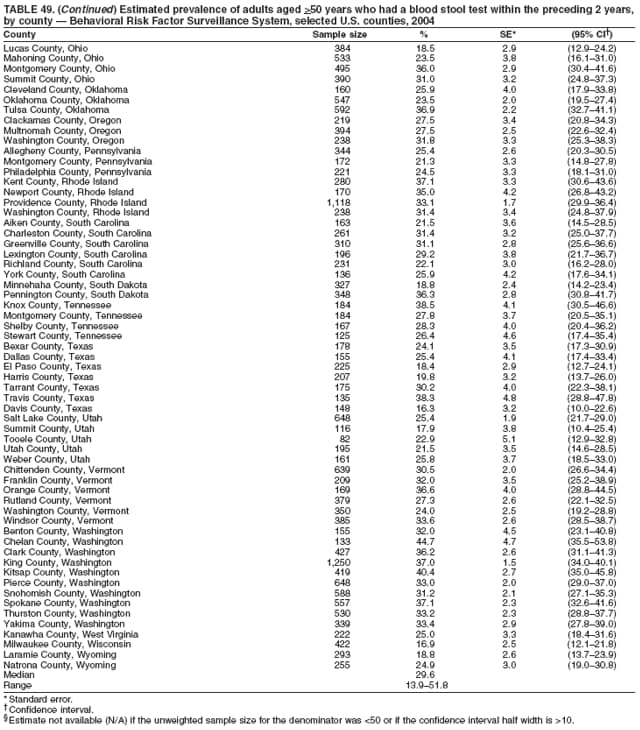 Return to top. Table 50 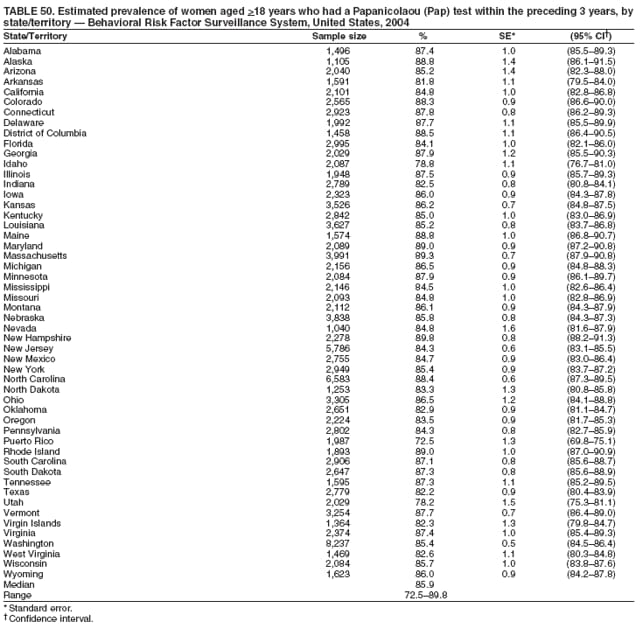 Return to top. Table 51 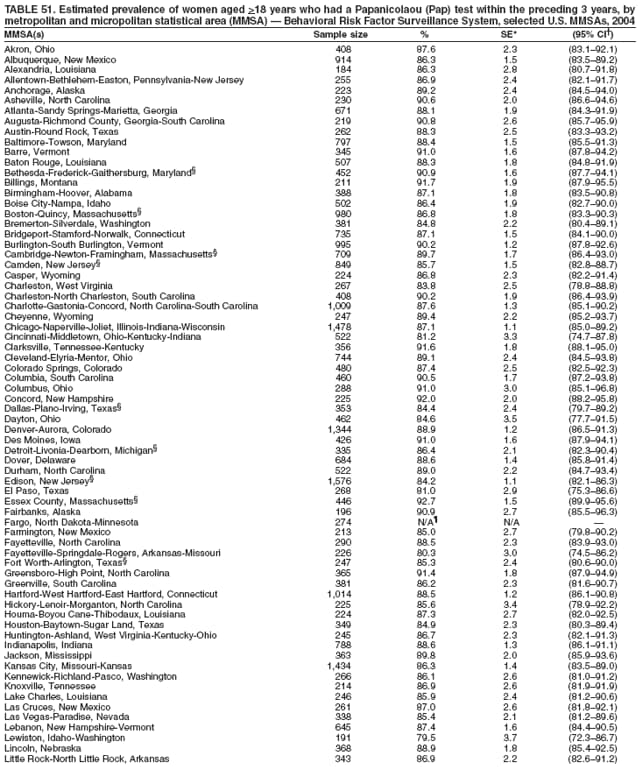 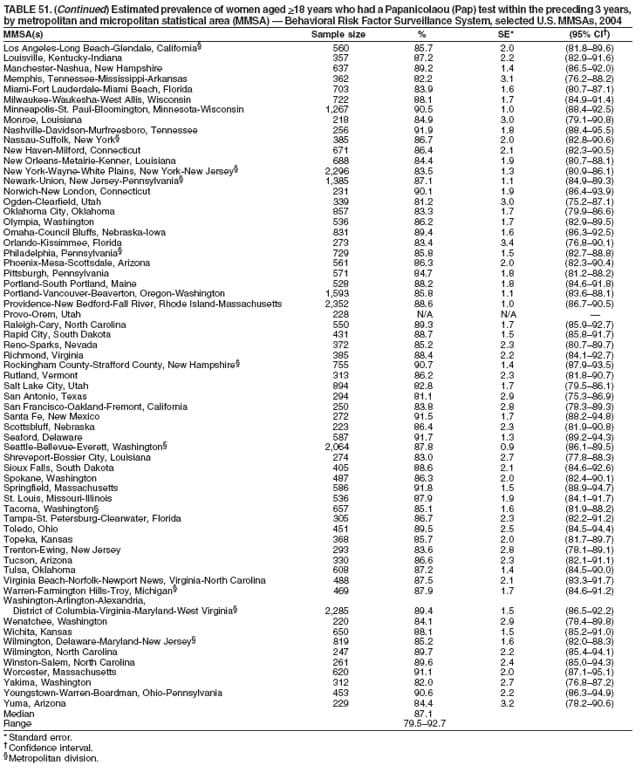 Return to top. Table 52 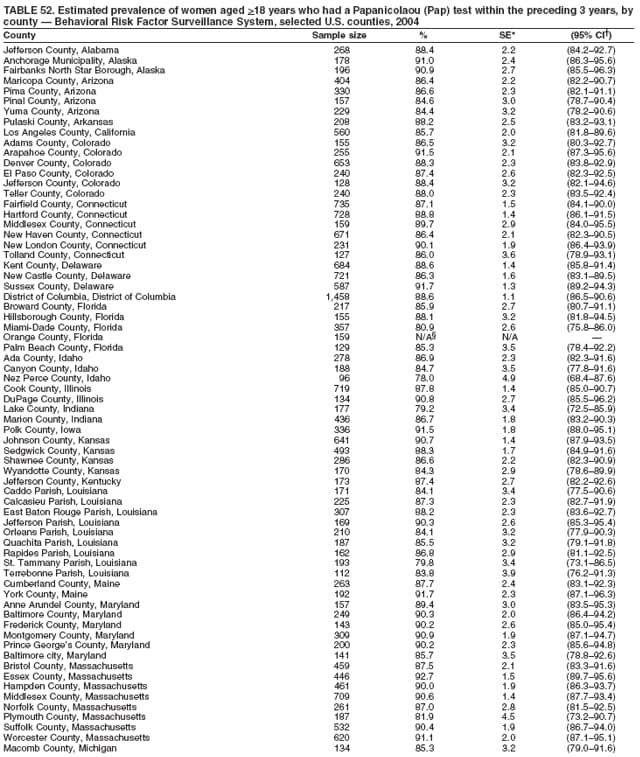 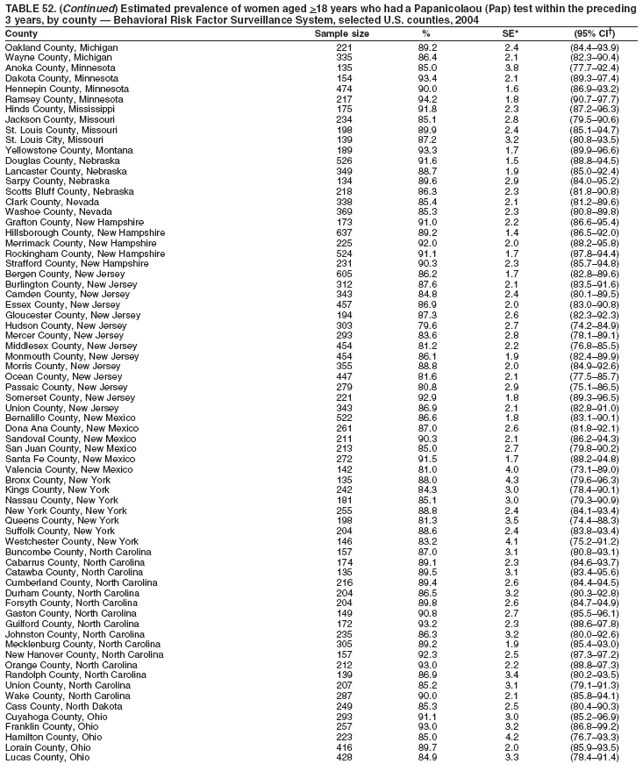 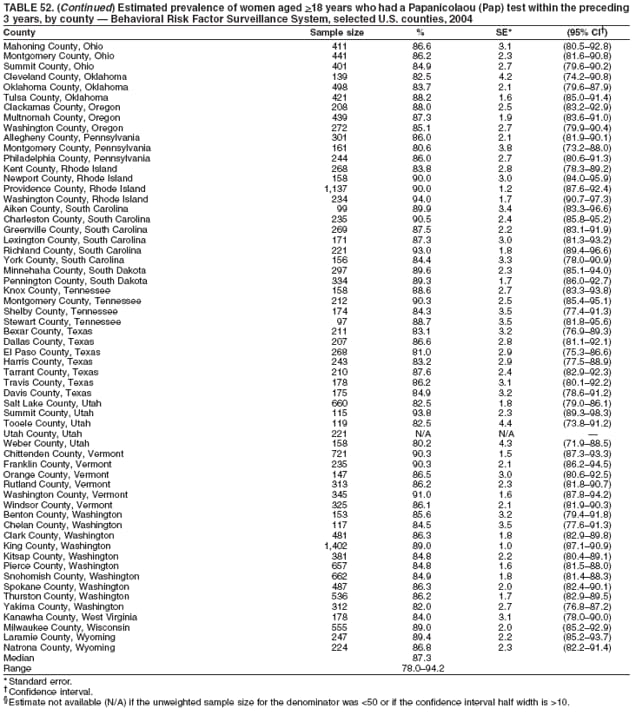 Return to top. Table 53  Return to top. Table 54 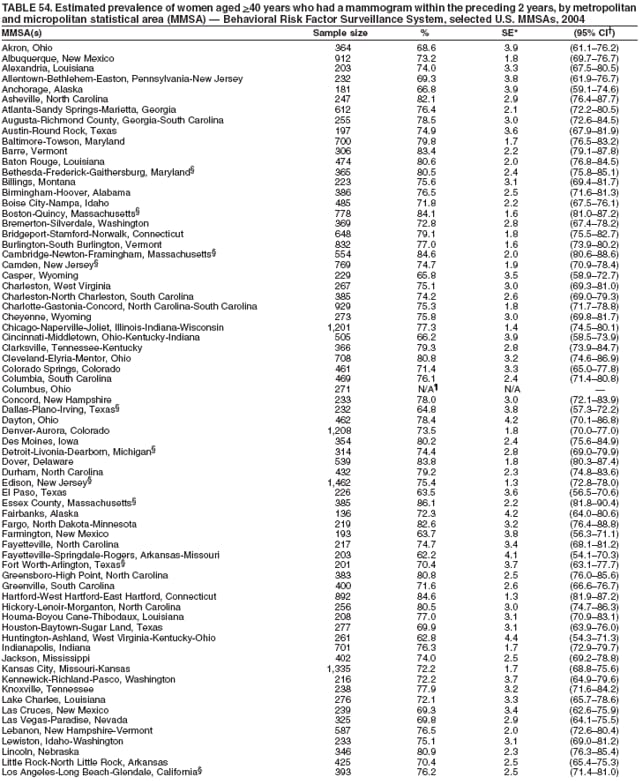 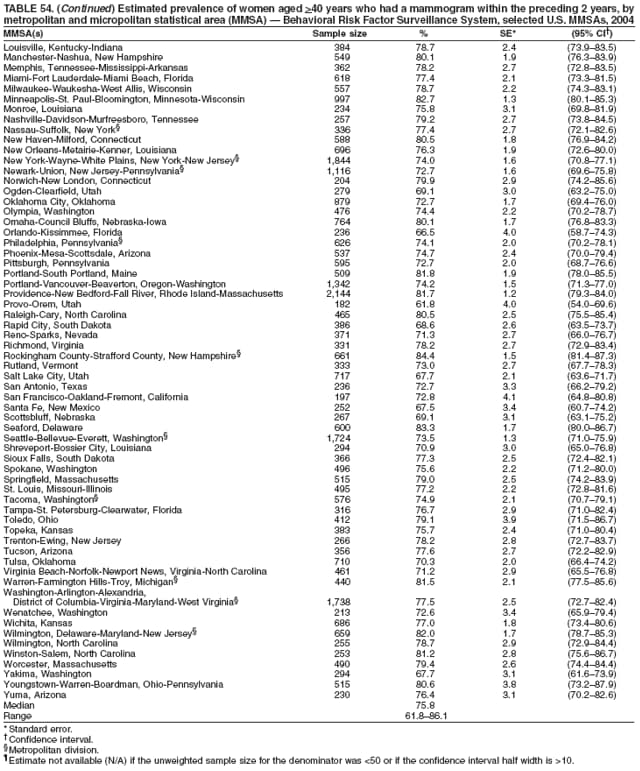 Return to top. Table 55 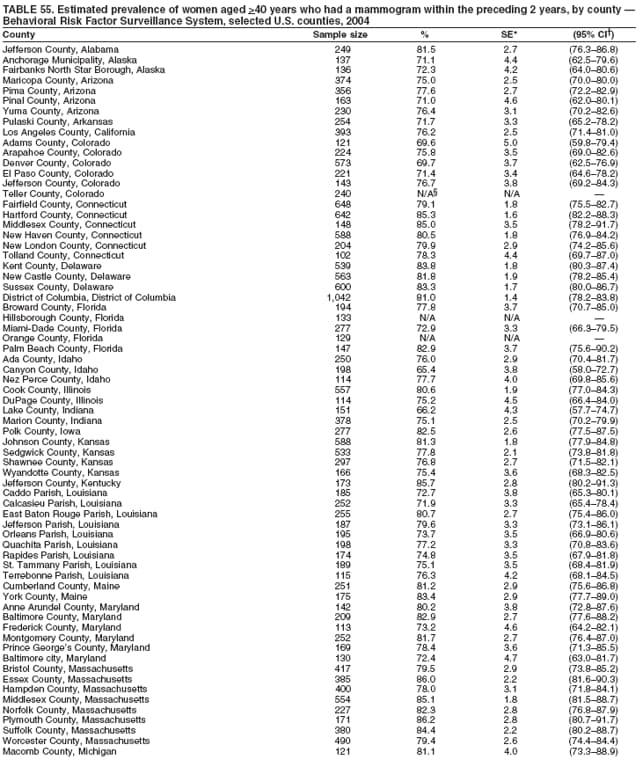 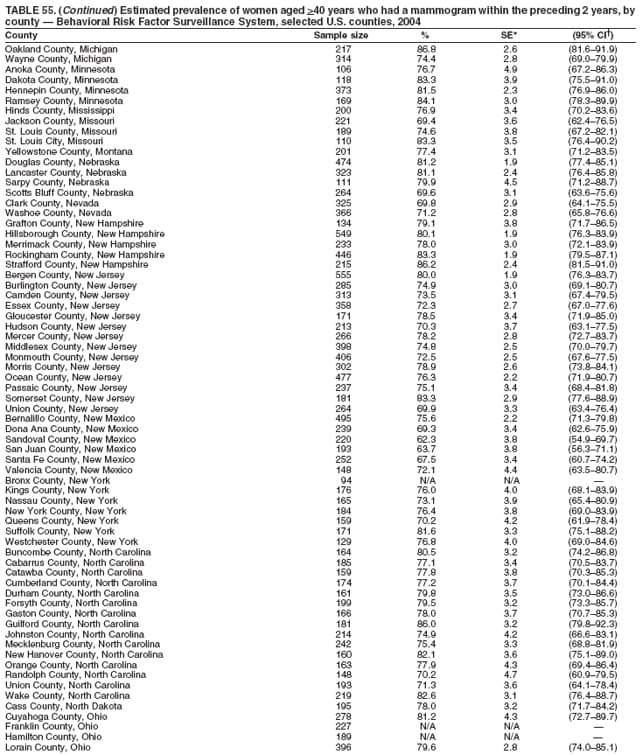  Return to top. Table 56 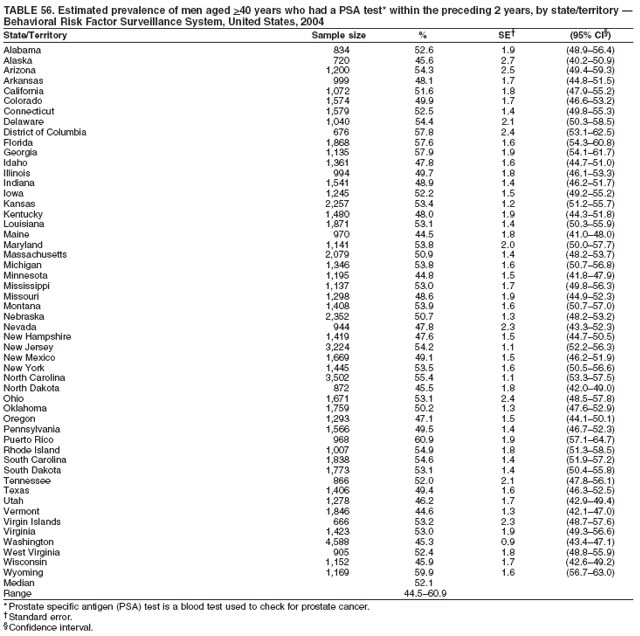 Return to top. Table 57 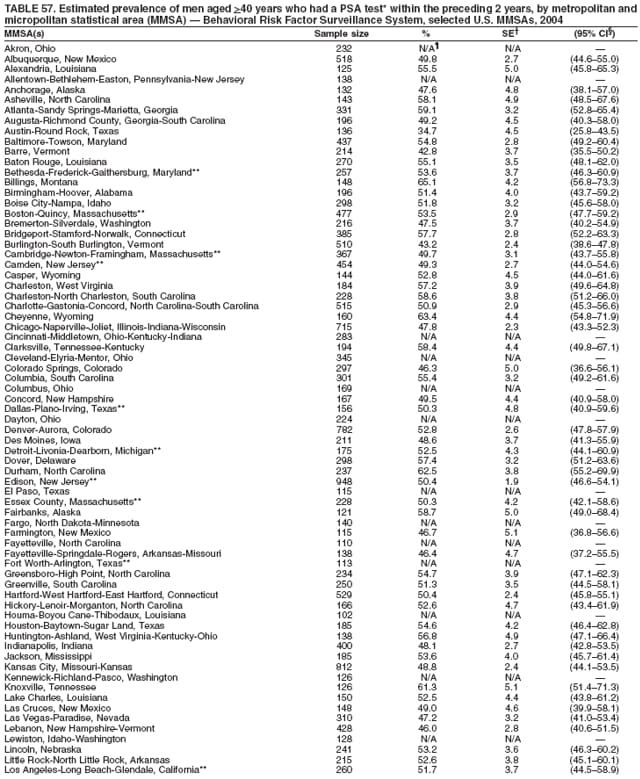 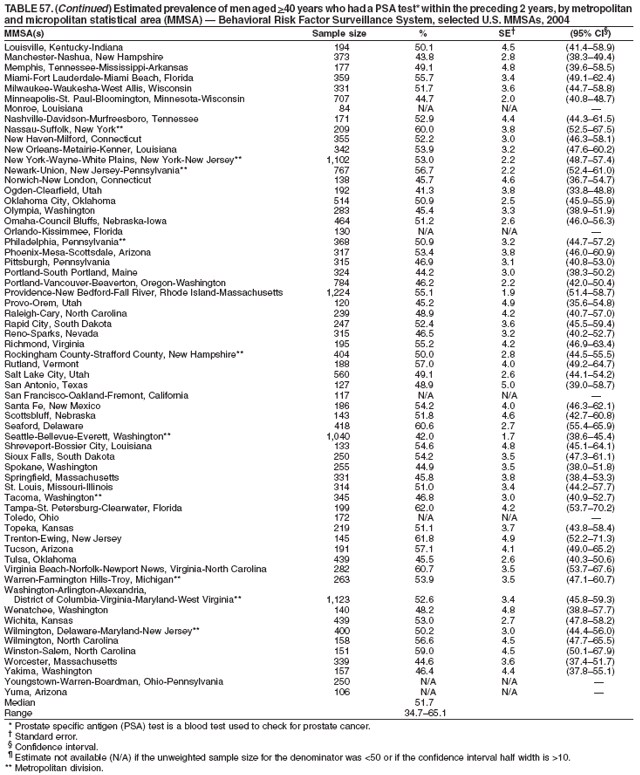 Return to top. Table 58 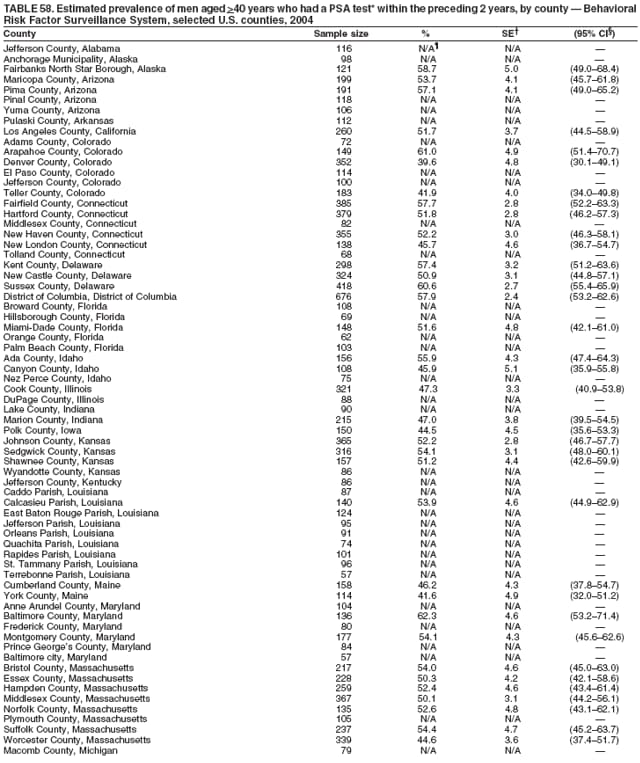 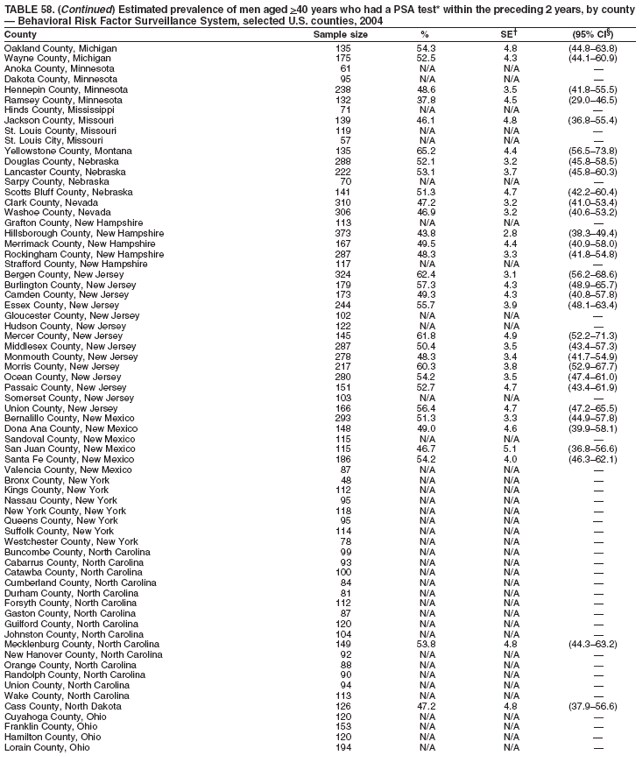 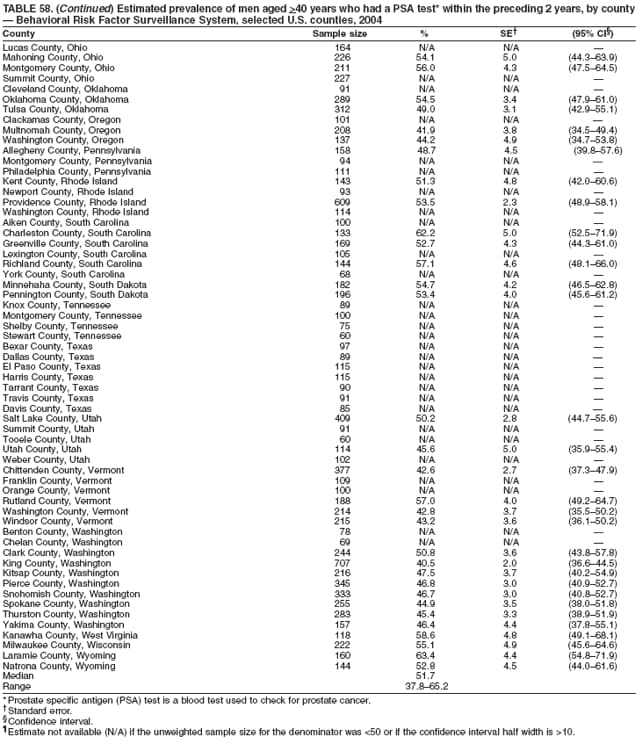 Return to top.
Disclaimer All MMWR HTML versions of articles are electronic conversions from ASCII text into HTML. This conversion may have resulted in character translation or format errors in the HTML version. Users should not rely on this HTML document, but are referred to the electronic PDF version and/or the original MMWR paper copy for the official text, figures, and tables. An original paper copy of this issue can be obtained from the Superintendent of Documents, U.S. Government Printing Office (GPO), Washington, DC 20402-9371; telephone: (202) 512-1800. Contact GPO for current prices. **Questions or messages regarding errors in formatting should be addressed to mmwrq@cdc.gov.Date last reviewed: 6/29/2006 |
|||||||||
|