 |
|
|
|
|
|
|
| ||||||||||
|
|
|
|
|
|
|
||||
| ||||||||||
|
|
|
|
|
Persons using assistive technology might not be able to fully access information in this file. For assistance, please send e-mail to: mmwrq@cdc.gov. Type 508 Accommodation and the title of the report in the subject line of e-mail. Influenza and Pneumococcal Vaccination Levels Among Persons Aged >65 Years ---United States, 2001Two vaccine-preventable diseases, influenza and pneumococcal disease, contribute to the mortality of older persons in the United States. Influenza caused an average of 20,000 deaths per year during influenza epidemics in the United States from 1969 to 1996; persons aged >65 years accounted for approximately 90% of these deaths (1). Pneumococcal disease caused approximately 3,400 deaths among persons aged >65 years in the United States in 1998 (2). National health objectives for 2010 include increasing influenza and pneumococcal vaccination levels to >90% among persons aged >65 years (objective nos. 14.29a and 14.29b, respectively) (3). To assess progress toward achieving these objectives, CDC analyzed data from the 2001 Behavioral Risk Factor Surveillance System (BRFSS). This report summarizes the results, which indicate that the estimated point prevalences of influenza and pneumococcal vaccination were <80% among persons aged >65 years in all reporting areas. Influenza vaccination levels during 2000--2001 decreased from 1998--1999 levels in 27 of 52 reporting areas; pneumococcal vaccination prevalence increased a median of 7 percentage points from 1999 to 2001. Continued efforts are needed to increase the proportion of older adults who receive influenza and pneumococcal vaccines; health-care providers should offer pneumococcal vaccine all year and should continue to offer influenza vaccine during December and throughout the influenza season, even after influenza activity has been documented in the community. BRFSS is a state-based, random-digit--dialed telephone survey of the noninstitutionalized civilian U.S. population aged >18 years. The survey is conducted in all 50 states, the District of Columbia, and three U.S. territories. Questions about influenza vaccination ("During the past 12 months, have you had a flu shot?") and pneumococcal vaccination ("Have you ever had a pneumonia vaccination?") were asked in all reporting areas in odd-numbered years starting in 1993. The response rate (CASRO method) was >60% in 10 of the 54 reporting areas (median: 51.1%; range: 33.3%--81.5%). Response rates for persons aged >65 years were not available. In 2001, the sample included 39,910 respondents aged >65 years. Respondents who reported an unknown influenza (0.3%) or pneumococcal (2.6%) vaccination status were excluded from the analysis. Overall vaccination levels were estimated for the 50 states and the District of Columbia; data for Guam, Puerto Rico, and the Virgin Islands were reported in area-specific results only. Data were weighted by age, sex, and, in some areas, by race/ethnicity to reflect each area's estimated adult population. SUDAAN was used to calculate point estimates and 95% confidence intervals (CIs) and to conduct multivariable logistic regression to calculate odds ratios and test associations of vaccination status with age, race/ethnicity, sex, education level, geographic region, self-reported health, diabetes status, smoking status, and asthma history. During 2001, a total of 64.9% (95% CI=64.0%--65.8%) of respondents aged >65 years reported having received an influenza vaccination during the preceding year (Table 1), compared with 66.9% (95% CI=66.0%--67.8%) in 1999 (4). Previous analyses have indicated percentage point increases of 7.7%, 7.4%, and 1.5% from 1993 to 1995, 1995 to 1997, and 1997 to 1999, respectively (4). Estimated influenza vaccination levels exceeded 60% in 48 of 54 reporting areas; in 34 of these areas, 95% CIs exceeded 60% (Table 2). Vaccination prevalence ranged from 36.8% (Puerto Rico) to 79.0% (Hawaii). Of the 52 areas for which data were available for both 1999 and 2001, the median percentage point difference from 1999 to 2001 was --0.9 (range: --9.6--6.5). The proportion of respondents reporting having ever received pneumococcal vaccination increased 5.9 percentage points, from 54.1% (95% CI=53.2%--55.1%) in 1999 to 60.0% (95% CI=59.2%--60.8%) in 2001 (Table 1). Previous analyses indicated percentage point increases of 6.9%, 9.8%, and 8.7% from 1993 to 1995, 1995 to 1997, and 1997 to 1999, respectively (4). Of the 52 reporting areas for which data were available for both 1999 and 2001, the proportion of respondents reporting having ever received pneumococcal vaccination increased in 51 areas (Table 2). Estimated pneumococcal vaccination levels exceeded 60% in 32 reporting areas, and 95% CIs exceeded 60% in 18 of these areas. Vaccination prevalence ranged from 24.1% (Puerto Rico) to 70.9% (Oregon). Receipt of one vaccine was associated with receipt of the other vaccine. A total of 10.5% of respondents reported pneumococcal vaccination only, and 15.4% reported recent influenza vaccination only; 49.3% reported both, and 24.7% reported having received neither. The estimated percentages of non-Hispanic blacks and Hispanics having received influenza (non-Hispanic black=48.1% and Hispanic=55.2%) and pneumococcal vaccination (non-Hispanic black=39.4% and Hispanic=41.6%) were less than those for non-Hispanic whites having received influenza (67.1%) and pneumococcal vaccination (63.5%) (Table 1). After accounting for variations in age, sex, education level, self-reported health, diabetes status, geographic region, smoking status, and asthma history by logistic regression, the disparity in vaccination coverage between non-Hispanic whites and non-Hispanic blacks and Hispanics remained statistically significant (Table 3). The association between vaccination status and additional variables was examined by multivariable logistic regression (Table 3). Persons aged >75 years were more likely to report influenza or pneumococcal vaccination than persons aged 65--74 years. Men were more likely than women to report influenza vaccination and less likely to report pneumococcal vaccination. Persons with diabetes or asthma were significantly more likely to report influenza and pneumococcal vaccination, compared with those who did not have diabetes or asthma. Coverage with both vaccines increased as education level increased and as self-reported health declined. Pneumococcal vaccination coverage was higher among smokers than among nonsmokers. Reported by: A MacNeil, MPH, Association of Schools of Public Health, Atlanta, Georgia. JA Singleton, MS, JS Moran, MD, Epidemiology and Surveillance Div, National Immunization Program, CDC. Editorial Note:The findings in this report indicate that the estimated prevalences of influenza and pneumococcal vaccinations were <80% among persons >65 years in all reporting areas. National influenza vaccination coverage for persons aged >65 years increased linearly during 1993--1997, leveled off by 1999, and decreased during 1999--2001. The 2001 coverage is slightly below coverage reported in 1997. The decrease in influenza vaccine coverage might be due, in part, to delays in influenza vaccine distribution during the 2000--01 influenza season and the less severe distribution delays during the 2001--02 season (5). Pneumococcal vaccination coverage among persons aged >65 years increased linearly during 1993--2001 and was significantly above 60% in 18 states in 2001. The number of states with point prevalence estimates of >60% increased from eight in 1999 to 32 in 2001. However, coverage in all 54 reporting areas remained <90% and must increase substantially to meet the national health objective for 2010. Previous reports have noted racial/ethnic disparities in adult vaccine coverage (4). In the 2001 BRFSS, non-Hispanic blacks and Hispanics had substantially lower coverage than non-Hispanic whites. After adjusting for known potential confounding factors measured by BRFSS (e.g., education level but not direct measures of access to care, which were not available), the odds of members of these populations receiving influenza or pneumococcal vaccine remained substantially lower. These gaps were greatest for pneumococcal vaccine. In comparison with influenza vaccine, which is recommended annually, a single dose of pneumococcal vaccine is needed for persons aged >65 years. Strategies for addressing these disparities will be investigated by CDC's Racial and Ethnic Adult Disparities Immunization Initiative (READII) through 2-year demonstration projects in Chicago, Illinois; Milwaukee, Wisconsin; a rural area of Mississippi; Rochester, New York; and San Antonio, Texas. Local and state health departments in these areas will work with community partners, CDC, and other federal agencies to identify and implement effective ways to improve influenza and pneumococcal vaccination levels among older non-Hispanic blacks and Hispanics. Health-care providers should assess the vaccination status of their patients and offer indicated vaccines. Annual influenza vaccination provides such an opportunity; persons reporting recent influenza vaccination were 2.5 times more likely to report having received pneumococcal vaccine than were persons who did not report recent influenza vaccination. Administration of influenza and pneumococcal vaccine simultaneously does not increase the incidence or severity of adverse reactions (6). Nevertheless, approximately one fourth of persons reporting recent influenza vaccination did not report having ever received pneumococcal vaccine. The findings in this report are subject to at least three limitations. First, receipt of influenza or pneumococcal vaccination was based on self-report and not validated. The validity of self-reported pneumococcal vaccination is lower than that of influenza vaccination (7). Second, the BRFSS excludes persons without telephones or those with only cellular telephones. Third, the BRFSS response rate was >60% in 10 of the 54 reporting areas. To assess possible selection bias resulting from the two latter limitations, comparisons were made between national estimates of vaccination coverage from BRFSS and the National Health Interview Survey (NHIS). NHIS data are collected through household, face-to-face interviews and usually have higher response rates (e.g., 72.1% in 2000). Estimated influenza vaccination levels for persons aged >65 years in 1997, 1999, and 2001 were 63.2%, 65.7%, and 63.0%, respectively, from NHIS and 65.5%, 66.9%, and 64.9%, respectively, from BRFSS. For the same years, estimated pneumococcal vaccination levels were 42.4%, 49.7%, and 53.8%, respectively, from NHIS and 45.4%, 54.1%, and 60.0%, respectively, from BRFSS. National BRFSS vaccination estimates show similar trends and subgroup differences as NHIS estimates but are consistently slightly higher than NHIS estimates. Previous analysis has documented that NHIS respondents living in households without telephones were less likely to report being vaccinated than those living in households with telephones (4), but this accounts for only a small portion of the differences observed between NHIS and BRFSS estimates. The optimal time to administer influenza vaccination is during October--November. However, influenza vaccination should continue into December and later because many persons at high risk for influenza-related complications, household members of these persons, health-care workers, and other persons who want to decrease their risk for influenza remain unvaccinated by the end of November (1). Current projections indicate that 93 million doses of influenza vaccine will be available during the 2002--03 influenza season, and several million doses remain available for purchase. To maximize coverage among target groups and overall use, physicians should offer influenza vaccine throughout the influenza season. Influenza activity peaked in January or later in 21 of the preceding 25 influenza seasons (1). During influenza season and all year, pneumococcal vaccination also should be offered to persons aged >65 years and others at high risk who have not been vaccinated or whose vaccination status is unknown. Physicians can improve coverage by using strategies such as improved record keeping, standing orders, reminder/recall systems, and offering vaccinations to hospitalized patients before discharge (8,9). Additional information about influenza and pneumococcal vaccination is available at http://www.cdc.gov/nip. Acknowledgment This report is based on data contributed by state BRFSS coordinators. References
Table 1 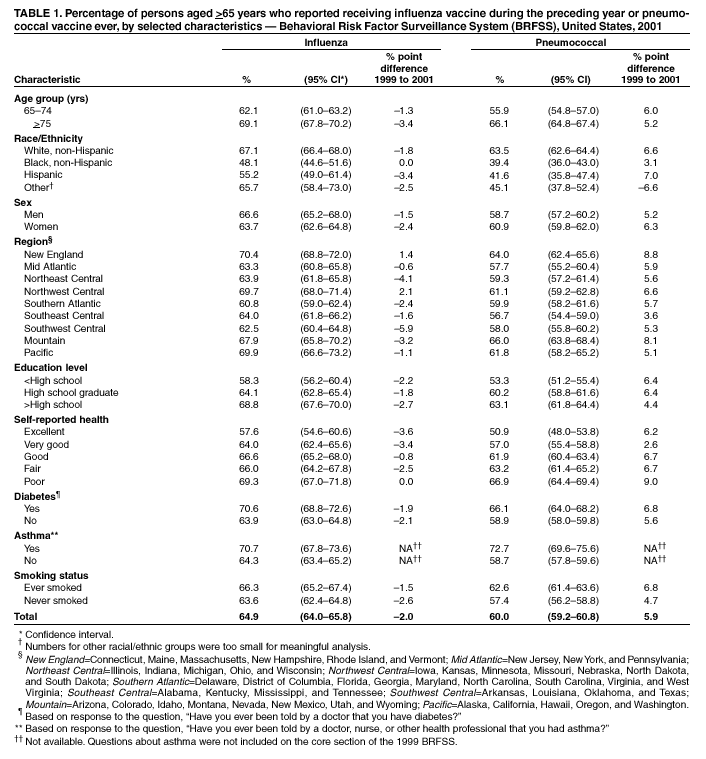 Return to top. Table 2  Return to top. Table 3  Return to top.
Disclaimer All MMWR HTML versions of articles are electronic conversions from ASCII text into HTML. This conversion may have resulted in character translation or format errors in the HTML version. Users should not rely on this HTML document, but are referred to the electronic PDF version and/or the original MMWR paper copy for the official text, figures, and tables. An original paper copy of this issue can be obtained from the Superintendent of Documents, U.S. Government Printing Office (GPO), Washington, DC 20402-9371; telephone: (202) 512-1800. Contact GPO for current prices. **Questions or messages regarding errors in formatting should be addressed to mmwrq@cdc.gov.Page converted: 11/14/2002 |
|||||||||
This page last reviewed 11/14/2002
|