|
|
Tables
 Table 1. ACSC Prevalence and Hospitalizations, California Adults Aged 18 Years or Oldera Table 1. ACSC Prevalence and Hospitalizations, California Adults Aged 18 Years or Oldera
| Characteristic |
Congestive Heart Failure, N (95% CI) |
Hypertension, N (95% CI) |
| Total prevalence |
389,839 (375,400-404,278) |
6,527,573 (6,464,510-6,590,636) |
| Percentage of population |
1.6% |
24.8% |
| Prevalence by age, y |
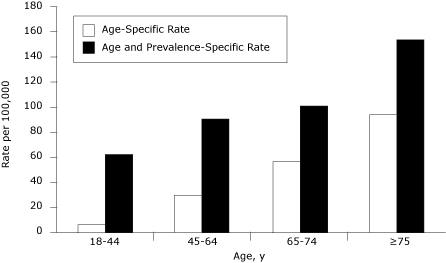
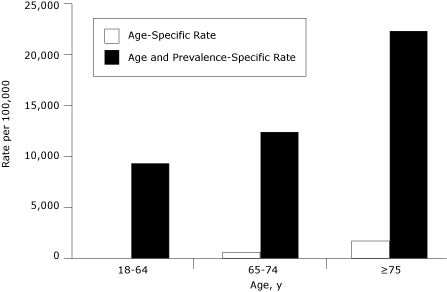
| 18-44 |
197,000 (178,494-215,506)b |
1,511,000 (1,456,354-1,565,646) |
| 45-64 |
2,730,000 (2,676,325-2,783,675) |
| 65-74 |
107,000 (97,418-116,582) |
1,123,000 (1,089,103-1,156,896) |
| ≥75 |
151,000 (140,096-161,904) |
1,164,000 (1,130,777-1,197,223) |
| Average hospitalization per year |
65,389 |
6,355 |
| Hospitalizations by age, y |
| 18-44 |
18,379b |
940 |
| 45-64 |
2,480 |
| 65-74 |
13,256 |
1,138 |
| ≥75 |
33,755 |
1,797 |
| |
Rate (95% CI) |
Rate (95% CI) |
| Crude hospitalization ratec |
248.8 (248.75-248.77) |
24.1 (24.17-24.18) |
| Prevalence-adjusted hospitalization rated |
16,773.3 (16,771.33-16,775.34) |
97.4 (97.35-97.36) |
| Age-adjusted hospitalization ratec |
270.2 (266.0-274.4) |
25.1 (24.4-25.8) |
| Age- and prevalence-adjusted hospitalization rated |
10,633.0 (9,875.7-11,390.4) |
81.5 (78.6-84.3) |
Abbreviations: ACSC, ambulatory care–sensitive conditions; OSHPD, Office of Statewide Health Planning and Development; CI, confidence interval.
a Data were pooled from the California
Health Interview Survey for 2003, 2005, and 2007 and averaged from OSHPD
discharge files for 2004, 2005, and 2006.
b Age groups 18-44 y and 45-64 y are combined for this rate because of the small prevalence of congestive heart failure in the population.
c Rate per 100,000 people in the population.
d Rate per 100,000 people reporting ACSC in the population.
Table
2. Age-Adjusted and Age- and Prevalence-Adjusted Hospitalization Rates for
Hypertension, California Adults 18 Years or Oldera,b
| County Cluster/County/Subcounty |
Hypertension |
| Age-Adjusted Rate |
Age- and Prevalence–Adjusted Rate |
| Rate (95% CI) |
Group |
Rate (95% CI) |
Group |
| California |
25.1 (24.4-25.8) |
NA |
81.5 (78.6-84.3) |
NA |
| Alameda |
21.2 (18.3-24.2) |
4 |
73.2 (59.2-87.2) |
4 |
| Butte |
25.0 (17.6-32.5) |
4 |
76.0 (45.5-106.6) |
4 |
| Contra Costa |
15.3 (12.3-18.2) |
2 |
45.1 (34.2-56.1) |
2 |
| Del Norte, Siskiyou, Lassen, Trinity, Modoc, Plumas, Sierra |
10.0 (4.9-15.2) |
1 |
34.5c (12.3-56.7) |
1 |
| El Dorado |
19.9 (12.1-27.6) |
3 |
82.6c (34.4-130.8) |
4 |
| Fresno |
17.9 (14.1-21.7) |
3 |
58.0 (43.1-72.8) |
3 |
| Humboldt |
8.6c (2.7-14.5) |
1 |
39.3c (3.7-74.9) |
1 |
| Imperial |
28.1 (17.6-38.6) |
4 |
86.0 (46.4-125.7) |
4 |
| Kern |
25.0 (20.1-30.0) |
4 |
70.8 (53.7-87.9) |
4 |
| Kings |
33.0 (19.0-47.0) |
5 |
90.8 (47.0-134.6) |
4 |
| Lake |
10.7 (3.4-18.0) |
1 |
35.0c (4.2-65.8) |
1 |
| Los Angeles SPA 1 – Antelope Valley |
43.0 (33.1-52.9) |
5 |
139.8 (100.3-179.3) |
5 |
| Los Angeles SPA 2 – San Fernando |
32.4 (29.1-35.7) |
5 |
100.6 (87.1-114.1) |
5 |
| Los Angeles SPA 3 – San Gabriel Valley |
29.9 (26.6-33.2) |
4 |
94.3 (79.5-109.0) |
5 |
| Los Angeles SPA 4 – Metro |
71.8 (64.1-79.4) |
5 |
219.9 (189.3-250.4) |
5 |
| Los Angeles SPA 5 – West Area |
13.5 (10.4-16.7) |
2 |
45.7 (30.5-60.9) |
2 |
| Los Angeles SPA 6 – South |
75.8 (66.0-85.6) |
5 |
201.6 (169.0-234.1) |
5 |
| Los Angeles SPA 7 – East Area |
35.3 (30.7-39.9) |
5 |
111.9c (93.1-130.7) |
5 |
| Los Angeles SPA 8 – South Bay |
30.9 (27.3-34.5) |
5 |
98.5c (83.5-113.5) |
5 |
| Madera |
15.3 (7.4-23.2) |
2 |
42.3c (15.1-69.6) |
1 |
| Marin |
11.1 (6.5-15.7) |
1 |
48.5 (13.6-83.4) |
2 |
| Mendocino |
6.4c (0.5-12.4) |
1 |
18.7 (0.0-42.4) |
1 |
| Merced |
18.5 (11.2-25.8) |
3 |
58.0c (29.6-86.3) |
3 |
| Monterey |
20.5 (15.1-26.0) |
4 |
77.6c (48.2-107.0) |
4 |
| Napa |
13.1c (6.1-20.2) |
2 |
43.5 (10.2-76.8) |
2 |
| Nevada |
17.4c (9.1-25.7) |
3 |
78.2c (7.0-149.4) |
4 |
| Orange |
25.2 (22.7-27.7) |
4 |
85.6 (73.3-97.8) |
4 |
| Placer |
10.9 (6.7-15.1) |
1 |
37.8 (17.6-58.1) |
1 |
| Riverside |
27.3 (24.3-30.3) |
4 |
88.2c (75.0-101.4) |
4 |
| Sacramento |
16.7 (14.0-19.4) |
3 |
62.7 (47.1-78.3) |
3 |
| San Benito |
35.4c (14.4-56.3) |
5 |
95.4 (27.4-163.4) |
5 |
| San Bernardino |
40.1 (35.8-44.3) |
5 |
117.4 (102.3-132.5) |
5 |
| San Diego Region 1--North Coastal |
13.4 (9.5-17.3) |
2 |
40.2 (25.7-54.7) |
1 |
| San Diego Region 2--North Central |
14.7 (10.9-18.6) |
2 |
49.2 (32.8-65.6) |
2 |
| San Diego Region 3--Central |
34.0 (26.1-41.9) |
5 |
98.2 (70.2-126.3) |
5 |
| San Diego Region 4--South |
20.0 (14.2-25.7) |
4 |
65.0 (41.0-89.1) |
3 |
| San Diego Region 5--East |
14.8 (10.6-19.0) |
2 |
50.5c (31.1-69.9) |
2 |
| San Diego Region 6--North Inland |
8.3 (5.2-11.4) |
1 |
28.4 (15.5-41.3) |
1 |
| San Francisco |
16.9 (13.6-20.2) |
3 |
63.8 (46.6-81.0) |
3 |
| San Joaquin |
34.7 (28.5-41.0) |
5 |
93.4 (73.9-112.9) |
5 |
| San Luis Obispo |
5.7 (2.5-8.9) |
1 |
28.2 (3.0-53.3) |
1 |
| San Mateo |
15.5 (11.9-19.1) |
2 |
43.2 (29.9-56.5) |
2 |
| Santa Barbara |
11.7 (7.8-15.7) |
1 |
43.3 (23.2-63.5) |
2 |
| Santa Clara |
14.2 (12.0-16.5) |
2 |
49.9 (39.5-60.2) |
2 |
| Santa Cruz |
16.0 (9.8-22.2) |
2 |
56.5 (27.5-85.5) |
3 |
| Shasta |
17.6 (10.8-24.3) |
3 |
56.6 (28.5-84.7) |
3 |
| Solano |
17.3 (12.2-22.3) |
3 |
51.5c (33.2-69.8) |
2 |
| Sonoma |
7.8 (4.9-10.7) |
1 |
30.1 (13.6-46.6) |
1 |
| Stanislaus |
19.6 (14.5-24.7) |
3 |
56.4c (39.8-73.1) |
3 |
| Sutter, Yuba |
24.4 (14.9-33.9) |
4 |
68.9 (36.4-101.5) |
4 |
| Tehama, Glenn, Colusa |
17.1 (8.2-26.0) |
3 |
57.9c (20.2-95.6) |
3 |
| Tulare |
17.5 (12.1-22.9) |
3 |
51.5 (33.1-70.0) |
2 |
| Tuolumne, Calaveras, Amador, Inyo, Mariposa, Mono, Alpine |
14.3 (8.3-20.3) |
2 |
55.7 (20.8-90.7) |
3 |
| Ventura |
20.4 (16.4-24.4) |
4 |
65.9 (49.0-82.8) |
3 |
| Yolo |
9.5 (3.9-15.1) |
1 |
38.5 (12.9-64.2) |
1 |
Abbreviations: CHIS, California Health Interview Survey; OSHPD, Office of Statewide Health Planning and Development; CI, confidence interval;
NA, not applicable.
a Rates are per 100,000 people; Group 1 = lowest rate, Group 5 = highest rate.
b Data were pooled from the California
Health Interview Survey for 2003, 2005, and 2007 and averaged from OSHPD
discharge files for 2004, 2005, and 2006.
c Rates are unstable estimates with a coefficient of variance of more than 30%.
Table 3. Age-Adjusted and Age-
and Prevalence-Adjusted Hospitalization Rates for Congestive Heart Failure, California Adults Aged
18 Years or Oldera,b
| County Cluster/County/Subcounty |
Congestive Heart Failure |
| Age-Adjusted Rate |
Age- and Disease Prevalence-Adjusted Rate |
| Rate (95% CI) |
Group |
Rate (95% CI) |
Group |
| CALIFORNIA |
270.2 (266.0-274.4) |
NA |
10,633.0 (9,875.7-11,390.4) |
NA |
| Alameda |
302.2 (279.5-324.9) |
4 |
11,322.5 (7,690.6-14,954.4) |
4 |
| Butte |
271.6 (238.9-304.2) |
4 |
9,497.9 (4,102.5-14,893.3) |
3 |
| Contra Costa |
236.6 (215.6-257.6) |
3 |
11,103.2 (6,375.9-15,830.5) |
3 |
| Del Norte, Siskiyou, Lassen, Trinity, Modoc, Plumas, Sierra |
174.4 (149.4-199.5) |
1 |
6,524.5c (1,776.5-11,272.6) |
1 |
| El Dorado |
203.5 (168.7-238.3) |
2 |
8,124.1 (4,445.2-11,802.9) |
2 |
| Fresno |
325.4 (286.3-364.5) |
5 |
24,644.1c (7,657.9-41,630.2) |
5 |
| Humboldt |
224.7 (184.8-264.6) |
2 |
8,367.9 (4,707.3-12,028.4) |
2 |
| Imperial |
315.6 (264.7-366.5) |
4 |
11,415.4 (5,413.9-17,417.0) |
4 |
| Kern |
316.0 (277.4-354.6) |
4 |
8,233.9c (2,509.6-13,958.2) |
2 |
| Kings |
305.1 (247.4-362.9) |
4 |
13,014.2 (7,297.9-18,730.5) |
4 |
| Lake |
188.9 (153.9-223.9) |
1 |
7,836.9 (3,340.8-12,333.0) |
1 |
| Los Angeles SPA 1 – Antelope Valley |
399.8 (346.4-453.1) |
5 |
11,294.3 (5,223.8-17,364.8) |
3 |
| Los Angeles SPA 2 – San Fernando |
280.1 (259.0-301.3) |
4 |
11,548.7 (7,947.7-15,149.8) |
4 |
| Los Angeles SPA 3 – San Gabriel Valley |
285.9 (266.3-305.5) |
4 |
12,520.9 (8,780.9-16,260.8) |
4 |
| Los Angeles SPA 4 – Metro |
392.5 (356.9-428.1) |
5 |
15,643.3 (10,340.2-20,946.4) |
5 |
| Los Angeles SPA 5 – West Area |
159.3 (141.8-176.7) |
1 |
17,293.6c (2,270.7-32,316.5) |
5 |
| Los Angeles SPA 6 – South |
539.1 (483.7-594.5) |
5 |
17,756.4 (8,623.5-26,889.3) |
5 |
| Los Angeles SPA 7 – East Area |
290.8 (265.0-316.7) |
4 |
13,957.8 (7,276.6-20,639.0) |
4 |
| Los Angeles SPA 8 – South Bay |
259.0 (240.3-277.8) |
3 |
10,761.9 (6,133.3-15,390.5) |
3 |
| Madera |
260.7 (219.0-302.5) |
3 |
7,813.2 (4,693.9-10,932.5) |
1 |
| Marin |
181.6 (156.2-207.1) |
1 |
7,872.5 (4,773.2-10,971.8) |
1 |
| Mendocino |
221.2 (177.1-265.3) |
2 |
9,182.2 (4,078.7-14,285.7) |
2 |
| Merced |
326.9 (279.2-374.7) |
5 |
12,081.6 (6,226.1-17,937.1) |
4 |
| Monterey |
229.6 (198.3-260.9) |
3 |
6,198.8 (4,213.8-8,183.8) |
1 |
| Napa |
216.7 (181.5-252.0) |
2 |
7,245.5 (3,891.1-10,599.9) |
1 |
| Nevada |
159.2 (130.1-188.3) |
1 |
6,615.4c (1,968.3-11,262.4) |
1 |
| Orange |
249.2 (232.6-265.9) |
3 |
10,249.1 (7,488.3-13,009.9) |
3 |
| Placer |
196.3 (169.9-222.7) |
1 |
10,179.4c (553.0-19,805.7) |
3 |
| Riverside |
258.3 (242.4-274.3) |
3 |
7,878.7 (5,762.3-9,995.2) |
2 |
| Sacramento |
276.6 (256.3-296.9) |
4 |
9,406.0 (6,726.6-12,085.4) |
3 |
| San Benito |
252.3 (175.2-329.3) |
3 |
16,730.9c
(0.0-34,669.1) |
5 |
| San Bernardino |
344.4 (318.2-370.5) |
5 |
12,775.2 (9,302.0-16,248.3) |
4 |
| San Diego Region 1 – North Coastal |
191.8 (166.8-216.7) |
1 |
9,031.6 (3,106.7-14,956.5) |
2 |
| San Diego Region 2 — North Central |
189.2 (161.1-217.3) |
1 |
10,827.0 (4,899.0-16,754.9) |
3 |
| San Diego Region 3 — Central |
419.9 (347.5-492.3) |
5 |
14,329.7 (8,129.2-20,530.1) |
4 |
| San Diego Region 4 — South |
357.0 (295.4-418.5) |
5 |
12,834.5 (6,621.3-19,047.6) |
4 |
| San Diego Region 5 — East |
198.7 (171.3-226.1) |
2 |
3,742.7 (2,623.8-4,861.6) |
1 |
| San Diego Region 6 — North Inland |
186.5 (159.7-213.2) |
1 |
7,352.9c (2,524.6-12,181.1) |
1 |
| San Francisco |
233.1 (207.2-258.9) |
3 |
21,102.1c (1,439.7-40,764.6) |
5 |
| San Joaquin |
366.2 (323.2-409.2) |
5 |
25,314.9 (14,549.8-36,080.1) |
5 |
| San Luis Obispo |
167.2 (142.5-191.9) |
1 |
8,056.2 (3,734.7-12,377.6) |
2 |
| San Mateo |
203.9 (178.7-229.1) |
2 |
12,556.0c (4,385.9-20,726.0) |
4 |
| Santa Barbara |
200.3 (172.8-227.8) |
2 |
16,261.1c (0.0-33,121.7) |
5 |
| Santa Clara |
208.3 (190.1-226.5) |
2 |
16,988.8 (10,321.0-23,656.6) |
5 |
| Santa Cruz |
270.5 (226.6-314.4) |
3 |
30,677.6c (0.0-73,032.0) |
5 |
| Shasta |
240.7 (210.3-271.1) |
3 |
11,044.1 (5,026.7-17,061.5) |
3 |
| Solano |
298.0 (257.8-338.3) |
4 |
8,132.8 (6,096.5-10,169.0) |
2 |
| Sonoma |
197.3 (171.8-222.9) |
1 |
8,153.6 (4,636.3-11,670.8) |
2 |
| Stanislaus |
337.0 (295.6-378.3) |
5 |
9,800.9 (5,678.4-13,923.4) |
3 |
| Sutter, Yuba |
318.9 (274.6-363.2) |
5 |
16,974.0 (9,275.1-24,673.0) |
5 |
| Tehama, Glenn, Colusa |
258.4 (215.3-301.5) |
3 |
8,172.2 (3,872.2-12,472.2) |
2 |
| Tulare |
313.9 (273.6-354.2) |
4 |
10,150.5 (5,832.6-14,468.4) |
3 |
| Tuolumne, Calaveras, Amador, Inyo, Mariposa, Mono, Alpine |
209.2 (180.4-237.9) |
2 |
5,949.4 (2,827.0-9,071.7) |
1 |
| Ventura |
222.9 (194.3-251.6) |
2 |
7,906.9c (2,494.9-13,318.8) |
2 |
| Yolo |
221.7 (182.5-260.9) |
2 |
6,356.6 (3,290.6-9,422.6) |
1 |
Abbreviations: CHIS; California Health Interview Survey; OSHPD, Office of Statewide Health Planning and Development; CI, confidence interval.
a Rates are per 100,000 individuals; Group 1 = lowest rate, Group 5 = highest rate.
b Data were pooled from the California Health
Interview Survey for 2003, 2005, and 2007 and averaged from OSHPD discharge
files for 2004, 2005, and 2006.
c Rates are unstable estimates with a coefficient of variance of more than 30%.
Back to top
Appendices
Appendix A. Measures for Ambulatory Care–Sensitive Conditions from OSHPD and CHIS
Data
| ACS Condition |
Hospitalizationsa by ICD-9-CM Codes
(OSHPD Principal Diagnosis) |
Disease Prevalence (CHIS Self-Report) |
| Congestive heart failure (PQI #8) |
428, 402.01, 402.11, 402.91, 518.4
Age groups: 18-64, 65-74, and ≥75 y
|
Adults who reported ever having been diagnosed with congestive heart failure by a doctor. |
| Hypertension (PQI #7) |
401.0, 401.9, 402.00, 402.1, 402.9
Age groups: 18-44, 45-64, 65-74, and ≥75 y
|
Adults who reported ever having been diagnosed with high blood pressure or hypertension by a doctor. |
Abbreviations: OSHPD, Office of Statewide Health Planning and Development; CHIS, California Health Interview Survey; ICD-9-CM, International Classification of Diseases, Ninth Revision, Clinical Modification.
a California hospitals include general acute care hospitals, acute psychiatric hospitals, chemical dependency recovery hospitals, and psychiatric health facilities. Excludes transfer from a hospital (different facility), a skilled nursing facility or intermediate care facility, or another health care facility; and MDC 14 (pregnancy). Only 1 hospital record was used for patients who had multiple hospital admissions for the same principle diagnosis per year.
Appendix B. Methods for Calculating Hospitalization Rates and Data Sources
| Standard Methods |
1. Crude Hospitalization Rate
|
Total # Hospitalizations in County |
|
Total # People in County |
Numerator: OSHPD data 2004-2006
Denominator: CHIS data, 2005 population estimates
Variance =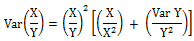
|
2. Age-Adjusted Hospitalization Rate
|
∑[Age–Specific Rates (Age Group 1) X (Standard Population
(Age Group 1)] |
|
Total # People in Standard Population |
Age-Specific Rates =
|
[Total # Hospitalizations in County (Age Group 1)] |
|
[Total # People in County (Age Group 1)] |
Age- and Prevalence-Specific Rate Numerator: OSHPD data 2004-2006
Age- and Prevalence-Specific Rate Denominator: CHIS data (2003, 2005, 2007)
disease prevalence estimates
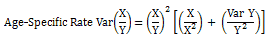
Variance = Sum of the age-specific rate variances
|
| Methods That Incorporate Disease Prevalence |
3. Prevalence-Adjusted Hospitalization Rate
|
Total # Hospitalizations in County |
|
Total # People Reporting ACS Condition in County |
Numerator: OSHPD data, 2004-2006
Denominator: CHIS pooled data (2003, 2005, 2007) disease prevalence estimates
Variance =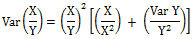
|
4. Age- and Prevalence-Adjusted Hospitalization Rate
|
∑[Age- and Prevalence–Specific Rates (Age Group 1) X (Standard Population
(Age Group 1)] |
|
Total # People in Standard Population |
Age- and Prevalence-Specific Rates =
|
Total # Hospitalizations in County (Age Group 1) |
|
[Total # People Reporting ACS Condition in County (Age Group 1)] |
Standard Population: US Census 2000 population
Age- and Prevalence-Specific Rate Numerator: OSHPD Data 2004-2006
Age- and Prevalence-Specific Rate Denominator: CHIS Data (2003, 2005, 2007)
Disease Prevalence Estimates
Variance = Sum of the age-specific rate variances
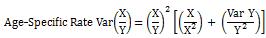
|
Abbreviations: OSHPD, Office of Statewide Health Planning and Development; CHIS,
California Health Interview Survey; ACS, ambulatory care sensitive.
Back to top
|
|