
|
|
Volume
7: No. 3, May 2010
ORIGINAL RESEARCH
Changes in Receiving Preventive Care Services Among US Adults With Diabetes, 1997-2007
Carmen D. Harris, MPH; Liping Pan, MD, MPH; Qaiser Mukhtar, PhD
Suggested citation for this article: Harris CD, Pan L, Mukhtar Q. Changes in receiving preventive care services among US adults with diabetes, 1997-2007. Prev Chronic Dis 2010;7(3):A56.
http://www.cdc.gov/pcd/issues/2010/
may/09_0089.htm. Accessed [date].
PEER REVIEWED
Abstract
Introduction
Diabetes is a chronic disease that requires complex continuing medical care and patient self-management to reduce the risk of long-term complications. Receipt of multiple recommended preventive care services can prevent or delay diabetes-related complications such as blindness and lower-extremity amputations.
Methods
We analyzed 1997 and 2007 Behavioral Risk Factor Surveillance System data to examine change in rates of adults with diabetes receiving 4 essential preventive care services (influenza and pneumococcal
vaccinations and annual foot and eye examinations).
Results
The overall age-adjusted rate of receiving all 4 of the preventive care services was 10% in 1997 but increased to 20% in 2007. Rates for receiving all 4 services increased significantly in all demographic subgroups except Hispanics.
Conclusion
Use of preventive care services is increasing, but most US adults with diabetes do not meet recommendations, and the problem is particularly pronounced among Hispanics. The need to receive preventive care services should continue to be emphasized in clinical and community settings to increase the percentage of adults with diabetes who receive them.
Back to top
Introduction
In 2007, 23.6 million people, or nearly 8% of the US population, were estimated to have diabetes (1). Diabetes is a chronic disease that requires complex, continuing medical care and patient self-management to reduce the risk of long-term complications (2). These complications include cardiovascular disease, kidney disease, neuropathy, blindness, and lower-extremity amputation (3). To reduce the risk of these complications, the American Diabetes Association (ADA) recommends
multiple preventive care services, such as self-monitoring blood glucose levels, annual foot and dilated eye examinations, and vaccinations as standards of continuing care for those diagnosed with diabetes (2). Similarly, Healthy People 2010 includes objectives to improve the proportion of adults with diabetes who receive annual foot and eye examinations, annual influenza vaccination, and at least 1 pneumococcal vaccination in their lifetimes (4).
Only 4 of 10 US adults with diabetes report receiving multiple preventive care services (5). Past studies have also found racial and ethnic disparities in use of preventive care services among adults with diabetes (6-8). To assess changes in rates of receiving comprehensive preventive care among US adults with diabetes, we analyzed Behavioral Risk Factor Surveillance System (BRFSS)
data from 1997 through 2007 on receipt of influenza and pneumococcal
vaccinations and annual foot and eye examinations.
Back to top
Methods
BRFSS is an ongoing state-based, random-digit-dialed telephone survey of the noninstitutionalized US civilian population aged 18 years or older. The survey is conducted in all 50 states, the District of Columbia, and 3 US territories. We defined people with diabetes as respondents who answered yes to the question, “Have you ever been told by a doctor that you have diabetes?” We excluded women who reported having diabetes only during pregnancy and respondents who reported prediabetes or
borderline diabetes. Respondents who answered at least 1 to the question, “About how many times in the past 12 months has a health professional checked your feet for any sores or irritations?” were defined as having received a foot examination. Respondents who answered “within the past month” or “within the past year” to the question “When was the last time you had your eyes examined by any doctor or eye care provider?” were defined as having received an eye examination. Respondents who answered
yes to the question “During the past 12 months, have you had a flu shot?” were defined as having had an influenza vaccination. Respondents who answered yes to the question “Have you ever had a pneumonia shot?” were defined as having had a pneumococcal vaccination. We excluded
hemoglobin A1c (HbA1c) monitoring from the definition of preventive care services because of a change in the question about HbA1c that made the 1997 and 2007 data incomparable.
We used SUDAAN version 9.0.1 (RTI International, Research Triangle Park, North Carolina) and SAS version 9.1 (SAS Institute Inc, Cary, North Carolina) to analyze data. We incorporated the survey sampling design and sampling weights to make results representative of the US population. We used t tests to assess the overall changes in rates between 1997 and 2007. In addition to testing the rate difference in multiple preventive care services, we analyzed each preventive care service to
understand the rate of change in the individual service over time. We used linear regression, weighting the annual estimates by the inverse of their variances, to test for national linear trends in use of preventive care services. We considered results significant at P < .05 for t test and regression analyses. We conducted all analyses in 2008.
Back to top
Results
After adjusting for age, the overall rate of receiving all 4 preventive care services increased from 10% in 1997 to 20% in 2007
(Table). The proportion of respondents who received all 4 preventive care services increased significantly in almost all demographic subgroups. Rates increased significantly in every age group, but the largest increases were seen for people aged 65 to 74 years and those aged 75 or older. The smallest increase in any demographic category was
among Hispanics (4
percentage points), and this increase did not reach significance.
The proportion of adults with diabetes who received an annual foot examination increased from 57% in 1997 to 69% in 2007, for a modeled average annual increase of 1.2 percentage points in our linear trend analysis (P < .001) (Figure). The proportion of adults with diabetes who received pneumococcal vaccination increased from 22% in 1997 to 39% in 2007, for a modeled average annual increase of 1.9 percentage points (P = .002). We observed no significant trends in receipt of
annual eye examination or influenza vaccination (Figure).
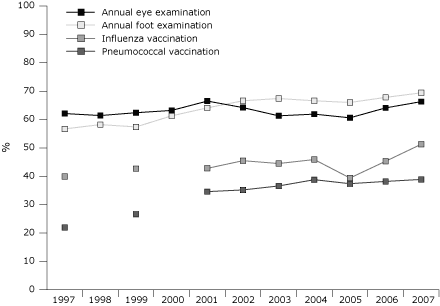
Figure. Age-adjusted rates of receiving 4 preventive care services among adults with diabetes, Behavioral Risk Factor Surveillance System, United States, 1997-2007.
Data on rates of vaccination are not available for 1998 and 2000.
[A tabular version of this figure is also available.]
Back to top
Discussion
Only a small percentage of adults with diabetes receive all the recommended preventive care services, although this percentage is increasing. From 1997 to 2007, the rate of receiving all 4 preventive care services increased significantly overall and in every demographic subgroup, with the exception of Hispanics. When each service was examined individually, rates of receiving annual foot examinations and pneumococcal vaccinations also increased significantly, although rates of receiving
annual eye examinations and influenza vaccinations did not. These observations are consistent with findings of previous studies (6-8).
Age-adjusted rate of individual preventive care practices — including
annual eye examinations, annual foot examinations, influenza vaccinations, and pneumococcal vaccinations — among people with diabetes in the United States increased from 1995 to 2001 (6). Although the findings in this report show that receipt of multiple preventive care services has increased across all races and ethnicities, a lower proportion of non-Hispanic blacks and Hispanics reported receiving all 4 preventive care
services compared with non-Hispanic whites. These results are consistent with a Medicare study that found that use of preventive care services, including HbA1c tests, lipid tests, eye examinations, and self-monitoring of blood glucose, by beneficiaries with diabetes increased from 1992 to 2001, and nonwhite beneficiaries consistently used fewer preventive care services and had higher rates of complications (7). Similarly, another study found that both black and Hispanic managed care enrollees
were less likely than whites to use preventive care services (8). Reasons for these disparities in preventive care services are unknown; however, previous studies point to factors such as differences in providers’ assumptions, beliefs, and attitudes about the patient; provider interpersonal behavior with the patient; or differences in patient-provider communication, which may lead to a less active patient who does not request preventive services during a visit (9,10).
Two previous reports have used similar methods of combining 1 or more of the ADA recommended standards of care to develop the measure of “multiple preventive care services” as a means to assess preventive care practices among adults with diabetes. Using 1994 BRFSS data, Beckles et al combined 5 of the ADA recommended preventive care measures (self-monitoring blood glucose, awareness of HbA1c, visits to a health care provider in the last year, annual foot inspection by a health care provider,
and annual dilated eye examination) and found only 2.6% of insulin users reported all 5 in the previous year (11). From 2002-2004 BRFSS data, Mukhtar et al combined 3 of the ADA recommended preventive care measures (annual dilated eye examination, annual foot examination by a health care provider, and 2 or more HbA1c tests by a health care provider) and found that 39.5% of adults with diabetes reported receiving all 3 preventive care services in the previous year (5). Compared with our study
and the one by Mukhtar et al, Beckles et al analyzed more preventive care services and a smaller subpopulation of adults with diabetes to asses the use of preventive care services, but all 3 reports conclude that most adults with diabetes do not meet recommendations for standards of diabetes care.
Both public and private efforts, campaigns, and interventions on the local, state, and national levels to improve preventive care services are ongoing. The Centers for Disease Control and Prevention (CDC) has implemented multiple public health strategies to improve rates of annual foot and eye examination and influenza and pneumococcal vaccination, including initiating the diabetes national objectives in 1999 (12). CDC also supports 59 state and territorial diabetes prevention and control
programs that work with both private and public health partners to improve quality diabetes care. Since 1997, the National Institutes of Health and CDC have sponsored the National Diabetes Education Program, whose goal is to reduce the morbidity and mortality caused by diabetes and its complications (13). The coordinated efforts of these organizations and other state and local campaigns may have increased the use of multiple preventive care services in the last 11 years.
The findings in this report are subject to several limitations. Adults living in long-term care facilities or in households without landline telephones are not included in BRFSS surveys; thus, these results do not reflect the entire US population. The results were not adjusted for insurance status, which may have altered some of the findings, particularly for Hispanics. BRFSS data are self-reported and subject to recall bias; therefore, use of preventive care services may have been
underreported or overreported. The extent to which reporting bias could affect these results is unknown. Nonetheless, validation studies have indicated that self-reported diabetes and receipt of dilated eye examinations and influenza vaccination are highly accurate (14-16).
In conclusion, although the percentage of adults with diabetes who receive preventive care services doubled from 1997 to 2007, 80% of patients did not meet ADA recommendations for continuing care, and racial/ethnic disparities persist among those who receive care. Affordability of care is often cited as an issue, but 92% of people with diabetes have some form of health insurance coverage (17). Further investigation should be undertaken to determine 1) why the rates of
annual foot examination and
pneumonia vaccination remain higher than rates of annual eye examination and influenza vaccination, 2) why so few adults with diabetes meet multiple preventive care recommendations, and 3) why the Hispanic population seems to receive preventive care services at a lower rate than do non-Hispanic whites and blacks. These investigations should include mixed methods — such as continued population-based surveillance of preventive care services, oversampling of Hispanic populations, and qualitative
research methods — to determine the barriers to receiving preventive care, particularly among the Hispanic populations. Finally, to increase the proportion of all people with diabetes who receive multiple preventive care services, systems-level approaches, such as use of electronic medical records and patient registries, are needed that emphasize policy and environmental changes to ensure health equity and access to and delivery of quality health care.
Back to top
Author Information
Corresponding Author: Carmen D. Harris, MPH, Centers for Disease Control and Prevention, 4770 Buford Hwy NE, Mailstop K-46, Atlanta, GA 30341-3724. Telephone: 770-488-5182. E-mail:
charris2@cdc.gov.
Author Affiliations: Liping Pan, Qaiser Mukhtar, Centers for Disease Control and Prevention, Atlanta, Georgia.
Back to top
References
- National diabetes fact sheet: general information and national estimates on diabetes in the United States, 2007. Atlanta (GA): Centers for Disease Control and Prevention; 2008.
- American Diabetes Association.
Standards of medical care in diabetes — 2009. Diabetes Care 2009;32(Suppl 1):S13-61.
- Deshpande A, Harris-Hayes M, Shootman M.
Epidemiology of diabetes and diabetes-related complications. Phys Ther 2008;88(11):1254-64.
- Healthy people 2010. Washington (DC): US Department of Health and Human Services; 2000.
- Mukhtar Q, Pan L, Jack L Jr, Murphy D.
Prevalence of receiving multiple preventive-care services among adults with diabetes — United States, 2002-2004. MMWR Morb Mortal Wkly Rep 2005;54(44):1130-3.
- Lojo J, Burrows NR, Geiss LS, Tierney EF, Wang J, Engelgau MM.
Preventive care services among persons with diabetes — United States, 1995 and 2001. MMWR Morb Mortal Wkly Rep 2002:51(43):965-9.
- Kuo S, Fleming B, Gittings N, Han L, Geiss L, Engelgau M, et al.
Trends in care practices and outcomes among Medicare beneficiaries with diabetes. Am J Prev Med 2005;29(5):396-403.
- Oster N, Welch V, Schild L, Gazmararian J, Rask K, Spettell C.
Differences in self-management behaviors and use of preventive services among diabetes management enrollees by race and ethnicity. Dis Manag 2006:9(3):167-75.
- van Ryn M. Research on the provider contribution to race/ethnicity disparities in medical care. Med Care 2002;40(1 Suppl):I140-51.
- Johnson RL. Patient race/ethnicity and quality of patient-physician communication during medical visits. Am J Public Health 2004;94(12):2084-90.
- Beckles G, Engelgau M, Narayan K, Herman W, Aubert R, Williamson D.
Population-based assessment of the level of care among adults with diabetes in the US. Diabetes Care 1998;21(9):1432-8.
- Mukhtar Q, Jack L Jr, Martin M, Murphy D, Rivera M. Evaluating progress toward Healthy People 2010 national diabetes objectives. Prev Chronic Dis 2006;3(1).
http://www.cdc.gov/pcd/issues/2006/jan/05_0122.htm. Accessed January 14, 2009.
- Gavin JR. Changing the way diabetes is treated with information and resources. Clin Diabetes 2006;24(1):14-6.
- Will JC, German RR, Schuman E, Michael S, Kurth DM, Deeb L.
Patient adherence to guidelines for diabetic eye care: results from the Diabetic Eye Disease Follow-Up Study. Am J Public Health 1994;84(10):1669-71.
- Fowles J, Rosheim K, Fowler E, Craft C, Arrichiello L.
The validity of self-reported diabetes quality of care measures. Int J Qual Health Care 1999;11(5):407-12.
- MacDonald R, Baken L, Nelson A, Nichol KL.
Validation of self-report of influenza and pneumococcal vaccination status in elderly outpatients. Am J Prev Med 1999;16(3):173-7.
- Diabetes in America. 2nd edition. Washington (DC): National Institutes of Health; 1995.
Back to top
|
|
