
|
|
Volume 4: No.
4, October 2007
ORIGINAL RESEARCH
Cost Analysis of Screening
for, Diagnosing, and Staging Prostate Cancer Based on a Systematic Review of
Published Studies
Donatus U. Ekwueme, PhD, Leonardo A. Stroud, MD, MPH, Yanjing Chen, PhD
Suggested citation for this article: Ekwueme DU, Stroud LA,
Chen Y. Cost analysis of
screening for, diagnosing, and staging prostate cancer based on a systematic
review of published studies. Prev Chronic Dis 2007;4(4).
http://www.cdc.gov/pcd/issues/2007/
oct/06_0051.htm.
Accessed [date].
PEER REVIEWED
Abstract
Introduction
The reported estimates of the economic
costs associated with prostate cancer screening, diagnostic testing, and
clinical staging are substantial. However, the resource costs (i.e., factors
such as physician’s time, laboratory tests, patient’s time away from work)
included in these estimates are unknown. We examined the resource costs for
prostate cancer screening, diagnostic tests, and staging; examined how these costs
differ in the United States from costs in other industrialized countries; and
estimated the cost per man screened for prostate cancer,
per man given a diagnostic test, and per man given a clinically staged diagnosis
of this disease.
Methods
We searched the electronic databases MEDLINE, EMBASE, and CINAHL for articles and reports on prostate cancer published from January 1980 through December 2003. Studies were selected
according to the following criteria: the article was published in English; the
full text was available for review; the study reported
the resource or input cost data used to estimate the cost of prostate cancer
testing, diagnosing, or clinical staging; and the study was conducted in an established market economy.
We used descriptive statistics, weighted mean, and Monte Carlo simulation
methods to pool and analyze the abstracted data.
Results
Of 262 studies examined, 28 met our selection criteria (15 from the United States and 13 from other industrialized countries). For studies conducted in the United States, the pooled
baseline resource cost was $37.23 for screening with prostate-specific antigen (PSA) and $31.77 for
screening with digital rectal examination (DRE). For studies conducted in other industrialized countries, the pooled baseline resource
cost was $30.92 for screening with PSA and $33.54 for DRE. For diagnostic and staging methods, the variation in the resource costs between the United States and other industrialized countries
was mixed.
Conclusion
Because national health resources are limited, a decision about whether to
invest in early detection of prostate cancer requires an understanding of the
factors included in estimates of the economic cost of this disease. This study
may benefit health policy makers charged with allocating resources for prostate cancer.
Back to top
Introduction
Prostate cancer is the second most common cancer among men worldwide and the fifth most common cancer in the world (1,2). Among developed countries, the age-adjusted death rate for prostate cancer is highest in Sweden, with an estimated rate of 27.7 per 100,000 men, and lowest in Japan, with an estimated rate of 5.7 per 100,000
men (3). The United States falls between these two extremes, with an
estimated rate of 15.8 per 100,000 men.
The U.S. Preventive Services Task Force (USPSTF) (www.ahrq.gov/clinic/uspstf.htm) recommends screening tests for early detection of breast, colorectal, and cervical cancers, but
screening for prostate cancer remains controversial (4-6). Factors contributing to the controversy include the lack of conclusive scientific evidence demonstrating the effectiveness of screening in reducing mortality associated with prostate cancer (6)
and the absence of an international consensus about routine screening (7,8). Nevertheless,
screening for this disease is widespread (6). For example, in 2000, between 34% and 61% of U.S. men aged 50 years
or older reported having a prostate-specific antigen (PSA) test within the
previous year (9,10,11).
The reported economic costs associated with screening for prostate cancer are substantial and vary widely. For example,
in 1995 Barry and colleagues estimated the cost to Medicare of first-year PSA testing for men aged 65 to 79 years
as $2.1 billion (12).
In 1994 Lubke and colleagues estimated the costs of a first-year national testing program using PSA and digital rectal
examination (DRE) for men aged 50 to 69 years to range from $17.6 to $25.7 billion (13). In 1990 Optenberg and Thompson estimated the costs of a first-year mass
screening program for men aged 50
through 74 years to range from $11 to $28 billion (14). Often, researchers do not provide the components of the resource costs (i.e., factors such as
physician’s time, laboratory tests, patient’s time away from work) used to
estimate the economic cost of prostate cancer. When resource costs are provided, they are often presented without an explanation
as to the types of resources used in calculations or how these resources were measured or valued. It is not possible to determine whether the reported cost of
screening includes the
costs associated with patients’ travel time, time off from work, loss of leisure time, transportation, physicians’ consultation time,
other medical staff time, medical supplies, office or room space, equipment, and patient recruitment. As a result, the costs
reported from economic studies of prostate cancer vary widely.
We reviewed the published articles from 1980 to 2003 in order to summarize
publicly available data on the resource costs used in estimating the economic
effects of prostate cancer. These resource costs are needed to estimate the economic cost of the disease
accurately. We examined the resource costs of
prostate cancer screening, diagnosing, and staging; examined how resource costs
differ in the United States from the costs in other countries; and estimated a cost per man
screened for prostate cancer, per man given a diagnostic test,
and per man given a clinically staged diagnosis of the disease.
Back to top
Methods
Search and selection processes
We searched the following computerized electronic databases for articles published from January 1980 through December 2003: MEDLINE (1980–2003), EMBASE (1980–2003), and CINAHL (1983–2003). Our search terms included prostatic neoplasms, prostate cancer, prostate-specific antigen, digital rectal examination, transrectal ultrasound, biopsy, cost, cost analysis,
cost-benefit analysis, and economic cost. We manually searched the bibliographies of retrieved articles and reports to
find additional articles.
The following were the preset inclusion criteria for the studies selected: the article was published in English; the full text was available for review; the resource or input cost data used to estimate the cost of
screening, diagnosing, or clinically staging prostate cancer were reported in the article; and the study was conducted in countries designated as established market
economies as defined by the World Bank (15).
Data extraction
From eligible articles and reports, we extracted the following data using a modified extraction method developed by the U.S. Guide to Community Preventive Services for reviews of economic evaluations (16): study characteristics (e.g.,
researcher[s], year results were published, country of study, study setting), participants’ characteristics (e.g., age, population
screened, number of biopsies
performed, whether prostate cancer was detected), and resource cost characteristics (e.g., year of cost data used in the study, currency denomination, cost components). We extracted the resource costs provided in the articles and attempted to contact
the researchers for clarification when necessary. Any uncertainty
about including data from any article was resolved by consensus of all coauthors.
Data analysis
Resource costs were separated into two categories: those found through studies
done in the
United States and those found through studies done in other industrialized countries. For each category,
we analyzed the resource costs for three evaluation methods: screening, diagnosing, and staging.
Because our interest was only in ascertaining the resource (i.e., input) costs used in calculating the cost of each
screening procedure, we identified and
pooled separately the resource costs of serum PSA, free/total PSA (F/tPSA), complex PSA (cPSA), and DRE.
For diagnostic procedures, we identified and pooled separately the resource costs of transrectal ultrasound (TRUS) and biopsy. We defined TRUS as a component of diagnostic methods.
Because TRUS is used when
results of PSA, DRE, or both are abnormal, we assumed that TRUS serves as a diagnostic procedure to
confirm the presence or absence of a prostate cancer tumor before further investigation. Biopsy procedures included core-needle, TRUS-guided, fine-needle aspiration, needle, and transrectal needle. The resource costs for performing a biopsy represented the combined resource costs of these biopsy methods.
We also included the resource costs for a urology consultation, defined as any
consultation or referral to a urologist, clinical oncologist, or any other specialist after abnormal
test results. We reported the resource costs for each diagnostic method separately and noted that a urology consultation is a process measure, not a diagnostic method per se.
For staging methods, we identified the resource costs of clinical staging procedures and pathologic or histologic analysis of specimens. For purposes of our analysis, we included in clinical staging procedures computerized tomography (CT), magnetic resonance imaging (MRI), radionuclide bone scan, pelvic lymph node excision and analysis, and pelvic echography. We also included the resource cost of
pathologic or histologic analysis of a specimen as a part of the staging method. We acknowledge that this is not a staging method but a process measure; however, these data were reported separately.
Currency conversion methods
To allow for greater comparability among studies and countries and to standardize the resource costs to 2003 U.S. dollars, we
used three conversion methods: the cost-to-charge ratio, the Consumer Price Index (CPI) for all commodities, and purchasing power parity (PPP). For the studies conducted in the United States, we used the cost-to-charge
ratio to convert resource costs reported as
charges (i.e., prices) into actual costs of providing health services (17,18).
We adjusted all resource costs to 2003 U.S. dollars
using the CPI (i.e., measure of changes in the average price of consumer goods and services) (19). For studies conducted in other countries, we used the country-specific CPI to adjust costs to 2003 country-specific currency. For example, we used the Australian CPI to update cost to 2003 Australian dollars. The CPIs for other countries were obtained from
the Organisation for Economic Co-operation and Development (20).
PPP converts currency units from other countries to U.S.
dollars to eliminate differences in price levels among countries (21). Using this method, we converted currencies of other countries to U.S.
dollars by multiplying the adjusted country-specific currency by the PPP rate for each country (22).
Measurement of resource costs used
Resource categories included direct and indirect costs. Direct costs included
the resources used in the early detection of prostate cancer, such as the physician’s consultation time, other medical staff’s time, medical supplies, office or room space, equipment,
and patient recruitment. Indirect costs included the patient’s loss of income
from time off from work, loss of leisure time, transportation cost, and travel time.
We wrote this article from the societal perspective (17); that is, all identified direct and indirect resource costs for prostate cancer prevention are taken into account, regardless of who might pay for them.
Statistical analysis
We obtained pooled standardized resource costs by using standard descriptive statistics. We estimated
the cost per man screened and given a
clinically staged diagnosis of prostate cancer by using the
weighted mean method (23). For screening methods, the weighted mean cost per man
screened was computed by multiplying the standardized resource cost from each
study by the corresponding number of men screened, summing this product, and dividing by
the total number screened. This is expressed as
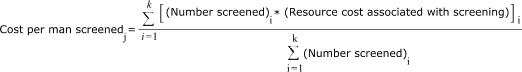
where j = screening methods (i.e., PSA, F/tPSA, cPSA, and DRE); Σ = summation; i
= each study; k = number of studies, and number tested = the
number of men screened for prostate cancer. We used the same approach for diagnostic
testing and staging methods. We computed 95% confidence intervals (CIs) for the weighted mean cost estimates.
Sensitivity analysis
We conducted multivariate sensitivity analyses using the Monte Carlo simulation method to appraise uncertainty in the pooled resource costs (24,25). We fitted probability distributions to the resource cost data from the studies included in each evaluation method. Using the fitted distributions, we performed simulations using @Risk software (Palisade Corporation,
Newfield, New York), which uses Monte Carlo sampling methods. We performed 1000 independent simulation trials. On each simulation trial, a value for each parameter was drawn from its associated distribution and stored for subsequent analysis. The results from the simulations are presented as means with 95% CIs and medians with 25th and 75th percentiles. The 95% CIs
from the simulation were calculated as

Back to top
Results
Descriptive results
We identified 262 studies, of which 28 met all inclusion criteria (Figure 1).
Among these studies, 15 (53.6%) were from the United States (14,26-39), 4
(14.3%) from Canada (40-43), 4 (14.3%) from Sweden (44-47), 3 (10.7%) from the United Kingdom (48-50), 1
(3.6%) from Australia (51), and 1 (3.6%) from Japan (52). For studies conducted in the United States, the number
of men screened ranged from 564 to 19.1 million; the number of biopsies performed ranged from 23 to 3.4 million; and the participants’ ages ranged from 40 to 75 years
(Table 1). For studies conducted in other
industrialized countries, the number of men
screened ranged from 472 to
533,402; the number of biopsies performed ranged from 29 to 45,873; and the participants’ ages ranged from 40 to 93
years. A summary of the standardized resource costs for each screening method is in
Table 2. Among these studies, only one conducted in the United States reported
the resource cost of screening with F/t PSA and cPSA (39).
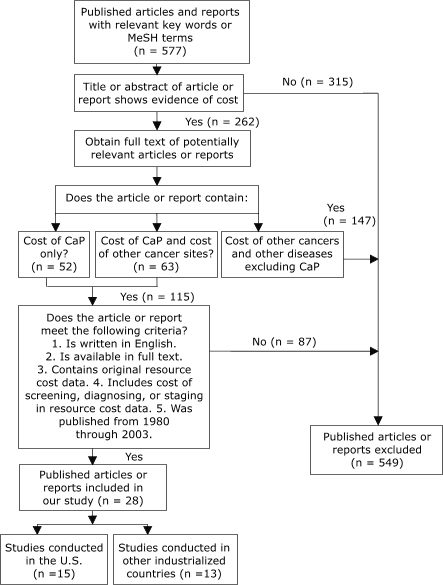
Figure 1. Study selection process, Cost Analysis of
Screening for, Diagnosing, and Staging Prostate Cancer, 1980–2003. CaP indicates prostate cancer;
MeSH, medical subject headings. [A text description of this chart is also available.]
Baseline results
For studies conducted in the United States, the pooled baseline resource cost for
screening with PSA obtained from 13
studies was $37.23, and the pooled
baseline resource cost for screening with DRE obtained from eight studies was
$31.77 (Table 3). For studies conducted in other countries, the pooled baseline resource cost for
screening with PSA from 10 studies was $30.92, and the pooled baseline resource cost for
screening with DRE obtained from eight studies was $33.54.
For diagnostic tests and staging methods, the variations in the resource costs between the United
States and other countries were mixed. The pooled baseline resource costs
were 2.3 times higher for TRUS and 2.4 times higher for biopsy in the United States than in other countries. The pooled baseline resource cost of a urology consultation was 1.3 times higher in other countries than in the United States. For clinical staging, the
pooled baseline resource cost was 2.4 times higher in the United States than in other countries, but
the pooled baseline costs for pathologic or histologic specimen analysis was 1.4 times higher in other countries.
For studies conducted in the United States, the
weighted mean cost per man screened with PSA was $40.61 (95% CI, $40.48–$40.74),
compared with $34.82 (95% CI, $34.60–$35.05) for studies conducted in other
countries (Figure 2). For diagnostic methods (Figure 3), the mean cost per man
was $347.24 (95% CI, $347.05–$347.44) for U.S. studies compared with $292.51 (95% CI,
$292.24–$292.78) for non-U.S. studies. For clinical staging methods (Figure 4), the
mean cost per man given a clinically staged diagnosis of prostate cancer was $322.11 (95% CI, $321.87–$322.34) for U.S. studies compared with $222.81 (CI,
$222.44–$223.19) for non-U.S. studies. The cost per analysis of pathologic
or histologic specimens was 3.5
times higher in other countries than in the United States.
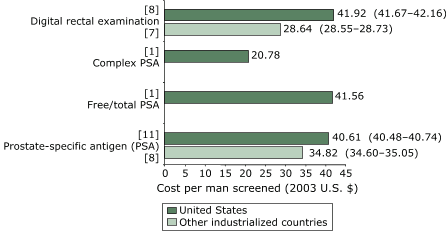
Figure 2. Weighted mean cost (in 2003 U.S. dollars) per man
screened for prostate cancer, by
type of screening method. Numbers in brackets are the
number of studies that reported on each testing method. Numbers in
parentheses are 95% confidence intervals.
Only U.S. studies reported costs for
complex PSA or free/total PSA. [A text description of this chart is also available.] 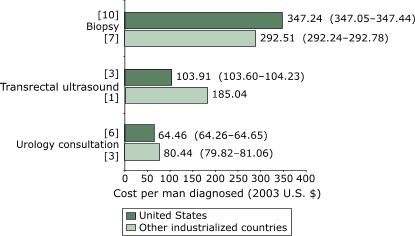
Figure 3. Weighted mean cost (in 2003 U.S. dollars) per man given a diagnostic
test for prostate cancer, by diagnostic method. Numbers in brackets
are the number of studies that reported on each method. Numbers in parentheses
are 95% confidence intervals. [A text description of this chart is also available.]
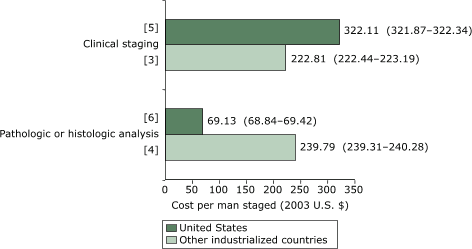
Figure 4. Weighted mean cost (in 2003 U.S. dollars) per man
given a clinically staged diagnosis of prostate cancer. Numbers in brackets
are the number of studies in each staging method. Numbers in parentheses are 95% confidence intervals. [A text description of this chart is also available.]
In the United States, from 1993 to 2002, the average resource cost of
screening with PSA decreased by $20.64 (Figure 5). In addition, from
1988 to 2002 the average resource cost for biopsy decreased by $67.23. However, the average costs for DRE, urology consultation, TRUS, pathologic or histologic analysis of a specimen, and clinical staging
increased from the 1990s. In contrast, the average resource
costs for all prostate cancer procedures or tests decreased in other
industrialized countries (Figure 6). The highest decrease observed was for
biopsy ($160.70), and the lowest was for DRE ($30.55).
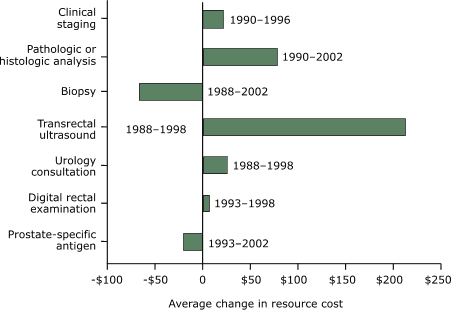
Figure 5. Average changes in resource cost by screening
test, diagnostic test, and staging of prostate cancer
according to studies conducted in the United States, in
2003 U.S. dollars. [A text description of this chart
is also available.]
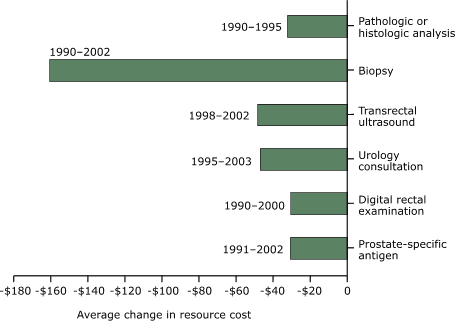
Figure 6. Average changes in resource cost, by
screening and diagnostic tests for prostate cancer
according to studies conducted in industrialized countries other than the United
States, in
2003 U.S. dollars. [A text description of this chart is also available.]
Multivariate sensitivity analyses
The results of the Monte Carlo simulations are in
Table 4. The estimated average resource costs of
screening for, diagnosing, and clinically staging prostate cancer from studies conducted in the United States and other countries do not differ much from the
baseline estimates in Table 3, and the estimated 95% CIs are tight, an indication of the robustness of the
baseline
results. There is a slight variation in the estimated average resource cost for the histologic analysis of specimens
from studies conducted in the other countries compared with the
baseline.
For studies conducted in the United States, the estimated median resource costs were $34.54 (interquartile range:
$22.91–$49.75) for
the PSA test and $234.7 (interquartile range:
$152.98–$432.67) for biopsy. These costs
vary slightly from the baseline estimates. For studies conducted in other
industrialized countries, the median cost of a urology consultation was $92.95 (interquartile range: $74.68–$114.81) and $100.56 (interquartile range: $80.92–$125.25) for TRUS. These costs do not differ substantially from the baseline estimates; however, the median cost for clinical staging
in non-U.S. countries differs substantially from baseline with an estimated resource cost of $288.25 (interquartile range:
$217.42–$380.62).
Back to top
Discussion
Both U.S. and non-U.S. studies estimated the resource costs for screening with PSA and DRE to be
greater than $30. We found little variation in the resource costs of
screening for prostate cancer between the United States and other industrialized countries; however, the resource costs
for diagnostic and staging methods were mixed. Furthermore, we found that the weighted mean cost per man
for screening for, diagnosing, and clinically staging prostate cancer varied between the United States and other industrialized countries. Over time, the changes in the average resource costs
in U.S. studies were mixed (some increased, and some decreased), but they all
decreased in studies conducted in other
industrialized countries.
In general, our findings on resource costs of testing methods are consistent
with previously published estimates. For example, in 2002 O’Malley and
colleagues
estimated the resource costs (including cost of the testing method, consumables,
and personnel) for screening to be $34 with PSA and $20 with DRE (53). When these costs were adjusted to 2003
U.S. dollars, the estimates
were close, with the exception of resource costs for DRE. Compared with the O’Malley study, our estimate of resource costs for DRE is
about 31% higher for studies conducted in the United States and 34% higher for studies conducted in other countries. One explanation for this difference could be the differences in the resource measurement used. Because DRE is performed
as part of a general physical examination, some studies included the resource cost for a physician visit as part of the cost of DRE (35,36,46).
One study estimated that the resource costs attributed to DRE were 13.3% of the total for a physician visit (36), whereas two studies assumed that the resource cost for performing DRE is zero because it is part of the routine annual physical
examination (27,34). Furthermore, our estimated resource costs for testing with PSA
were within the range of
the price ($30–$60) reported in the news media (54).
The resource costs for TRUS, biopsy, and clinical staging were at least 2.3 times higher in the United States than in other countries. This finding is consistent with the general belief that medical technology is more expensive in the United States than in other industrialized nations (55). Although medical technology may cost more in the
United States than elsewhere, the resource costs for urology consultation and pathologic or histologic analysis of specimens
are at least 1.3 times higher in other countries. For urology consultation, the differences in the resource costs may be explained by differences in the measurement of resource inputs included in the calculation. For example, four of five studies conducted in other countries
that met the inclusion criteria for urology consultation included resource costs such as telephone calls, nurse and secretary wages, and hospital visits (42,46,47,50). Other sources of variation could be differences in study settings.
Currently, the evidence is insufficient to determine whether early detection
of prostate cancer is cost-effective. The conclusions of the few studies that
reported the cost-effectiveness of prostate cancer screening vary widely
(12-14). As a result, these economic studies may not inform policy. Several
economic studies reported that costs are the major source of variation in
differing conclusions for cost-effectiveness of health interventions (56-59). A
recent workshop at the Institute of Medicine concluded that poor quality of
information on resource costs of screening procedures is a major source of the
inconsistency in results among several models of cost-effectiveness of
colorectal cancer screening (60). In 1996, the United States Panel on
Cost-Effectiveness in Health and Medicine recommended the use of resource-based cost in estimating the cost-effectiveness of health interventions (17). The purpose
of this recommendation was to promote transparency and generalizability in the use of economic evaluation results to inform policy.
The components of resource costs for early detection of prostate cancer identified in studies included
in this paper are patients’ travel time, loss of work time, loss of leisure time, transportation cost, physicians’ consultation time, other medical staff time, medical supplies, office or room space, equipment, patient recruitment, and other consumables. The range of resource costs included in a particular study depends
on the perspective of the study. Because our study took a
societal perspective, we chose all identified resource costs. We believe that the pooled resource costs reported in this article
may contribute to promoting transparency and generalizability of economic studies on prostate cancer within and
among countries.
Screening by PSA remains controversial because of the lack of scientific evidence from clinical trials demonstrating
that early detection reduces mortality. In recent years, several variations of the PSA test have been developed that may improve the test’s specificity and may reduce the biopsy rate (61-64). These newer testing technologies include free PSA, F/tPSA, cPSA,
and PSA density. Among the variations of the PSA test, we were able to find only one
U.S. study reporting F/tPSA and cPSA data that met our inclusion criteria (39). The resource costs for these two newer testing methods were $41.56 for F/tPSA and $21.78 for cPSA.
The diagnostic methods considered in our study were TRUS and biopsy. The literature reports that TRUS can be used to screen for prostate cancer, to estimate the size of the prostate, to diagnose cancer, and to guide needle biopsies (65). Although earlier studies evaluated TRUS as a tool for prostate cancer screening (27,31,32,34), it has not been shown to be an effective screening test
(66-69). Currently, TRUS is used primarily to image the prostate gland and to
guide needle biopsy. For these reasons, we defined TRUS as a diagnostic method. We also assert that this definition is a matter of formality since resource costs were reported separately and not as combined resource costs of diagnosing prostate cancer.
Biopsy is currently the gold standard method for diagnosing prostate cancer (66). Several biopsy procedures
can confirm the diagnosis of prostate cancer (7,49,64).
Therefore, we combined the resource costs of these biopsy procedures because many of the studies reviewed reported aggregated resource cost for each procedure.
The final method in the evaluation and management of prostate cancer,
clinical staging, is important because it is the first step in determining
prognosis and because it guides treatment decisions for men with an established diagnosis
of cancer. In most of the studies reviewed, the researchers used different types of clinical staging procedures. For example, Gottlieb et al used CT, MRI, and
radionuclide bone scan (36). As with biopsy, some researchers reported combined resource costs for clinical staging. Therefore, the resource cost we report is a combination of resource costs
for various procedures.
Our study has limitations. Most of these are primarily tied to the
limitations in the studies we reviewed. First, the reported resource costs were
pooled from studies conducted with different populations and in different
settings and should be interpreted with caution. However, we conducted
appropriate sensitivity analyses using Monte Carlo simulation to assess the
robustness of the baseline results. Second, PSA is used as a screening test, a diagnostic tool, and a biological marker to follow the progress of disease in
men with prostate cancer, but we did not distinguish reported resource costs for PSA among its uses. We are not sure whether this lack of distinction may have underestimated or overestimated the reported resource costs for PSA. Third,
for some studies it was
difficult to separate the resource cost of performing DRE from that of the physician visit. Because of the strong interaction, we may have overestimated resource costs for DRE. Fourth,
because reported resource costs for performing biopsy and clinical staging represented combined resource costs from several procedures,
they should
be interpreted with caution. Furthermore, reported resource costs for performing TRUS or biopsy did not include the cost of complications resulting from these procedures. It has been reported that complication costs are directly correlated to the biopsy rate (70). Gustafsson
et al suggest that the resource costs associated with complications arising from TRUS or biopsy should be reported
separately from those for diagnostic procedures (46) because the cost of complications depends on the number
of infections, which ranges from 5% to 6%, and their severity (71,72). Fifth, for studies conducted in other countries, we are not sure if the resource costs reported by some authors were costs or charges. If some resources are charges rather than costs, then the pooled resource costs
presented here for studies conducted in other countries may be lower than we
report.
Finally, identifying and measuring all the resources used in screening for, diagnosing, and clinically staging
prostate cancer is a time-consuming and expensive process. In many situations, such detailed evaluations may not be practical. Therefore, the resource cost estimates reported will invariably diverge from
the microcosting
approach recommended by the U.S. Panel on Cost-Effectiveness in Health and
Medicine (17).
To examine the policy implications of resource cost estimates reported here for decision making, we assumed the worst-case scenario in which 50 million men aged 40
to 74 years in the United States (73) receive a PSA test annually. Using the
baseline societal resource cost estimate of $37.23 per test, this would translate approximately into an undiscounted $1.86 billion per year. Of
course, this estimate may not be realistic given that not all eligible men in the population would be tested annually. Similarly, it may be difficult to justify screening men aged 40
to 49 years in the entire population unless there is a family history of prostate cancer or the man is of African American descent. This example illustrates how the results presented in this paper may be used by
policy makers in making decisions regarding resource allocation for prostate cancer. Similarly, researchers may use the resource cost estimates presented in this paper as one of the input variables in estimating the cost-effectiveness of screening for prostate cancer
and detecting it early.
The effectiveness of early detection in reducing
the mortality associated with prostate cancer is still a matter of debate. With limited health resources, investing in early-detection services
for prostate cancer will require an understanding of resource costs used in estimating the economic cost of this disease. Therefore, realistic resource cost estimates are necessary to
calculate meaningful cost-effectiveness estimates for prostate cancer screening, diagnosing, and staging.
Our analysis may benefit health policy makers charged with allocating resources to prostate cancer.
Back to top
Acknowledgments
We thank Drs David H. Howard, Hazel D. Dean, Donald K. Blackman, Lisa C. Richardson, Mary C. White, and Ingrid J. Hall, whose thoughtful comments helped refine this paper.
Back to top
Author Information
Corresponding Author: Donatus U. Ekwueme, PhD, Division of Cancer Prevention and Control, National Center for Chronic Disease Prevention and Health Promotion,
Centers for Disease Control and Prevention, 4770 Buford Hwy, Mailstop K-55, Atlanta, GA 30341.
Telephone: 770-488-3182, E-mail:
dce3@cdc.gov.
Author Affiliations: Leonardo A. Stroud, Yanjing Chen, Division of Cancer Prevention and Control, National Center for Chronic Disease Prevention and Health Promotion,
Centers for Disease Control and Prevention, Atlanta, Georgia.
A portion of this article was presented at the International Health Economic Association, 5th World Congress of Health Economics,
July 13, 2005, Barcelona, Spain. Oral presentation no.: WE-0900-1000-40.148-2.
Back to top
References
- Gronberg H.
Prostate cancer epidemiology. Lancet 2003;361(9360):859-64.
- Parkin DM, Bray F, Ferlay J, Pisani P.
Global cancer statistics, 2002. CA Cancer
J Clin 2005;55(2):74-108.
- Ferlay J, Bray F, Pisani P, Parkin DM. GLOBOCAN 2002: cancer incidence, mortality and
prevalence worldwide. IARC CancerBase No. 5, Version 2.0. Lyon (FR):
International Agency for Research on Cancer Press; 2004.
- Fleming C, Wasson JH, Albertsen PC, Barry MJ, Wennberg JE.
A decision analysis of alternative treatment strategies for clinically localized prostate cancer. Prostate Patient Outcomes Research Team. JAMA 1993;269(20):2650-8.
- Albertsen PC.
Is screening for prostate cancer with prostate specific antigen an appropriate public health measure? Acta Oncol 2005;44(3):255-64.
- Harris R, Lohr KN.
Screening for prostate cancer: an update of the evidence for the U.S. Preventive Services Task Force. Ann Intern Med 2002;137(11):917-29.
-
Garnick MB.
Prostate cancer: screening, diagnosis, and management.
[Published erratum in: Ann Intern Med 1994;120(8):698]. Ann Intern Med 1993;118(10):804-18.
- Fair WR. Classic challenges and contemporary opportunities. Proceedings of a
symposium held 12 May 1992 in Washington in conjunction with the AUA’s 87th
annual meeting. AUA Today 1992;5:16-9.
- Sirovich BE, Schwartz LM, Woloshin S.
Screening men for prostate and colorectal cancer in the United States: does practice reflect the evidence? JAMA 2003;289(11):1414-20.
- Swan H, Breen N, Coates RJ, Rimer BK, Lee NC.
Progress in cancer screening practices in the United States: results from the 2000 National Health Interview Survey. Cancer 2003;97(6):1528-40.
- Ross LE, Coates RJ, Breen N, Uhler RJ, Potosky AL, Blackman D.
Prostate-specific antigen test use reported in the 2000 National Health Interview Survey. Prev Med 2004;38:732-44.
- Barry MJ, Fleming C, Coley CM, Wasson JH, Fahs MC, Oesterling JE.
Should Medicare provide reimbursement for prostate-specific antigen testing for early detection of prostate cancer? Part I: Framing the debate. Urology 1995;46(1):2-13.
- Lubke WL, Optenberg SA, Thompson IM.
Analysis of the first-year cost of a prostate cancer screening and treatment program in the United States. J Natl Cancer Inst 1994;86(23):1790-92.
- Optenberg SA, Thompson IM.
Economics of screening for carcinoma of the prostate. Urol Clin North Am 1990;17(4):719-37.
- Murray CJL, Lopez AD. Global health statistics. Boston (MA): Harvard University Press; 1996.
- Carande-Kulis VG, Maciosek MV, Briss PA, Teutsch SM, Zaza S, Truman BI, et al.
Methods for Systematic Reviews of Economic Evaluations for the Guide to Community Preventive Services. Am J Prev Med 2000;18
Suppl 1:75–91.
- Gold MR, Siegel JE, Russell LB, Weinstein MC, eds. Cost-effectiveness in health and medicine. New York (NY): Oxford University Press; 1996.
-
Statewide average operating cost-to-charge ratios for urban and rural hospitals (case weighted): October 1988 to 1995.
Fed Regist 1988;53(191):38835.
-
Consumer price indexes: Bureau of Labor and Statistics, 2003. Washington
(DC): U.S. Bureau of Labor and Statistics. http://www.bls.gov/cpi/. Accessed March 1, 2006.
-
EUROSTAT. Consumer price indices—annual data. Brussels (BE): European
Commission, Statistical Office of the European Communities.
www.europa.eu.int/comm/eurostat.* Accessed March 1, 2006.
-
Purchasing Power Parities (PPP). Paris (FR): Organisation for Economic Co-operation and
Development. http://www.oecd.org/department/0,3355,en_2649 _34357_1_1_1_1_1,00.html.* Accessed March 1, 2006.
-
Krugman PR, Obstfeld M. Price
levels and the exchange rate in the long run. In: International economics: theory and policy. Boston
(MA): Scott, Foresman, and Co.; 1988. p. 378-409.
-
Anderson DR, Sweeney DJ, Williams TA. Statistics for business and economics. 7th
ed. Cincinnati (OH): South-Western College Publishing; 1999. p. 100-1.
-
Critchfield GC, Willard KE.
Probabilistic analysis of decision trees using Monte Carlo simulation. Med Decis Making 1986;6:85-92.
- Dobilet P, Begg CB, Weinstein MC, Braun P, McNeil BJ. Probabilistic sensitivity analysis using Monte Carlo simulation: a practical approach. Med Decis Making 1985;5:157-77.
-
Torp-Pedersen ST, Littrup PI, Mettlin C.
Early prostate cancer: diagnostic costs of screening transrectal US and digital rectal examination. Radiology 1988;169(2):351-4.
-
Babaian RJ, Dinney CP, Ramirez EI, Evans RB.
Diagnostic testing for prostate cancer detection: less is best. Urology 1993;41(5):421-5.
-
Dorr VJ, Williamson SK, Stephens RL.
An evaluation of prostate-specific antigen as a screening test for prostate cancer. Arch Intern Med 1993;153(22):2529-37.
-
Kramer BS, Brown ML, Prorok PC, Potosky AL, Cohagan IK.
Prostate cancer screening: what we know and what we need to know. Ann Intern Med 1993;119(9):914-23.
-
Littrup PJ, Goodman AC, Mettlin CJ, Murphy GP.
Cost analyses of prostate cancer screening: frameworks for discussion. Investigators of the American Cancer Society-National Prostate Cancer Detection Project. J Urol 1994;152(5 Pt 2):1873-7.
-
Abramson N, Cotton S, Eckels R, Baldock I.
Voluntary screening program for prostate cancer: detection rate and cost. South Med J 1994;87(8):785-88.
-
Benoit RM, Naslund MJ.
An economic rationale for prostate cancer screening. Urology 1994;44(6):795-803.
-
Krahn MD, Mahoney JE, Eckman MH, Trachtenberg J, Pauker SG, Detsky AS.
Screening for prostate cancer. A decision analytic view. JAMA 1994;272(10):773-80.
-
Kantrowitz W, Doyle I, Semeraro I, Krane RI.
Prostate cancer screening in a large corporation population. J Occup Environ Med 1995;37(10):1193-8.
-
Cost and effectiveness of prostate cancer screening in elderly men. Washington
(DC): United States Congress, Office of Technology Assessment; 1995.
-
Gottlieb RH, Mooney C, Mushlin AI, Rubens DJ, Fultz PJ.
The prostate: decreasing cost-effectiveness of biopsy with advancing age. Invest Radiol 1996;31(2):84-90.
-
Snyder C, Schrammel PN, Grifths CB, Griffiths RI.
Prostate cancer screening in the workplace. Employer costs. AAOHN J 1998;46(8):379-84.
-
Weinrich S, Atwood J, Cobb M, Ellison G, Deets J, Weinrich M. Cost for prostate cancer educational programs in work and church sites. Am J Health Behav 1998;22(6):421-33.
-
Ellison L, Cheli CD, Brights S, Veltri RW, Partin AW.
Cost-benefit analysis of total, free/total, and complexed prostate-specific antigen for prostate cancer screening. Urology 2002;60(4 Suppl 1):S42-6.
-
Green CJ, Hadorn D, Bassett K, Kazanjian A. Prostate specific antigen in the
early detection of prostate cancer. Vancouver (BC): B.C. Office of Health
Technology Assessment, Centre for Health Services and Policy Research; 1993.
http://www.chspr.ubc.ca/files/publications/1993/bco93-06D.pdf.* Accessed March 1, 2006.
-
Labrie F, Candas B, Dupont A, Cusan L, Gomez JL, Suburu RE, et al.
Screening decreases prostate cancer death: first analysis of the 1988 Quebec prospective randomized controlled trial. Prostate 1999;38(2):83-91.
-
Krahn MD, Coombs A, Levy IG.
Current and projected annual direct costs of screening asymptomatic men for prostate cancer using prostate-specific antigen. CMAJ 1999;160(1):49-57.
-
Candas B, Cusan L, Gomez IL, Diamond P, Suburu RE, Levesque I, et al.
Evaluation of prostatic specific antigen and digital rectal examination as screening tests for prostate cancer. Prostate 2000;45(1):19-35.
-
Carlsson P, Pedersen KV, Varenhorst E.
Costs and benefits of early detection of prostatic cancer. Health Policy 1990;16(3):241-53.
-
Pedersen KV, Carlsson P, Varenhorst E, Lofman O, Berglund K.
Screening for carcinoma of the prostate by digital rectal examination in a randomly selected population. BMJ 1990;300(6731):1041-4.
-
Gustafsson O, Carlsson P, Norming U, Nyman CR, Svensson H.
Cost-effectiveness analysis in early detection of prostate cancer: an evaluation of six screening strategies in a randomly selected population of 2,400 men. Prostate 1995;26(6):299-309.
-
Holmberg H, Carlsson P, Lofman O, Varenhorst E.
Economic evaluation of screening for prostate cancer: a randomized population based programme during a 10-year period in Sweden. Health Policy 1998;45(2):133-47.
-
Chadwich DJ, Kemple T, Astley IP, MacIver AG, Gillatt DA, Abrams P, et al.
Pilot study of screening for prostate cancer in general practice. Lancet 1991;338(8767):613-6.
-
Chamberlain J, Melia J, Moss S, Brown J.
The diagnosis, management, treatment and costs of prostate cancer in England and Wales. Health Technol Assess 1997;1(3):i-vi, 1-53.
- Donovan J, Hamdy F, Neal D, Peters T, Oliver S, Brindle L, et al.
Prostate Testing for Cancer and Treatment (ProtecT) feasibility study.
Health Technol Assess 2003;7(14):1-88.
- Perkins JJ, Sanson-Fisher RW, Clarke SJ, Youman P.
An exploration of screening practices for prostate cancer and the associated community expenditure.
Br J Urol 998;82(4):524-9.
-
Kosuda S, Yoshimura I, Aizawa T, Koizumi K,
Akakura K, Kuyama I, et al.
Can initial prostate specific antigen
determinations eliminate the need for bone scans in patients with newly diagnosed prostate carcinoma? A multicenter retrospective study in Japan. Cancer 2002;94(4):964-72.
- O’Malley AS, Lawrence W, Liang W, Yabroff R, Lynn J, Kerner J, et al.
Feasibility of mobile cancer
screening and prevention. J Health Care Poor Underserved 2002;13(3):298-319.
-
Brawley O. Rethinking prostate cancer test, treatment. Atlanta Journal Constitution
2004 June 8;Sect E:1 (col 4).
- Breen N, Meissner HI.
Toward a system of cancer screening in the United States: trends and opportunities.
Annu Rev Public Health 2005;26:561-82.
- Brown ML, Fintor L.
Cost-effectiveness of breast cancer screening: Preliminary results of a systematic review of the literature.
Breast Cancer Res Treat 1993;25(2):113-8.
- Drummond MF.
Survey of cost-effectiveness and cost-benefit analyses in industrialized
countries. World Health Stat Q 1985;38(4):383–401.
- Ganiats TG, Wong AF.
Evaluation of cost-effectiveness research: a survey of recent publications.
Fam Med 1991;23(6):457–62.
- Balas EA, Kretschmer RA, Gnann W, West DA, Boren SA, Centor RM, et al.
Interpreting cost analyses of clinical interventions. JAMA 1998:279(1):54–7.
- Economic models of colorectal cancer screening: a workshop. Washington
(DC): Institute of Medicine. http://www.iom.edu/project.asp?id=15652.* Accessed March 1, 2006.
- Catalona WJ, Partin AW, Slawin KM, Brawer MK, Flanigan RC, Patel A, et al.
Use of the percentage of free prostate-specific antigen to enhance differentiation of prostate cancer from benign prostatic disease: a prospective multicenter clinical trial. JAMA 1998;279(19):1542-7.
- Reissigl A, Klocker H, Pointner J, Fink K, Horninger W, Ennemoser O, et al.
Usefulness of the ratio free/total prostate-specific antigen in addition to total PSA levels in prostate
cancer screening. Urology 1996;48(6A Suppl):62-6.
- Bangma CH, Kranse R, Blijenberg BG, Schroder FH.
The value of screening tests in the detection of prostate cancer. Part II: Retrospective analysis of free/total prostate-specific analysis ratio, age-specific reference ranges, and PSA density. Urology 1995;46(6):779-84.
- Hoffman RM, Clanon DL, Peirce J, Frank J.
Using the free-to-total prostate-specific antigen ratio to detect prostate cancer in men with nonspecific
elevations of prostate-specific antigen levels. J Gen Intern Med 2000;15(10):739-48.
-
Selley S, Donovan I, Faulkner A, Coast I, Gillatt D.
Diagnosis, management and screening of early localised prostate cancer. Health Technol Assess 1997;1(2):i,1-96.
- Chang P, Friedland GW.
The role of imaging in screening for prostate cancer. A decision analysis perspective. Invest Radiol 1990;25(5):591-5.
- Ellis WJ, Chetner MP, Preston SD, Brawer MK.
Diagnosis of prostatic carcinoma: the yield of serum prostate specific antigen, digital rectal examination and transrectal ultrasonography. J Urol 1994;152(5 pt 1):1520-5.
- Flanigan RC, Catalona WJ, Richie JP, Ahmann FR, Hudson MA, Scardino PT, et al.
Accuracy of digital rectal examination and transrectal ultrasonography in localizing prostate cancer. J Urol
1994;152(5 pt 1):1506-9.
-
Ricchiuti VS, Resnick MI. Staging of prostate cancer: PSA issues leading up to prostate biopsy and biopsy technique. In: Mydlo JH, Godec CJ, eds. Prostate
cancer science and clinical practice. New York (NY): Academies Press; 2003.
p. 69-75.
- Gustafsson O, Norming U, Uyman CR, Ohstrom M.
Complications following transrectal fine needle and core needle biopsy of the prostate. Scand J Urol Nephrol 1990;24(4):249-52.
- Cooner WH, Mosley BR, Rutherford CL Jr, Beard JH, Pond HS, Terry WJ, et al.
Prostate cancer detection in a clinical urological practice by ultrasonography, digital rectal examination and prostate specific antigen. J Urol 1990:143(6):1146-54.
- Aus G, Hermansson CG, Hugosson J, Pedersen KV.
Transrectal ultrasound examination of the prostate: complications and acceptance by patients. Br J Urol 1993;71(4):457-9.
- Census 2000 Summary File 1 (SF 1) 100-Percent Data. Washington (DC):
U. S. Census Bureau. www.census.gov/populatin/cen2000/phc-t9/tab02.pdf. Accessed March 1, 2006.
Back to top
|
|
