
|
|
Volume 4: No. 2, April 2007
ORIGINAL RESEARCH
Health Behaviors of the Young Adult U.S. Population: Behavioral Risk Factor Surveillance System, 2003
Melissa McCracken, MPH, Ruth Jiles, PhD, Heidi Michels Blanck, PhD
Suggested citation for this article: McCracken M, Jiles R, Blanck HM. Health behaviors of the young adult U.S. population: Behavioral Risk Factor Surveillance System, 2003. Prev Chronic Dis [serial online] 2007 Apr [date cited]. Available from:
http://www.cdc.gov/pcd/issues/2007/
apr/06_0090.htm.
PEER REVIEWED
Abstract
Introduction
Health-risk behaviors such as eating poorly, being physically inactive, and smoking contribute to the leading causes of morbidity and mortality in the United States and are often established during adolescence and young adulthood. The objectives of this study were to characterize the health-risk behaviors of young adults (aged 18–24 years) using a large population-based survey of
Americans and to determine if behaviors of this group differ by weight category, as assessed by body mass index (BMI).
Methods
Prevalence estimates for selected health-risk behaviors were calculated for respondents aged 18 to 24 years to the 2003 Behavioral Risk Factor Surveillance System (BRFSS). Respondents were categorized by BMI, and comparisons between sex and race and ethnicity were made within the overweight and obese categories.
Results
More than three quarters (78.4%) of respondents consumed fewer than five fruits and vegetables per day, 43.2% reported insufficient or no physical activity, 28.9% were current smokers, 30.1% reported binge drinking, and 11.9% reported frequent mental distress. One quarter (26.1%) of respondents were overweight, and 13.6% were obese. Of obese young adults, 67.2% reported that they
currently were trying to lose weight; however, only 24.3% reported having received professional advice to lose weight. More obese women (34.2%) than obese men (16.7%) reported having received professional advice to lose weight. Only 19.1% of obese non-Hispanic white respondents had received professional advice to lose weight compared with 28.0% of obese Hispanic respondents and 30.6% of obese
non-Hispanic black respondents.
Conclusion
Many young adults engage in unhealthy behaviors, and differences exist in health-risk behaviors by BMI category
and specifically by sex and race and ethnicity within BMI categories. The transition from adolescence to adulthood may be an opportune time for
intervening to prevent future chronic disease.
Back to top
Introduction
Chronic conditions such as heart disease, stroke, cancer, and diabetes account for most health problems of middle-aged and older American adults (1).
Heart disease, cancer, and stroke are the leading causes of death in the United States (2). Known modifiable health-risk behaviors associated with these leading causes of morbidity and mortality include smoking cigarettes, having a
poor diet, and being physically inactive (3-5). Being overweight or obese puts one at risk for many chronic conditions (6,7). Despite this increased risk, the prevalence of obesity among adults in the United States is high, with recent estimates of 31.1% for men and 33.2% for women (8).
Increases in obesity prevalence were observed during the past decades for both sexes, all racial
and ethnic groups, and all age groups. For example, obesity increased by 69.9% among adults aged 18 to 29 years during the 1990s (9).
Recently released national estimates from 1999 through 2004 indicate that the prevalence of overweight continued to increase among children and
adolescents, from 13.9% during 1999–2000 to 17.1% during 2003–2004 (8). Research suggests that being overweight at a young age increases the risk of obesity and other risk factors for chronic disease in adulthood (10-13).
Health-risk behaviors such as being physically inactive, eating poorly, and smoking are generally established during adolescence and young adulthood (14).
Early intervention (e.g., during the transition from adolescence to adulthood) may be most opportune for preventing chronic diseases, including coronary heart disease and metabolic syndrome (15). To develop and
target prevention efforts for young adults at risk of obesity and future chronic disease, we must understand the health-risk behaviors of this group. Many previous studies examined risk behaviors of adults, but few focused specifically on young adults. Therefore, the objectives of this study were to use a large population-based survey of Americans to characterize the health-risk behaviors of
young adults (aged 18–24 years) and to determine whether the behaviors of this group differ by weight categories, as assessed by body mass index (BMI).
Back to top
Methods
We analyzed data collected during the 2003 Behavioral Risk Factor Surveillance System (BRFSS) for adults aged 18 to 24 years. The BRFSS is a state-based telephone survey conducted by state health departments in collaboration with the Centers for Disease Control and Prevention (CDC). All states, the District of Columbia, Puerto Rico, Guam, and the U.S. Virgin Islands participate in this
surveillance system. The BRFSS uses a multistage cluster design based on random-digit–dialing (RDD) methods to select a representative sample from each state’s noninstitutionalized civilian population aged 18 years and older. Data collected from each state are pooled to produce nationally representative estimates (16). A detailed description of BRFSS survey methods is published
elsewhere (17).
The factors selected for analysis in this study were general health status, mental health status, smoking status, reported binge drinking, fruit and vegetable intake, physical activity status, current weight control activities, and professional advice about weight management.
General health status was determined by responses to the question, “Would you say that in general your health is excellent, very good, good, fair, or poor?” We classified respondents into two groups: 1) respondents with fair or poor health and 2) respondents with good, very good, or excellent health.
To determine mental health status, respondents were asked, “Now thinking about your mental health, which includes stress, depression, and problems with emotions, for how many days during the past 30 days was your mental health not good?” Respondents were classified as
having 1) frequent mental distress if they answered 14 or more days (the
14-day minimum was based upon documented research [18]), 2) few days of mental distress if they answered 1 to 13 days, and 3) no mental distress if they answered 0 days.
Respondents were classified as 1) current smokers if they said they had smoked at least 100 cigarettes in their lives and currently smoked on at least some days, 2) former smokers if they
had smoked at least 100 cigarettes in their lives but currently did not smoke, or 3) never smokers if they had not smoked at least 100 cigarettes in their lives.
Participation in binge drinking was defined as having five or more alcoholic beverages on an occasion during the past 30 days (19). Respondents were classified as either 1) having reported binge drinking or 2) not having reported binge drinking.
An abbreviated food frequency questionnaire (six questions) that asked about usual fruit and vegetable intake was used to classify respondents into two groups: 1) respondents who consumed fewer than five fruits and vegetables per day and 2) respondents who consumed five or more fruits or vegetables per day.
In the physical activity section of the questionnaire, respondents were asked questions about the frequency and duration of both moderate and vigorous leisure-time physical activities performed in a usual week (20). Answers to these questions were used to create three physical activity categories: 1) met recommendations, 2) insufficient physical activity, and 3) inactive. Physical activity
status was based on CDC recommendations of 30 minutes or more per day of moderate-intensity physical activity on 5 or more days per week or 20 minutes or more per day of vigorous-intensity physical activity on 3 or more days per week (21). Respondents were classified as 1) having met recommendations if they reported meeting the recommendation for moderate- or vigorous-intensity
physical activity, 2) having insufficient physical activity if they reported engaging in some physical activity but meeting neither of the recommendations, and 3) being inactive if they reported engaging in no physical activity.
Information about professional advice on weight and weight control activities,
such as dietary changes and increased physical activity, was gathered from responses to questions in the BRFSS weight control
module. All respondents were asked, “Are you now trying to lose weight?” Participants who responded yes were classified as trying to lose weight. Participants who responded no were asked,
“Are you now trying to maintain your current weight, that is, to keep from gaining weight?” Participants who responded yes were classified as trying to maintain weight. Participants who responded no to this question were classified as engaging in no weight control activities.
Respondents who said they were trying
either to lose weight or to maintain their current weight were asked
additional questions about specific weight control activities, including “Are you eating either fewer calories or less fat to lose weight or to keep from gaining weight?” Possible responses to this question included, “yes, fewer calories,” “yes, less fat,” and “yes, fewer calories and less fat.” Respondents were grouped into one of three categories
based on their answers: 1) fewer calories, 2) less fat, and 3) neither. Because calorie reduction was the major weight control behavior that we were interested in, we grouped together respondents who said they were eating either fewer calories or both fewer calories and less fat into one category
(i.e., fewer calories). Participants who indicated they were trying either to lose weight or
to maintain their current weight were additionally asked, “Are you using physical activity or exercise to lose weight or keep from gaining weight?” Participants were classified as having increased physical activity or not having increased physical activity based on their responses.
All respondents were asked, “In the past 12 months, has a doctor, nurse, or other
health professional given you advice about your weight?” Possible responses were “Yes, lose weight,” “Yes, gain weight,” “Yes, maintain current weight,” or “No” (Figure 1). Using responses to this question, participants were grouped into four possible categories under professional advice on weight: 1) lose, 2) gain, 3) maintain, 4) none.
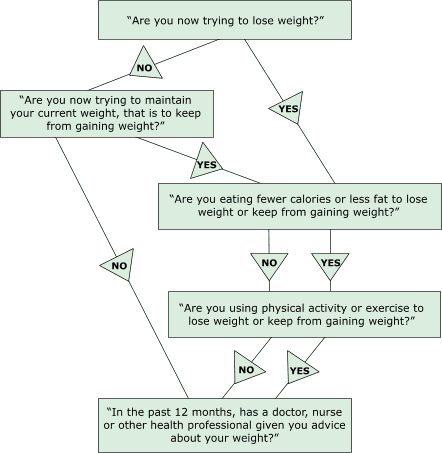
Figure. Flow of questions in the weight control module, BRFSS, 2003.
[A text description of this flow chart is also available.] Self-reported weight and height were used to calculate BMI. Participants were classified as normal weight if their BMI was less than 25.0 kg/m2. We included 751 (4.3%) underweight respondents who had a BMI lower than 18.5 kg/m2 in the normal weight classification, and we continued to call this category
normal weight. Participants were classified as
overweight if their BMI was between 25.0 kg/m2 and 29.9 kg/m2 and obese if their BMI was 30 kg/m2 or higher (7).
Demographic variables of interest were sex, race and ethnicity, education level, marital status, and employment status. Because this analysis focused on young adults who could be in the process of obtaining a degree, we used two categories of attained education: high school graduate or less than a high school education. Marital status was categorized as married, divorced, widowed, separated,
never married, or member of an unmarried couple. Respondents were grouped into one of five employment categories: employed, student, out of work, homemaker, or other.
In 2003, 18,359 BRFSS respondents were aged 18 to 24 years. Because every respondent did not answer every question, the sample sizes for selected variables
varied. Pregnant women were excluded from all BMI-specific analyses. Data were weighted (by age, sex, and race and ethnicity to the 2003 population estimates for each state) and analyzed by using SAS (SAS software version 8.02, SAS Institute, Inc, Cary, NC) and SUDAAN (SUDAAN software version 9, RTI International, Research Triangle Park, NC) statistical software to account for the complex sampling design. Univariate
analyses, prevalence estimates, and 95% confidence intervals (95% CIs) were used
to examine the demographics and selected health-risk behaviors of young adults. Bivariate
cross-tabulations were used to describe and compare young adults who were
classified as normal weight, overweight, or obese. To further describe the
overweight and obese young adult population, sex- and race/ethnicity-specific
cross-tabulations of all variables were done within these categories. Only
statistically significant differences in health behaviors for each sex and
racial and ethnic group are presented in this article (α = .05).
Back to top
Results
Most of the total respondents in our study population were male (52.2%), non-Hispanic white (60.2%), high school graduates (84.8%), never married (70.9%), and employed for wages (55.7%) (Table 1). Approximately 26% reported that they were students at the time of the survey.
Although most of these young adults reported good, very good, or excellent health, 8.4% reported that in general their health was fair or poor. In addition, 11.9% of young adults reported frequent mental distress. The prevalence of current smoking was 28.9%, and 30.1% of respondents reported binge drinking in the previous 30 days.
Responses to questions related to nutrition and physical activity revealed that 78.4% of young adults consumed
fewer than five fruits and vegetables each day. Most (56.8%) met the CDC physical activity recommendations, but 33.2% of respondents engaged in insufficient physical activity and 10.0% of respondents were inactive. Most respondents were classified as normal weight (60.3%).
However, the prevalence of overweight was 26.1%, and the prevalence of obesity was 13.6%.
Analysis of BMI categories by race and ethnicity showed that the distribution is similar to that of the overall BRFSS sample, with the greatest proportion of each category being non-Hispanic white (Table 2). Although the proportions of young adults in each BMI category who were non-Hispanic white and Hispanic were consistent, the proportions of non-Hispanic black respondents in the overweight
and obese categories were higher than the proportion of non-Hispanic black respondents in the normal weight category. This difference prompted us to separately examine the racial and ethnic groups to determine the distribution of BMI categories within each. The data, which are not displayed in the tables, showed that 20.8% (95% CI, 17.9–23.7) of non-Hispanic black participants were obese
compared with 12.0% (95% CI, 11.0–12.9) of non-Hispanic white participants, 14.5% (95% CI, 11.8–17.3) of Hispanic participants, and 13.2% (95% CI, 9.7–16.8) of participants from other non-Hispanic races.
Significant differences in weight control activities among young adults were observed between BMI categories (Table 2). Although the majority of overweight and obese young adults reported trying to lose weight or maintain their weight, 19.9% of overweight respondents and 11.8% of obese respondents were not attempting to do either. Among obese young adults who were trying to lose weight or
maintain their weight, 50.8% (95% CI, 46.8–54.8) reported making a dietary change to consume fewer calories compared with 43.1% (95% CI, 40.1–46.0) of overweight young adults. A high percentage of overweight (91.2%; 95% CI, 89.8–92.5) and obese (73.2%; 95% CI, 69.8–76.4) young adults reported not having received any professional advice in the past year about their
weight.
Table 3 summarizes the sex-specific analyses of the overweight and obese young adult populations,
and these analyses reveal statistically significant differences. A greater proportion of overweight women (17.6%; 95% CI, 14.7–20.9) reported frequent mental distress compared with overweight men (9.9%; 95% CI, 7.8–12.5), and a greater proportion of obese women (17.3%; 95% CI, 14.2–20.8) reported
frequent mental distress compared with obese men (8.7%; 95% CI, 6.2–12.1). Additionally, a greater percentage of overweight women (39.9%; 95% CI, 36.1–43.8) reported insufficient physical activity compared with overweight men (27.0%; 95% CI, 24.0–30.2), and a greater percentage of obese women (43.7%; 95% CI, 39.1–48.5) reported insufficient physical activity compared with
obese men (33.2%; 95% CI, 28.5–38.4).
Weight control activities also differed by sex in both the overweight and obese groups of young adults. The prevalence of trying to lose weight was 68.3% (95% CI, 64.4–71.9) for overweight women compared with 32.7% (95% CI, 29.5–36.1) for overweight men and 76.2% (95% CI, 71.9–80.0) for obese women compared with 60.1% (95% CI, 54.7–65.3) for obese men.
Statistically significant
differences were observed by sex when reported professional advice on weight was examined for the overweight and obese groups of young adults. Although a large portion of overweight and obese young adults of both sexes reported that they had not received professional advice regarding their weight, a greater percentage of obese women (34.2%; 95% CI, 29.8–38.8) reported having received advice
to lose weight compared with 16.7% (95% CI, 12.7–21.6) of obese men.
Table 4 summarizes race- and ethnicity-specific analyses for the overweight and obese groups. These analyses indicate that among these young adults, overweight non-Hispanic white respondents have a higher prevalence of current smoking (36.2%; 95% CI, 33.2–39.3) than non-Hispanic black respondents (22.1%; 95% CI, 16.7–28.6) and Hispanic respondents (18.6%; 95% CI, 13.7–24.8). A
higher percentage of non-Hispanic black respondents in both the overweight category (15.2%; 95% CI, 11.1–20.4) and obese category (15.9%; 95% CI, 9.8–24.7) reported no physical activity compared with overweight (4.1%; 95% CI, 3.2–5.2) and obese (6.3%; 95% CI 4.7–8.5) non-Hispanic white respondents and overweight (5.8%; 95% CI, 3.2–10.5) and obese (5.7%; 95% CI,
2.4–12.9) young adult non-Hispanic respondents of other races.
Differences in the prevalence of reported professional advice regarding weight were also observed by race and ethnicity. Among young adults who were obese, 19.1% (95% CI, 16.0–22.8) of non-Hispanic white respondents reported having received professional advice to lose weight, compared with 28.0% (95% CI, 19.5–38.5)
of Hispanic respondents, 30.6% (95% CI, 23.7–38.5) of non-Hispanic black respondents, and 35.3% (95% CI, 22.0–51.2) of respondents of other non-Hispanic races.
Back to top
Discussion
In this population-based study of young U.S. adults, we found that many
individuals are putting themselves at risk for future disease by engaging in
unhealthy behaviors. Of total respondents aged 18 to 24 years, one quarter
currently smoked, approximately one third engaged in binge drinking during the
past 30 days, three fourths ate fewer than five fruits and vegetables each day, and about half
failed to engage in adequate levels of physical activity. We also found that one quarter of respondents were overweight and one tenth of respondents were obese. Our data suggest that educational efforts aimed at health behavior modification should include a focus on these specific factors for the young adult population if we are to be successful at curtailing ongoing chronic disease increases in
this country.
Among respondents who were obese, two thirds reported they were currently trying to lose weight; however, only one quarter had been advised by a health-care professional in the past year to lose weight. Analysis by BMI category revealed differences by sex and race and ethnicity. For example, whereas one third of obese women had been advised to lose weight, only one fifth of obese males had
been given similar advice. A statistically significant greater number of obese non-Hispanic black and Hispanic respondents
had been advised by a professional to lose weight compared with the number of obese non-Hispanic white respondents. Non-Hispanic white participants made up the majority of respondents who were obese in this population of young adults. However, we also examined each racial and ethnic group separately to examine the proportion
of obese young adults within each group. Our findings showed that the percentage
of obese non-Hispanic black respondents was greater than the percentage of obese
Hispanic and non-Hispanic white respondents. Given this
disparity, it is encouraging that a higher proportion of non-Hispanic black respondents were advised to lose weight; however, no
statistically significant differences in weight control activities were observed for these obese young adults compared with young adults within the other racial and ethnic groups. Further confirmatory research on this finding is needed.
Previous reports have shown that the prevalence of eating fewer than five fruits and vegetables per day is 77% in the general adult population (22). In this study, we found a similarly high prevalence (78.4%) for young adults. We also found that a higher proportion of young adults (28.9%) are current cigarette smokers than is estimated for the entire adult population (22.0% in
2003). This finding is consistent with previous studies showing that smoking rates decrease with age (23-25). An increase in the prevalence of frequent mental distress in the general adult population has been reported, from 8.4% in 1993 to 10.1% in 2001 (18). Our analysis of frequent mental distress specifically among young adults reveals a higher prevalence (11.9%).
A recent study analyzing binge drinking reports a prevalence among all adults of 14.8% (26). The prevalence of binge drinking found among young adults
in this study, 30.1%, was twice as high as that of the general adult population.
The prevalence of self-reported overweight and obesity in the young adult population, about 40%, is not as high as the approximately 56% prevalence in the general adult population (27); however, it is of particular concern because overweight and obesity at younger ages have been shown to be associated with increased risk of chronic conditions, including sustained overweight and obesity,
later in adulthood (10,11). Examining the specific health-risk behaviors of overweight and obese young adults provides information that may be useful for tailoring public health programs and interventions for this age group.
Weight control activities differed among normal weight, overweight, and obese young adults, specifically between the sexes. Overweight and obese women were significantly more
likely than men to report trying to lose weight. This difference in the sex-specific prevalence of weight control activities has also been shown previously for the entire adult population (28).
Dieting has been found to be more common among women than among men, and women are more likely
than men to have histories of weight loss and attempted weight loss (29). In our study of young
adults, men who were overweight or obese were more likely than women to meet physical activity recommendations. These particular estimates from our study were based
only on weight status and
may not be related to desire to lose weight. However, previous studies have shown that women desiring to lose weight are more likely to diet, whereas men desiring to lose weight are more likely to use
exercise (30).
Other sex-specific differences, most notably in mental health status and the receipt of professional advice on weight, were observed in this study among overweight and obese young adults. Overweight and obese women were more likely
than men to report frequent mental distress. Although data on the exact nature of the mental distress are not available, it is possible that the societal pressure
to lose weight and be thin, which is more directly focused on women, may contribute to adverse mental health consequences among young adult women who are overweight or obese.
Although very high percentages of both men and women in the overweight and obese categories reported that they had not received any advice regarding their weight, women were more likely than men to report having received advice to lose weight. This finding may once again reflect the fact that societal pressures to lose weight and to achieve an ideal physique are more heavily focused on women
than men. On the other hand, these data could suggest that women are simply more likely to recall having received professional advice. It is possible that weight-loss–related advice has a greater importance for women, once again reflecting the standards that are set by society. However, these findings could also reflect differences in health-care–seeking behaviors between women and men: respondents who reported they had not received advice about their weight could have either seen a doctor and received no advice or simply not had a health-care checkup within the past year. Prior research has shown that young adult men have a higher prevalence (33%) of not having visited a physician in the past year compared with young adult women (7%) (31).
Previous studies have indicated that multiple factors may influence health-care professionals’ decisions to give or withhold advice about weight (32,33). These factors include weight-loss–related conditions or observed clinical benefit from weight loss for the specific patient, belief in the ability of patients to make lifestyle changes, or the amount of contact the provider has
with the patient. Studies have shown that receiving professional advice to lose weight may increase attempted weight loss among overweight adults (28,34). Therefore, health care professionals need to further encourage young adults, regardless of sex or race, to manage their weight by adopting healthier lifestyles that include good dietary habits and adequate physical activity.
Our study has several limitations. Our estimates of the overweight and obese young adult populations may be conservative because validated studies of self-reported weight and height have shown that overweight respondents tend to underestimate their weight, and all respondents tend to overestimate their height (35,36).
Telephone surveys are less likely to reach people of lower
socioeconomic status, which is a risk factor shown to be associated with overweight and obesity (37). Telephone surveys also have become increasingly limited in their ability to reach the younger adult population for several reasons. First, research has shown that younger adults are more likely to be living in wireless-only households; therefore, this population is less
likely to be included in the BRFSS, which does not include cellular telephones in the RDD sampling frame (38). Second, younger adults living on college or university campuses are less likely to be reached because institutions are not included in the RDD sampling frame. The overall CASRO response rate for all adults for the 2003 survey was 53.2%
(39); however, the specific rate for our age group is not available. These factors may result in possible limited generalizability to all 18- to 24-year-old adults. Given these limitations, further supplemental research using alternative data sources that specifically target the young adult age group (e.g., university surveys) may be warranted. Finally, respondents were asked to report whether they had received professional advice regarding their weight.
However, data regarding interaction with health care professionals were not available, so we were unable to control for people who had not had a health care checkup within the past year.
Public health awareness campaigns and interventions focused on the young adult population should continue to address inadequate nutrition, smoking, frequent mental distress, and binge drinking because these are risk factors that have been shown to be prevalent in this population. Ideally, behavioral risk factors should be identified and modified at an early age to help reduce chronic
conditions that contribute to the leading causes of morbidity and mortality among adults. As this study shows, the young adult population exhibits a variety of sex-specific risk factors for overweight and obesity. These factors should be understood and addressed when targeting specific behavioral modification interventions for the young adult population.
Back to top
Author Information
Corresponding Author: Melissa McCracken, American Cancer Society, 1599
Clifton Road, NE, Atlanta, GA 30329. Telephone: 404-327-6591. E-mail:
melissa.mccracken@cancer.org.
Author Affiliations: Ruth Jiles, Division of Adult and Community Health, Centers for Disease Control and Prevention, Atlanta, Ga; Heidi Michels Blanck, Division of Nutrition and Physical Activity, Centers for Disease Control and Prevention, Atlanta, Ga.
Back to top
References
- Lethbridge-Cejky M, Schiller JS, Bernadel L.
Summary health statistics for the U.S. population: National Health Interview
Survey, 2002. Vital Health Stat 10 2004;(222):1-151.
- National Center for Health Statistics. Health, United States 2004, with chartbook on trends in the health of Americans. Hyattsville (MD): National
Center for Health Statistics; 2004.
- Centers for Disease Control and Prevention. Reducing the health consequences of smoking: 25 years of progress--a report of the Surgeon General. Rockville (MD): U.S. Department of Health and Human Services; 1998.
- U.S. Department of Health and Human Services, U.S. Department of Agriculture. Dietary guidelines for Americans, 2005. 6th ed. Washington (DC): U.S. Government Printing Office; 2005.
- U.S. Department of Health and Human Services. Physical activity and health: a report of the surgeon general. Atlanta (GA): Centers for Disease Control and Prevention, National Center for Chronic Disease Prevention and Health Promotion; 1996.
- Must A, Spadano J, Coakley EH, Field AE, Colditz G, Dietz WH.
The disease burden associated with overweight and obesity. JAMA 1999;282(16):1523-9.
- National Heart, Lung, and Blood Institute. Clinical guidelines on the identification, evaluation, and treatment of overweight and obesity in adults. Bethesda (MD): U.S. Department of Health and Human Services, National Institutes of Health; 1998.
- Ogden CL, Carroll MD, Curtin LR, McDowell MA, Tabak CJ, Flegal KM.
Prevalence of overweight and obesity in the United States, 1999-2004. JAMA 2006;295(13):1549-55.
- Mokdad AH, Serdula MK, Dietz WH, Bowman BA, Marks JS, Koplan JP.
The spread of the obesity epidemic in the United States, 1991-1998. JAMA 1999;282(16):1519-22.
- Nieto FJ, Szklo M, Comstock GW.
Childhood weight and growth rate as predictors of adult mortality. Am J Epidemiol 1992;136(2):201-13.
- Srinivasan SR, Bao W, Wattigney WA, Berenson GS.
Adolescent overweight is associated with adult overweight and related multiple cardiovascular risk factors: the Bogalusa Heart Study. Metabolism 1996;45(2):235-40.
- Janssen I, Katzmarzyk PT, Srinivasan SR, Chen W, Malina RM, Bouchard C, et al.
Utility of childhood BMI in the prediction of adulthood disease: comparison of national and international references. Obes Res 2005;13(6):1106-15.
- Raitakari OT, Juonala M, Viikari JS.
Obesity in childhood and vascular changes in adulthood: insights into the
Cardiovascular Risk in Young Finns study. Int J Obes (Lond) 2005;29 Suppl 2:S101-4.
- Allan JD.
Identification of health risks in a young adult population. J Community Health Nurs 1987;4(4):223-33.
- Ferreira I, Twisk JW, van Mechelen W, Kemper HC, Stehouwer CD.
Development of fatness, fitness, and lifestyle from adolescence to the age of
36 years: determinants of the metabolic syndrome in young adults: the
Amsterdam Growth and Health Longitudinal Study. Arch Intern Med 2005;165(1):42-8.
- Iachan R, Schulman J, Powell-Griner E, Nelson DE, Mariolis P, Stanwyck C.
Pooling state telephone survey health data for national estimates: the CDC
Behavioral Risk Factor Surveillance System, 1995. Hyattsville (MD): U.S.
Department of Health and Human Services; 2001. p. 221-6.
- Remington PL, Smith MY, Williamson DF, Anda RF, Gentry EM, Hogelin GC.
Design, characteristics, and usefulness of state-based behavioral risk factor surveillance: 1981-87. Public Health Rep 1988;103(4):366-75.
- Centers for Disease Control and Prevention.
Self-reported frequent mental distress among adults--United States, 1993-2001. MMWR Morb Mortal Wkly Rep 2004;53(41):963-6.
- Wechsler H, Nelson TF.
Binge drinking and the American college student: what’s five drinks? Psychol Addict Behav 2001;15(4):287-91.
- Macera CA, Ham SA, Yore MM, Jones DA, Ainsworth BE, Kimsey CD, et al.
Prevalence of physical activity in the United States: Behavioral Risk Factor Surveillance System, 2001. Prev Chronic Dis
[serial online] 2005 Apr.
- Pate RR, Pratt M, Blair SN, Haskell WL, Macera CA, Bouchard C, et al.
Physical activity and public health. A recommendation from the Centers for Disease Control and Prevention and the American College of Sports Medicine. JAMA 1995;273(5):402-7.
- Centers for Disease Control
and Prevention.
Indicators for chronic disease surveillance. MMWR Recomm Rep 2004;53(RR-11):1-18.
- Jiles R, Hughes E, Murphy W, Flowers N, McCracken M, Roberts H, et al.
Surveillance for certain health behaviors among states and selected local areas--Behavioral Risk Factor Surveillance System, United States, 2003. MMWR Surveill Summ 2005;54(8):1-116.
- Centers for Disease Control and Prevention.
Cigarette smoking among adults--United States, 2003. MMWR Morb Mortal Wkly Rep 2005;54(20):509-13.
- Centers for Disease Control and Prevention.
State-specific prevalence of current cigarette smoking among adults--United States, 2003. MMWR Morb Mortal Wkly Rep 2004;53(44):1035-7.
- Nelson TF, Naimi TS, Brewer RD, Wechsler H.
The state sets the rate: the relationship among state-specific college binge drinking, state binge drinking rates, and selected state alcohol control policies. Am J Public Health 2005;95(3):441-6.
- Mokdad AH, Bowman BA, Ford ES, Vinicor F, Marks JS, Koplan JP.
The continuing epidemics of obesity and diabetes in the United States. JAMA
2001;286(10):1195-200.
- Bish CL, Blanck HM, Serdula MK, Marcus M, Kohl HW III, Khan LK.
Diet and physical activity behaviors among Americans trying to lose weight: 2000 Behavioral Risk Factor Surveillance System. Obes Res 2005;13(3):596-607.
- Blokstra A, Burns CM, Seidell JC.
Perception of weight status and dieting behaviour in Dutch men and women. Int J Obes Relat Metab Disord 1999;23(1):7-17.
- McElhone S, Kearney JM, Giachetti I, Zunft HJ, Martinez JA.
Body image perception in relation to recent weight changes and strategies for weight loss in a nationally representative sample in the European Union. Public Health Nutr 1999;2(1A):143-51.
- Sandman D, Simantov E, An C. Out of touch: American men and the health
care system. Commonwealth Fund Men’s and Women’s Health Survey findings. New
York (NY): The Commonwealth Fund; 2000.
- Galuska DA, Will JC, Serdula MK, Ford ES.
Are health care professionals advising obese patients to lose weight? JAMA 1999;282(16):1576-8.
- Simkin-Silverman LR, Gleason KA, King WC, Weissfeld LA, Buhari A, Boraz MA, et al.
Predictors of weight control advice in primary care practices: patient health and psychosocial characteristics. Prev Med 2005;40(1):71-82.
- Mehrotra C, Naimi TS, Serdula M, Bolen J, Pearson K.
Arthritis, body mass index, and professional advice to lose weight: implications for clinical medicine and public health. Am J Prev Med 2004;27(1):16-21.
- Rowland ML.
Self-reported weight and height. Am J Clin Nutr 1990;52(6):1125-33.
- Palta M, Prineas RJ, Berman R, Hannan P.
Comparison of self-reported and measured height and weight. Am J Epidemiol 1982;115(2):223-30.
- Ford ES.
Characteristics of survey participants with and without a telephone: findings from the third National Health and Nutrition Examination Survey. J Clin Epidemiol 1998;51(1):55-60.
- Blumberg SJ, Luke JV, Cynamon ML.
Telephone coverage and health survey estimates: evaluating the need for concern about wireless substitution. Am J Public Health 2006;96(5):926-31.
- Centers for Disease Control and Prevention. Behavioral Risk Factor
Surveillance System, 2003 summary data quality report [Internet]. Atlanta
(GA): Centers for Disease Control and Prevention, National Center for
Chronic Disease Prevention and Health Promotion; 2004 [cited 2006 Nov 28].
Available from: http://www.cdc.gov/brfss/technical_infodata/ 2003QualityReport.htm
Back to top
|
|
