
|
|
Volume 1:
No. 2, April 2004
ORIGINAL RESEARCH
Pediatric Hospitalizations
for Asthma: Use of a Linked File to Separate Person-level Risk and
Readmission
Jonathan C. Wallace, MA, MPH, Charles E. Denk, PhD, Lakota K. Kruse, MD, MPH
Suggested citation for this article: Wallace JC,
Denk CE, Kruse LK. Pediatric hospitalizations for asthma: use of a linked
file to separate person-level risk and readmission. Prev Chronic
Dis [serial online] 2004 Apr [date cited]. Available from: URL: http://www.cdc.gov/pcd/issues/2004/
apr/03_0009.htm.
PEER REVIEWED
Abstract
Introduction
Disparities in asthma hospitalization by gender, age, and race/ethnicity are
thought to be driven by a combination of 2 factors: disease severity and
inadequate health care. Hospitalization data that fail to differentiate
between numbers of admissions and numbers of individuals limit the ability
to derive accurate conclusions about disparities and risks.
Methods
Hospitalization records for pediatric asthma patients (aged one to 14 years)
were extracted from New Jersey Hospital Discharge Files (for the years 1994
through 2000) and then linked by patient identifiers using a probabilistic
matching algorithm. The analysis file contained 30,400 hospital admissions
for 21,016 children. Hospitalization statistics were decomposed into persons
hospitalized and number of hospitalizations. Analysis of readmission within 180 days of
discharge used additional records from 2001 to avoid bias due to truncated
observation.
Results
Overall, 22.9% of children in our analysis had repeat asthma admissions
within the same age interval, accounting for 30.9% of all hospitalizations.
Also among all children, 11.7% had at least one readmission within 180 days
of a prior discharge. The risk of hospitalization was higher for boys,
decreased by age for both genders, was lowest for white children and highest
for black children. Readmission rates were higher for black and
Hispanic girls than boys in older age groups, but were otherwise relatively
uniform by gender and age.
Conclusion
Decomposition of ratios of total hospitalizations to population illuminates
components of risk and suggests specific causes of disparity.
Back to top
Introduction
Asthma is one of the most common chronic conditions in the United States
and is often cited as the most frequent reason for preventable hospital
admissions among children (1-4). The United States Department of Health and
Human Services' Healthy People 2010: Objectives for Improving Health
established a goal to "reduce asthma morbidity, as measured by a
reduction in hospitalizations" (5).
The Asthma and Allergy Foundation of America estimates that there are
142,000 children with asthma in New Jersey (6). Hospital discharge data from
1985 through 2000 indicate that asthma is a major cause of hospitalization
for all ages in New Jersey, accounting for approximately 1% of New Jersey's
average 1.4 million hospital discharges each year (7). New Jersey mirrors
national disparities in asthma hospitalization rates among various
population groups by age, gender, and race (1,2).
Few state asthma surveillance systems to date differentiate between the
number of individuals hospitalized and the number of admissions, the latter
of which can be numerous during an individual's lifetime. The difference
between the number of individuals hospitalized and the number of admissions
can lead to several forms of bias. First, total hospital admissions
overstate the number of individuals affected by severe asthma. Second, the
repeat admissions of some individuals may obscure the true sociodemographic
distribution of severe disease. Third, routine inference from
hospitalizations to individuals implicitly assumes that patterns of
readmission reinforce sociodemographic differences in person-level risk or
are neutral. Hospitalization for
asthma implies more severe disease, less adequate preventive care, or both.
Failure to distinguish persons from hospitalizations undermines
inferences about the contribution of either of these 2 classes of causation.
The objectives of this study were to use linked hospital asthma admission
data for children to accomplish the following: 1) deduplicate records of
asthma hospitalizations and assess the scope of readmissions; 2) investigate
relative risks of ever being hospitalized; and 3) examine the frequency of
hospitalization for each individual admitted and assess the risk of
readmission for asthma within 180 days of a prior discharge.
Back to top
Methods
The study population was defined as all asthma hospitalizations
experienced by New Jersey resident children aged one to 14 years from 1994
through 2000. Records from New Jersey Hospital Discharge Files (UB-92) were
linked to identify patients with multiple asthma hospitalizations. Asthma
hospitalizations were defined using the Centers for Disease Control and
Prevention case definition: a primary diagnosis of ICD-9 Code 493 (8).
AutoMatch, a probabilistic matching program, was used to link patients with
more than one hospitalization in the data subset (9,10). Variables used in
the linking process included the following: last name, first name, date of
birth, municipality, zip code, race/Hispanic origin, hospital, medical
record number, and insurer identification number. In probabilistic matching
for deduplication, pools of candidate matches are identified by one or more
variables such as last name and birth date. A second set of variables is
used to score the similarity of each candidate pair, and the highest scored
candidates are linked subject to a minimum cutoff score. The linkage process
is iterative, so that variables used to identify candidate matches at one
stage were used for confirmatory scoring in other stages and vice versa.
Hospitalization records identified the patient's age, gender, and
race/ethnicity. Patient ages were grouped into the following age
categories at each hospital admission: one to 4 years, 5 to 9 years, and 10
to 14 years. Children younger than one year were excluded because of
issues of uncertainty among physicians surrounding the diagnosis and coding of asthma for children at this
age. After age and calendar time
exclusions, 32,825 hospitalization records representing 22,990 individuals
were available. However, 399 records (1.2%) had missing data for race/ethnicity, and 615 additional persons (3.1%) had inconsistent data
across multiple records. In both cases, all records for each person were
coded using the following hierarchy:
- If any records indicated race as Hispanic, then the person was coded
"Hispanic" for all hospitalizations.
- If any records indicated race as black, then the person was coded
"black" for all hospitalizations.
- If no records contradicted race as white, then the person was coded
"white" for all hospitalizations.
The final data extract had 30,400 hospitalization records representing
21,016 white, black, and Hispanic persons. Asian and other non-Hispanic
individuals were not included in this analysis because of the relatively
small number of hospitalizations.
For our analysis, hospitalization ratios are defined as the number
of hospitalizations in a population subgroup, including multiple
readmissions of the same patient. They were calculated using data on age,
gender, and ethnic origin from the 2000 Census as the denominator.
Intercensal estimates would not enhance the analysis. Because 7 years
of hospitalization records were extracted, census denominators were
multiplied by 7.
Person-level hospitalization rates are defined as the number of
distinct individuals hospitalized within a population subgroup (including age
groups), and used the same 2000 Census denominators (age, gender, and ethnic
origin) as hospitalization ratios. Records shared a common person identifier
within the linked file. We were thus able to count the number of unique
individuals hospitalized within any population subgroup. Individuals who were
hospitalized at ages in different categories were counted once per age
group. The frequency of admission per child is the ratio of total
admissions within an age group to the number of individual children in the
age group — essentially, the average number of admissions per individual
child.
For a more precise analysis of readmissions, we treated each admission as a
prospective opportunity for readmission and checked for a succeeding
admission for that individual within 180 days from the date of discharge. We
also accessed records from the first half of 2001, so that loss to follow-up
would not occur for admissions late in 2000. Age group was classified by the
earlier admission in each potential pair, and the entire 180-day readmission
window was used even if the child aged out of his or her original age group.
Readmission rates are the proportion of admissions in each subpopulation
with a succeeding readmission in the time window. Although it departs from
the logic of decomposing hospitalization ratios, the analysis of readmission
events over a fixed period, constructed to minimize censoring bias, is a
stronger approach with fewer inherent limitations.
We judged that the period of 180 days was an appropriate window for clinical
follow-up of a chronic condition compared, for example, to much shorter times required for complications from surgical procedures. Also, since
aggregate rates of asthma hospitalization have a strong annual cycle, we
wanted an interval short enough to avoid confounding with that periodicity.
Analysis using other time intervals did not yield substantially different
results.
All analysis was performed using SAS Release 8.01 (11). Since the data set captures
virtually all persons and hospitalizations for the period examined,
statistical inferences based on sampling variability are not applicable.
Systematic errors of omission, classification, linkage, and other biases do
not follow the same statistical laws as sampling errors. The practical
significance of subgroup differences, and whether they exceed expectations
of error, must be judged on external rather than statistical criteria.
Back to top
Results
From 1994 through 2000, 21,016 New Jersey children accounted for 30,400
asthma hospitalizations in New Jersey (Table
1). Overall, 4808 children (22.9% of all children hospitalized for
asthma in New Jersey) experienced multiple admissions; their 9384 duplicate
admissions accounted for 30.9% of all pediatric asthma admissions. Within
this group, 2459 children (11.7% of all children hospitalized for asthma in
New Jersey) experienced at least one readmission within 180 days of a prior
asthma discharge, totaling 4340 admissions. These latter readmissions,
however, accounted for 14.3% of all childhood/pediatric hospitalizations for asthma in New
Jersey.
Table 2 presents the
decomposition of hospitalization ratios into components by gender, age, and
race/ethnicity. To illuminate the most salient points of Table 2, we
constructed Figures 1-3.
Figure 1 presents person-level hospitalization rates for all individual
children (per thousand population) hospitalized for asthma in New Jersey by age, sex and race/ethnicity. Rates are generally higher for boys
than girls. For example, rates for boys are approximately twice the rates
for girls among white children aged one to 4 years; the difference varies
somewhat by age and race/ethnicity. Rates decline with age, especially
between the ages of one to 4 years and 5 to 9 years. For example, rates for
white girls drop from 1.8 to 0.7 per 1000 between ages one to 4 years and
ages 5 to 9 years, and rates for white boys drop from 3.5 to 1.2 per 1,000
for the same age groups. White children experience the lowest rates, black
children the highest, and rates for Hispanic children rates fall in between.
Generally, black children have about 4 times the risk of hospitalization
compared to white children of comparable age and gender; Hispanic children
have about twice the risk compared to their white peers.
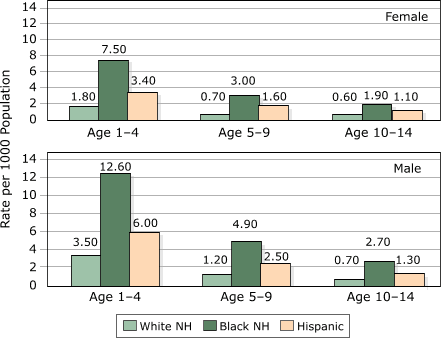
Figure 1.
Person-level hospitalization rates for
asthma by age, gender, race/ethnicity, New Jersey, 1994–2000. NH indicates
non-Hispanic.
Figure 2 presents the frequency of admissions per child who has ever been
hospitalized for asthma in New Jersey by age, gender, and race/ethnicity.
The qualitative differences in relationships compared to the previous figure
are striking; in contrast to person-level hospitalization rates, the
frequency of admissions is roughly uniform by age for white children and
increases by age for black and Hispanic children. Admission frequencies vary
for white girls from 1.21 (ages one to 4 years) to 1.18 (ages 5 to 9 years)
to 1.27 (ages 10 to 14 years), but for black girls, admission frequencies
increase from 1.35 to 1.44 to 1.72 for the same age groups. Generally, the
frequency of admission for boys and girls is equal for white children,
although girls have higher averages than boys among older blacks and
Hispanics. For example, among white children aged one to 4 years ever
hospitalized for asthma, girls experience an average of 1.21 admissions
while boys have an average of 1.19; the same comparison for Hispanic
children ages 10 to 14 years is 1.70 (girls) vs 1.47 (boys). Finally, compared to the relative advantage of
Hispanics over blacks in Figure 1, that trend is eliminated or reversed for
frequency of admission, depending on the age group.
Figure 2.
Average admissions per child hospitalized for asthma by age,
gender, and race/ethnicity, New Jersey, 1994–2000. NH indicates
non-Hispanic.
Figure 3 presents our analysis of readmission rates more precisely
calculated as readmission within 180 days of prior discharge and displays
the same general patterns as the admission frequencies in Figure 2 with
respect to gender, age and race/ethnicity. Again, readmission rates are
roughly uniform by age for white children and increase by age for black and
Hispanic girls only. Readmission rates vary for white girls from 11% (ages
one to 4 years) to 8% (ages 5 to 9 years) and 10% (ages 10 to 14 years), but
for black girls they increase from 16% to 20% to 29% (same age groups).
Generally, readmission rates for boys and girls are equal for white
children, although girls have higher rates than boys among older black and
Hispanic children. For example, among white children ages one to 4 years
ever hospitalized for asthma, girls experience a readmission rate of 11%
while boys have an average of 10%; the same comparison for Hispanic children
ages 10 to 14 years is 21% (girls) vs 17% (boys). Black girls ages 10 to
14 years have a very distinctive spike compared to boys and to Hispanic
girls of the same age.
Figure 3.
Readmission rates within 180 days of prior asthma discharge by age,
gender, and race/ethnicity, New Jersey, 1994–2000. NH indicates
non-Hispanic.
To underscore the comparisons discussed above, Table
3 transforms the measures in Table 2 into relative risks and similar
ratios. The first 4 columns contrast younger age groups against the 10-to-14 years age group. These columns most clearly support our generalizations and
distinctions about age and race/ethnicity. Hospitalization ratios and
person-level rates decline dramatically with age across all race/ethnic
groups, with slightly larger declines for boys. Admission frequencies and
readmission rates have much weaker and usually opposite effects. It is
important to note that wherever age has opposite effects on person-level
admission and readmission, the overall hospitalization ratio will be smaller
than the person-level admission rate. The last 4 columns of Table 3 contrast
black and Hispanic children against whites. In general, both person-level
hospitalization and readmission components are substantial and in the same
direction, which produces even larger relative differentials in
hospitalization ratios. The difference between black and Hispanic children
is largely a function of person-level hospitalization — every other
ratio in these columns is very similar between the two.
Back to top
Discussion
Hospitalization ratios in New Jersey have associations with gender, age,
and race/ethnicity that are comparable to other recent reports (12-17).
Repeat hospitalizations for asthma are a common event for New Jersey children,
accounting for almost one third of all admissions for asthma. Much epidemiological
evidence and clinical experience suggests that hospitalization for asthma is
a mixture of biological disease factors and failures of preventive care. We
believe that the significant qualitative differences between person-level
hospitalization rates and readmissions provide important leverage to
distinguish the influences of the two.
Person-level hospitalization rates give a more precise accounting of how
the burden of severe asthma is distributed across individuals (rather than
the burden of hospitalization as a distinct event). This is the main
implication of the differences between hospitalization ratios and
person-level rates in Table 3. On the other hand, readmissions are more than
residual events to be eliminated in deduplication. Readmission rates are
arguably more driven by issues of disease management, since children in that
analysis are more homogeneous — they all have a degree of disease severe
enough to require hospitalization. The 2 rates in combination —
person-level and readmission — tell the same story as hospitalization
ratios, but in a more focused and coherent way.
In general, our findings on readmission rates fit with very simple
hypotheses about barriers to appropriate preventive care. Based solely on
socioeconomic barriers to access, we would expect comparatively little
variation by gender and age (of children, not adults), and we would expect
black and Hispanic children to be similar to each other. These expectations
are generally met by our data. Person-level rates clearly are more complex,
and it would be helpful if we could assess the relative contribution of
access and other factors.
For example, numerous studies have documented age and race/ethnic
disparities in asthma hospitalization (12-18). Variations in
the accessibility and quality of preventive asthma care have been linked to
race/ethnicity (19-22). A recent study that explicitly
addresses financial access still finds disparities in processes of asthma
care such as the use of controller medications (23). Risk factors for asthma
morbidity — such as outdoor environment, family smoking, and physical
activity — have been well demonstrated to vary by racial and ethnic groups.
Less is known about potential biologic factors such as genetic,
physiological, pharmacogenomic, and/or environmental-genetic interactions.
In New Jersey,
person-level hospitalization rates for black children are 3.2 to 4.3 times
higher than for white children (stratified by age and gender, Table 3). This
ratio is about twice the disparity in person-level rates experienced by Hispanic
children and also twice the disparity in readmission rates for both black
and Hispanic children. On the basis of this outsized differential, we
observe, as others have, that there could be a biological difference in
disease etiology for black children (24,25). Regardless of the cause(s),
this disparity demands further investigation.
Numerous studies have documented higher hospitalization ratios for
preschool-age children (12-16). In New Jersey, children ages one to 4 years
have threefold higher person-level hospitalization rates than preadolescents
among girls and more than fourfold higher rates among boys. This
differential does not exist at all for readmission rates, contrary to To's
findings from Canada (12). This would seem to undermine the hypothesis that
preschool-age children present special challenges for home management and lends
more support to the distinctive nature of early onset asthma (26,27). On the
other hand, there is an anomalous spike in readmission rates for black girls
ages 10 to 14 years, which is not mirrored in person-level rates or in black boys or Hispanic girls
of the same age. It is more likely that this
anomaly is related to asthma management and use of controller medications
(28).
Our analysis of linked hospitalizations does not allow us, unfortunately,
to explore some issues typical in a cohort analysis. For example, we cannot
describe age-specific onset or population prevalence of severe asthma. Since
we cannot in most cases identify the first hospitalization for each child,
we can only generalize about readmissions by assuming independence among the
intervals between hospitalizations.
Matching of annual files does not lend itself, in this case, to the
construction and analysis of age cohorts of children. The optimal timeframe
for a longitudinal file is limited by the comparability of files over many
years and a natural decay in expected matching accuracy. True cohort data,
with complete histories from both inpatient and outpatient management, would
obviously be much more powerful.
State-level asthma hospitalization surveillance systems like New Jersey's
address 2 objectives, both incompletely. Trends in asthma hospitalizations
can inform us about prevalence and distribution of the severest forms of the
disease. Surveillance of asthma readmissions especially informs us about the
effectiveness of asthma care — accessibility of care, management of
environmental triggers, and appropriate preventive asthma management. For
both objectives, racial and ethnic disparities and age-specific differences
are critically important.
Back to top
Acknowledgments
This research was supported by the Addressing Asthma from a Public
Health Perspective grant from the Centers for Disease Control and
Prevention. The analysis and conclusions expressed here are those of the
authors.
Author Information
Corresponding Author: Jonathan Wallace, MA, MPH, Maternal and Child Health
Epidemiology Program, New Jersey Department of Health and Senior Services,
PO Box 364, Trenton, NJ 08625. Telephone: 609-292-5656. E-mail: Jonathan.Wallace@doh.state.nj.us.
Author Affiliations: Charles E. Denk, PhD, Lakota K. Kruse, MD, MPH,
Maternal and Child Health Epidemiology Program, New Jersey Department of
Health and Senior Services, Trenton, NJ.
Back to top
References
- Miller J.
The effects of race/ethnicity and income on early childhood
asthma prevalence and health care use. Am J Public Health
2000 Mar;90 (3):428-30.
- Mannino DM, Homa DM, Akinbami LJ, Moorman JE, Gwynn C, Redd SC.
Surveillance for
asthma — United States, 1980-1999. MMWR Surveill Summ 2002 Mar 29;51 (1):1-13.
- Fiore BJ, Olson JA, Hanrahan LP, Anderson HA.
Asthma
hospitalizations in Wisconsin: a missed opportunity for
prevention. WMJ 2000 Nov;99 (8):52-6.
-
Asthma hospitalizations and readmissions among children and young
adults — Wisconsin, 1991-1995. MMWR Morb Mortal Wkly Rep 1997 Aug 8;46
(31):726-9.
- U.S. Department of Health and Human Services.
Healthy People 2010:
With understanding and improving health and objectives for improving
health. 2 vols. Washington (DC): U.S. Government Printing Office, 2000
Nov.
- Weiss KB, Sullivan SD, Lyttle CS.
Trends in the costs of asthma in the
United States, 1985-1994. J Allergy Clin Immunol
2000 Sep;106 (3):493-9.
- Asthma in New Jersey. Trenton (NJ): New Jersey Department of Health
and Senior Services, Division of Family Health Services; 2002 Jan. 29 p.
- Centers for Disease Control and Prevention. Council of State and
Territorial Epidemiologists asthma surveillance definition. Atlanta (GA):
U.S. Department of Health and Human Services, CDC, National Center for
Environmental Health; 2001.
-
AutoMatch: Generalized Record Linkage
System [computer program]. Version 4.2. Kennebunkport (ME): Matchware Technologies Inc; 1998.
- Jaro MA.
Probabilistic linkage of large public health data files.
Stat Med 1995 Mar 15-Apr 15;14 (5-7):491-8.
- SAS: System for Windows [computer program]. Version 8. Cary (NC): SAS
Institute Inc; 1998.
- To T, Dick P, Feldman W, Hernandez R.
A cohort study on childhood
asthma admissions and readmissions. Pediatrics 1996 Aug;98 (2 Pt 1):191-5.
- Jonasson G, Lodrup Carlsen KC, Leegaard J, Carlsen K-H, Mowinckel P,
Halvorsen KS.
Trends in hospital admissions for childhood asthma in
Oslo, Norway, 1980-95. Allergy 2000 Mar;55 (3):232-9.
- Korhonen K, Reijonen TM, Malmstrom K, Klaukka T, Remes K, Korppi, M.
Hospitalization trends for paediatric asthma in eastern Finland: a 10-yr
survey. Eur Respir J 2002 Jun;19 (6):1035-9.
- Engelsvold DH, Oymar K.
Hospital admissions for childhood asthma in Rogaland, Norway, from 1984 to 2000. Acta Paediatr 2003 May;92 (5):610-6.
- Akinbami LJ, Schoendorf KC.
Trends in childhood asthma: prevalence,
health care utilization, and mortality. Pediatrics 2002 Aug;110 (2 Pt 1):315-22.
- Senthilselvan A.
Effect of readmissions on increasing admissions for
asthma in children. Thorax 1995 Sep;50 (9):934-6.
- Aligne CA, Auinger P, Byrd RS, Weitzman M.
Risk factors for pediatric
asthma. Contributions of poverty, race, and urban residence. Am J Respir Crit Care Med
2000 Sep;162 (3 Pt 1):873-7.
- Halterman JS, Aligne CA, Auinger P, McBride JT, Szilagyi PG.
Inadequate therapy for asthma among children in the United States.
Pediatrics 2000 Jan;105 (1 Pt 3):272-6.
- Finkelstein JA , Brown RW, Schneider LC, Weiss ST, Quintana JM,
Goldmann DA, et al.
Quality of care for preschool children with
asthma: the role of social factors and practice setting. Pediatrics
1995 Mar;95 (3):389-94.
- Homer CJ, Szilagyi P, Rodewald L, Bloom SR, Greenspan P, Yazdgerdi S,
et al.
Does quality of care affect
rates of hospitalization for childhood asthma. Pediatrics 1996 Jul;98
(1):18-23.
- Perrin JM, Homer CJ, Berwick DM, Woolf AD, Freeman JL, Wennberg JE.
Variations in rates of hospitalization of children in three urban
communities. N Engl J Med 1989 May 4;320 (18):1183-7.
- Lieu TA, Lozano P, Finkelstein JA, Chi FW, Jensvold NG, Capra AM,
et al.
Racial/ethnic variation in asthma
status and management practices among children in managed Medicaid.
Pediatrics 2002 May;109 (5):857-65.
- Nelson DA, Johnson CC, Divine GW, Strauchman C, Joseph CL, Owenby DR.
Ethnic differences in the prevalence of asthma in middle class children.
Ann Allergy
Asthma Immunol 1997 Jan;78 (1):21-6.
- Nimmagadda SR, Evans R.
Allergy: etiology and epidemiology. Pediatr Rev 1999
Apr;20 (4):111-5; quiz 116.
- Sears MR, Greene JM, Willan AR, Wiecek EM, Taylor DR, Flannery EM, et
al.
A longitudinal,
population-based, cohort study of childhood asthma followed to
adulthood. N Engl J Med 2003 Oct 9;349 (15):1414-22.
- Martinez F.
Toward asthma prevention — does all that really matters
happen before we learn to read? N Engl J Med
2003 Oct 9;349 (15):1473-5.
- Lozano P, Finkelstein JA, Hecht J, Shulruff R, Weiss KB.
Asthma
medication use and disease burden in children in a primary care
population. Arch Pediatr Adolesc Med 2003 Jan;157 (1):81-8.
Back to top
Tables
 Table 1.
Hospitalization Records for Pediatric Asthma Admissions, New Jersey,
1994–2000
| |
Admissions |
Children |
Admissions per Child |
| |
n |
% |
n |
% |
|
| All pediatric asthma admissions |
30,400 |
100.0 |
21,016 |
100.0 |
1.45 |
| Repeat asthma admissions within same age interval |
9,384 |
30.9 |
4,808 |
22.9 |
2.95 |
| Readmissions within 180 days of previous
dischargea |
4,340 |
14.3 |
2,459 |
11.7 |
2.76 |
|
aAnalysis of readmissions within 180 days of discharge used additional
records from 2001 to avoid censoring bias. |
|
