 |
|
|
|
|
|
|
| ||||||||||
|
|
|
|
|
|
|
||||
| ||||||||||
|
|
|
|
|
Persons using assistive technology might not be able to fully access information in this file. For assistance, please send e-mail to: mmwrq@cdc.gov. Type 508 Accommodation and the title of the report in the subject line of e-mail. Statistics and Public Health at CDCWilliam K. Sieber, Jr, PhD,1 T. Green,
PhD,2 G. D. Williamson, PhD3
Corresponding author: William K. Sieber, Jr, PhD, National Institute for Occupational Safety and Health, 4676 Columbia Parkway, Cincinnati, OH 45226. Telephone: 513-841-4231; Fax: 513-841-4489; E-mail: wsieber@cdc.gov.
Have you ever wondered how an association between exposure and disease is evaluated? For example, how does the severity of salmonellosis depend on ingested dose of egg products (1)? Or how is the relation between blood lead levels and gasoline lead levels determined (2)? Each of these studies involves statistical analysis. Since CDC's inception, an important function of the agency has been the compilation, analysis, and interpretation of statistical information to guide actions and policies to improve health. Sources of data include vital statistics records, medical records, personal interviews, telephone and mail surveys, physical examinations, and laboratory testing. Public health surveillance data have been used to characterize the magnitude and distribution of illness and injury; to track health trends; and to develop standard curves, such as growth charts. Beyond the development of appropriate program study designs and analytic methodologies, statisticians have played roles in the development of public health data-collection systems and software to analyze collected data. CDC/ATSDR employs approximately 330 mathematical and health statisticians. They work in each of the four coordinating centers, two coordinating offices, and the National Institute for Occupational Safety and Health. Statistics and ResearchThe integration of statistics and analytic techniques into public health research is a critical asset to the agency (Figure 1) and has resulted in important applications in various disciplines, such as epidemiology, economics, and the behavioral and social sciences. Examples include economic determinations contributing to folic acid supplementation of foods to decrease birth defects (3); behavioral science methods leading to the development of strategies for preventing human immunodeficiency virus infection and acquired immunodeficiency syndrome (4); quantitative epidemiologic analyses leading to understanding the relation between radon and lung cancer in coal miners (5); and evaluations of the effectiveness of using back belts to reduce back injury claims and back pain (6). Other areas of continuing statistical contribution include survey planning and analytic methodology, data-collection systems, detection algorithms and scan statistics to document health trends and identify emerging health issues, and model development to project disease incidence and injury or numbers of cases prevented through treatment and public health measures during an outbreak. For example, new methods have been developed to enable comparisons of population characteristics across data-collection programs and over time when data-collection methods change (7) and to quantify disparities in health and health care (8). Methodologic work also has addressed high levels of nonresponse on central variables such as income (9). Reliance on data for policy and programmatic use and the growing number and diversity of users have required ongoing research and innovative approaches to protect the confidentiality and security of data while offering the widest possible access to data (10). The CDC National Center for Health Statistics (NCHS) is the nation's principal health statistics agency and has broad responsibilities to monitor the health of the United States. In addition to conducting a data-collection program that encompasses vital statistics, interview surveys, examination surveys, and provider surveys, NCHS prepares the annual report, Health, United States (11), which the Secretary of Health and Human Services submits to the President and Congress. Health, United States, presents a comprehensive profile of health in the United States and tracks key health indicators and trends. NCHS also is responsible for advancing the field of health statistics through research into statistical and analytic methods. The National Laboratory for Collaborative Research in Cognition and Survey Measurement, an NCHS program, applies cognitive methods to questionnaire design research and testing of data-collection instruments to improve data quality (12). Recent CDC activities presenting new analytic and statistical challenges include emergency preparedness and emerging infectious diseases. CDC statistical programs have contributed to development of syndromic surveillance methods; evaluation of different civilian smallpox vaccination proposals; characterization of emerging infectious diseases, such as severe acute respiratory syndrome; and development of national health report cards. The anthrax investigations of September--December 2001 spurred development of multiple analytic techniques. These included maps linking analytic sampling activity with analytic results developed to better understand the spread and deposition of spore-containing particles and analyses of environmental sampling information (CDC, unpublished data, 2002). Stochastic simulation has been used to optimize patient flow-through in clinics dispensing oral antibiotics after a bioterrorism attack (13). Aberration detection in public health data represents another area of statistical contribution. For example, CDC's Smallpox Preparedness and Response Activity receives vaccination and adverse event data from several sources. These sources employ both active and passive data collection and provide registry, contraindication, and adverse events information. The CDC/ATSDR Statistical Advisory GroupThe CDC/ATSDR Statistical Advisory Group (SAG), a scientific workgroup sponsored by the Office of the Chief Science Officer (14), coordinates statistical activities throughout the agency. SAG was established in 1989 to act in an advisory capacity to the Office of the Director to facilitate and address statistical issues, problems, and opportunities that influence the quality and integrity of science at CDC and to coordinate agencywide statistical activities and increase communication across organizational components. SAG activities illustrate the breadth of statistical activity throughout CDC/ATSDR. Since 1989, biennial symposia have been held on topics of interest to the public health community, such as surveillance (15) and study design and decision making (16). Each year, SAG recognizes outstanding statistical papers published during the previous year with the CDC/ATSDR Statistical Science Awards. The most recent winners included manuscripts on capture-recapture analysis (17) and genetic studies (18). SAG is responsible for advanced statistical/epidemiologic training at CDC/ATSDR and maintains a listserv and intranet site. Other SAG statistical activities include participation in statistical/protocol review and institutional review boards and leadership in the development, procurement, and installation of statistical software available for use by researchers in the CDC/ATSDR community. SAG has provided review and advice on complex statistical and broad scientific issues, such as validation of the statistical design of the Vietnam Experience Study of the health of Vietnam veterans, and codeveloped an evaluation of recruitment and retention policies at CDC/ATSDR. Other special requests, such as for development of training materials or requests for interagency collaboration and sentation, also frequently are handled through SAG. Since 1990, SAG has sponsored an exhibit booth highlighting statistical activities at CDC/ATSDR that has been displayed at the Joint Statistical Meetings and other conferences for informational and recruiting purposes. Future Directions for Statistics at CDC/ATSDRThe critical role of statistics in accomplishing the mission of CDC/ATSDR will become even more apparent as the agency begins to align its activities around its overarching health protection goals. The assessment of burden, effectiveness of interventions, cost considerations, and evaluation frameworks all will require rigorous attention to methods of data-ollection, study design, and analytic technique. The ability of statisticians to ensure the most effective use of quantitative science in research and analysis and in meeting new challenges in the evolving public health mission of CDC/ATSDR will require reexamination of statistical skills and contributions. A multidisciplinary approach to investigation of public health problems, such as emergency preparedness and obesity, already is being realized. Continued valuable statistical input will be key to efficient use of new technologies, such as in informatics, Web-based query systems, geographic information systems, and survey data collection methodologies. Advances in the field of relational databases, for example, and its coupling with Web-based technology have facilitated improvements in the efficiency of data collection and increases in size and completeness of data available for analysis. The developing BioSense program (19), initiated at CDC and operational throughout the United States, uses existing health-care information from hospitals, ambulatory-care clinics, and commercial laboratories for early event detection and health situational awareness. Use of multisource data and further development of record linkage techniques to extract maximal information from existing data sources also will require addressing privacy and confidentiality concerns, as well as appropriate methods of communication of important public health findings to the nation. AcknowledgementThe authors appreciate the assistance of Dr. Jennifer Madans for her help in preparing this description of statistical activities throughout CDC/ATSDR. References
Figure 1 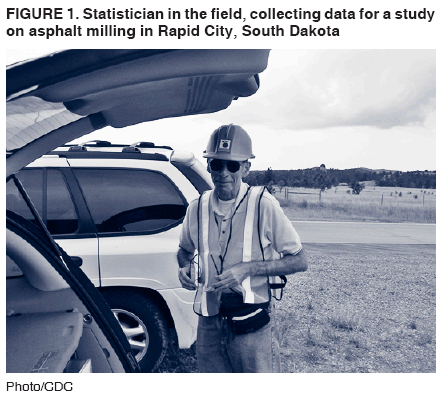 Return to top.
Disclaimer All MMWR HTML versions of articles are electronic conversions from ASCII text into HTML. This conversion may have resulted in character translation or format errors in the HTML version. Users should not rely on this HTML document, but are referred to the electronic PDF version and/or the original MMWR paper copy for the official text, figures, and tables. An original paper copy of this issue can be obtained from the Superintendent of Documents, U.S. Government Printing Office (GPO), Washington, DC 20402-9371; telephone: (202) 512-1800. Contact GPO for current prices. **Questions or messages regarding errors in formatting should be addressed to mmwrq@cdc.gov.Date last reviewed: 12/18/2006 |
|||||||||
|