 |
|
|
|
|
|
|
| ||||||||||
|
|
|
|
|
|
|
||||
| ||||||||||
|
|
|
|
|
Persons using assistive technology might not be able to fully access information in this file. For assistance, please send e-mail to: mmwrq@cdc.gov. Type 508 Accommodation and the title of the report in the subject line of e-mail. Ambulatory-Care Diagnoses as Potential Indicators of Outbreaks of Gastrointestinal Illness --- MinnesotaW. Katherine Yih,1 A. Abrams,1 R.
Danila,2 K. Green,2 K. Kleinman,1 M. Kulldorff,1 B. Miller,2 J. Nordin,3 R. Platt1
Corresponding author: W. Katherine Yih, Department of Ambulatory Care and Prevention, Harvard Medical School and Harvard Pilgrim Health Care, 133 Brookline Ave., 6th floor, Boston, MA 02215. Telephone: 617-509-9822; Fax: 617-859-8112; E-mail: katherine_yih@hphc.org. Disclosure of relationship: The contributors of this report have disclosed that they have no financial interest, relationship, affiliation, or other association with any organization that might represent a conflict of interest. In addition, this report does not contain any discussion of unlabeled use of commercial products or products for investigational use. AbstractIntroduction: Syndromic surveillance's capability to augment existing surveillance for community-acquired gastrointestinal disease is unknown. Objective: The objective of this study was to evaluate the capability of a syndromic surveillance system to detect outbreaks of gastrointestinal disease. Methods: A retrospective analysis was conducted comparing ambulatory care data from a health plan with a set of 110 gastrointestinal-disease outbreaks identified by the Minnesota Department of Health during 2001- -02. Unusual clusters of illness (i.e., signals) in the health-plan data were identified by analyzing daily counts of gastrointestinal illness using an adjusted space-time scan statistic. Concordance was defined as <5 km between outbreak and signal and the signal occurring within 1 week of the outbreak. Results: During 104 weeks, the number of signals was roughly what would have been expected by chance, suggesting that the modeling did a good job of estimating the expected counts of illness and that false alarms would not have occurred much more often than the number predicted at the various thresholds. During the same period, the health department identified 110 eligible gastrointestinal outbreaks. Apparent associations of the three statistically most unusual concordant signals with outbreaks of viral or bacterial gastrointestinal illness were ruled out by the health department on the basis of detailed knowledge of the circumstances and low numbers of affected persons seeking medical care. Conclusion: No previously known gastrointestinal outbreaks were identified by this surveillance system. However, relatively few recognized outbreaks resulted in patients seeking medical care, and the sensitivity of this system to detect outbreaks of real significance to public health remains to be determined. Prospective evaluation probably will be required to understand the usefulness of syndromic surveillance systems to enhance existing disease surveillance. IntroductionThe increasing availability of electronic health data and interest in biologic terrorism preparedness have accelerated the development of new public health-related disease surveillance systems, including systems intended to provide early detection of unusual clusters of illness before the etiology of the cases is known (1--4). This approach is sometimes referred to as syndromic surveillance. These systems could possibly augment public health departments' traditional systems of surveillance for naturally occurring disease, both through early detection and by providing better overall understanding of illness patterns. However, their usefulness for this purpose has not been convincingly demonstrated (5), and their performance needs to be evaluated (6), particularly in light of the resources required to establish and maintain these new surveillance systems and to respond to false or uninteresting alarms they might generate. Ultimately, these systems will be evaluated on the basis of their ability to provide useful information to guide public health practice. One way to assess this ability is to compare historic information from novel surveillance systems to actual morbidity reported to public health departments. In this report, information about unusual clusters of gastrointestinal illness obtained in the ambulatory-care setting was compared with information about outbreaks that a state health department obtained through routine disease surveillance. Gastrointestinal illnesses were selected because these are the most common discrete outbreaks that health departments investigate. MethodsSurveillance System OverviewThe surveillance system tested here monitors and analyzes daily counts of new cases of illness assigned by primary-care providers during the routine delivery of care. All participating health-care organizations use electronic medical records, allowing near real-time extraction of diagnosis information in a manner that is transparent to clinicians. This system has been described previously (7--10). The system includes data from health-care organizations in Colorado (Denver metropolitan area), eastern Massachusetts (Boston metropolitan area), Minnesota (Minneapolis-St. Paul metropolitan area), and central Texas (Austin area), and information from a nurse telephone triage company that operates in all 50 states. Together, these systems include approximately 20 million persons. Typically, health-care organizations identify encounters with International Classification of Diseases, Ninth Revision-coded diagnoses of interest that have occurred during the preceding day. They use open-source software to assign these encounters to syndromes defined by the CDC--Department of Defense working group (11) to identify and ignore repeat visits and to assign new episodes of illness to the ZIP code where the affected persons live. Health Plan Data Source and ProcessingThis report uses information about gastrointestinal illnesses in Minnesota, where the state health department provided data on a substantial number of recognized outbreaks for comparison. Ambulatory-care information during February 2001--January 2003 originated from HealthPartners, a 240,000-member health plan that services approximately 8% of the population in the Minneapolis-St. Paul metropolitan area in ZIP codes beginning with 550, 551, 553, 554, or 563. Signals of unusual clusters of gastrointestinal illness were identified by analyzing the daily counts of gastrointestinal illness with a space-time scan statistic (12), adjusting for day of the week, holidays, season, secular trends, and the unique characteristics of each ZIP code area (e.g., its population's health-seeking behavior) by means of a generalized linear mixed model (GLMM) (13,14) on the basis of past data. The space-time scan statistic is a likelihood-ratio test statistic that can detect clustering of cases in space and time. The "window" through which it "looks" can be visualized as a cylinder of variable size that moves across both space (with its circular base) and time (with its height). The maximum geographic size of the window was set at the size covering 25% of the adjusted population at risk (14) and the temporal length at 1 day. To reflect the degree to which characteristics of clusters (i.e., size for syndrome, location, and date) deviated from the expected, an index of statistical aberration called the "recurrence interval" was used (13--15). This recurrence interval is the expected number of days of surveillance needed for one such cluster of at least the observed magnitude to occur in the absence of any actual outbreaks and is the inverse of the nominal p value from the space-time scan statistic. Therefore, the larger the recurrence interval, the more unusual the cluster of illness. Because the maximum possible p value is 1, the minimum possible recurrence interval is 1 day, meaning one would expect clusters of that magnitude every day. The period analyzed was February 1, 2001--January 31, 2003. The statistical evaluation emulated a prospective surveillance system with data collection beginning on January 1, 2001. Statistical evaluation started on February 1, 2001, using data from January 2001 to calculate the expected counts. For every succeeding month, the expected counts were recalculated for each ZIP code area with at least one case as of then, incorporating the additional month's worth of data. The analyses in March 2001 used data from January--February 2001, the analyses in April 2001 used data from January--March 2001, and so on until the final month in the observation period (January 2003), whose analyses used data from January 2001--December 2002. The statistical evaluation probably improved over time. Information on Outbreaks From Health Departments, Exclusion CriteriaInformation about gastrointestinal illness outbreaks from 2001 through early 2003 was provided by the Minnesota Department of Health. These outbreaks had been detected by the department's foodborne and other surveillance systems and have been described separately (16). Most of these outbreaks involved foodborne transmission. Information included the ZIP code of the outbreak, the number of recognized cases, the date of presumed first exposure to the pathogen, the date of first onset of illness, the date the illness or outbreak was reported, and the date on which the health department initiated its investigation. From a list of 206, excluded were 1) outbreaks occurring outside of the catchment area of HealthPartners (i.e., not occurring in ZIP code areas beginning with 550, 551, 553, 554, or 563); 2) all institutional outbreaks (e.g., those in universities, prisons, and long-term care facilities) because affected persons would not have obtained care from HealthPartners; and 3) those events accompanied in the database by a comment of "no investigation" or "not an outbreak." This remaining list included 110 eligible outbreaks. When specific dates were unavailable, other dates were substituted for purposes of the comparison with the HealthPartners data: three outbreaks lacked first exposure date, so date of first onset was substituted; seven outbreaks lacked the date the investigation was initiated, so the report date was used for three and the date of first onset of symptoms was used for the remaining four. All of these substitutions would have reduced the chances of a finding a match with syndromic surveillance signals because they all shortened the time-window for comparison. Comparison of Syndromic Surveillance Signals and Known OutbreaksThe correspondence between outbreaks of gastrointestinal illness reported by the health department and signals detected in the ambulatory-care data were examined. Signals were defined as clusters with recurrence intervals greater than or equal to each of six threshold values ranging from 2 weeks through 2 years. The date and ZIP code areas of outbreaks identified by public health authorities were compared with those signals detected in the ambulatory- care data. Signals and known outbreaks were considered concordant if they satisfied both geographic and temporal proximity requirements. The geographic requirement stipulated that the closest point in the significant ambulatory-care signal area and the centroid of the outbreak ZIP code area be within 5 km of each other. This distance was selected to allow some chance that affected persons, effectively located at the centroid of their ZIP code of residence, would be linked to an outbreak placed at the centroid of the ZIP code where exposure was thought to occur (e.g., a restaurant). The timing requirement, set a priori, was that the signal in the ambulatory-care data occur in the period from 1 week before the first known exposure of a case in the outbreak determined by the health department to 1 week after the investigation was initiated. The rationale for this interval was that some outbreaks might have started before the first exposure known to the health department and might have continued for at least several days beyond the start of the health department's investigation. This temporal criterion might have been overly generous. For example, in point-source outbreaks where first-exposure dates were known with certainty, a more appropriate approach might have been to eliminate from consideration any putative matching signals occurring during the week before the first exposure. If a signal was concordant with more than one outbreak, only its association with the geographically closest outbreak was kept. All the substitutions for missing exposure or investigation dates would have reduced the potential for concordance by decreasing the eligible period scanned and would have reduced the timeliness of any concordant signal by using an earlier comparison date in lieu of the investigation start-date. Statistical Analysis of "Hits"To determine whether more hits (signals concordant with outbreaks) occurred than would be expected by chance in the analysis of the Minnesota outbreaks, a permutation-based test (17) was used to ascertain the distribution of the number of hits to be expected by chance alone. The null hypothesis in such an approach is that no relation exists between the outbreaks found by the health department and the signals found by the syndromic surveillance system, except by chance co-occurrence. Under the null hypothesis, it was not assumed that the signals would be either evenly distributed across the map (because of variations in density of the population at risk) or evenly distributed over time (because of known seasonal patterns in illness). Therefore, the null hypothesis is that the space-time scan statistic signals occurred randomly (not evenly) in space-time, conditioned on the purely spatial and purely temporal empirical distributions. The alternative hypothesis is that signals occur in close proximity to the known outbreaks in both space and time. The temporal and spatial components of the health-plan--based syndromic surveillance signals were randomly permuted (i.e., each random data set included the same collection of signal days and the same collection of signal locations and sizes, but the pairing of the temporal and spatial attributes was randomized or "permuted"). Therefore, the temporal and spatial elements were no longer associated; however, the two spatial attributes, location and size, always stayed together. For each of 999 randomly permuted data sets, the number of hits with the health department outbreaks was calculated in exactly the same way as for the real signals, and then all 1,000 numbers were ordered from both the real and random data sets. If hits were random, then the rank of the number of hits from the real data would be equally likely to be any number from one to 1,000, and the rank of the number of hits from the real data would be in the top 5% (or x%) 5% (or x%) of the time. This provides a p value for the null hypothesis that the observed number of concordant signals arose solely by chance, defined as p = rank / (number of random datasets + 1) (18). The test is not meaningful where the number of signals is <5. ResultsSyndromic Surveillance SignalsDuring two calendar years covering approximately 1.3 million person-years, one gastrointestinal syndrome signal was identified with a recurrence interval of at least 2 years and 58 signals with a recurrence interval of at least 2 weeks (Table 1). The number of signals was only marginally more than what would have been expected by chance and not statistically significantly more than expected for any of the thresholds (one-sided test, p = 0.22 for RI = 2 weeks, p>0.05 for all), raising the question of whether any of these signals reflected a true outbreak. The median number of health-plan cases in these signals was four to nine; the median radius ranged from 0 km (with one ZIP code area) to 10 km (with a median of 15 ZIP code areas). Known OutbreaksDuring the same 2-year period, the health department identified 110 eligible gastrointestinal outbreaks, with a median number of seven recognized cases (Table 2). Foodborne outbreaks were most common, followed by person-to-person and environmental sources. Approximately half of the outbreaks were caused by viral pathogens such as caliciviruses (or noroviruses, a genus within the calicivirus family), which generally cause self-limiting illness. The patients in most of the outbreaks of gastrointestinal illness investigated by the Minnesota Department of Health rarely seek professional health care. Comparison of Syndromic Surveillance Signals and Known OutbreaksThe number of hits increased with more inclusive thresholds. One (of one) signal was concordant with an outbreak at the 2-year threshold; 17 (29%) were concordant with outbreaks at the 2-week threshold (Table 3). Of the 110 outbreaks, one had a concordant signal at the 2-year threshold; this number increased to 14 (13%) at the 2-week threshold. The probability that the observed number of concordant signals occurred by chance alone was in no instance significant. The three unique instances of concordance between signals and outbreaks at the more restrictive thresholds of 6 months involved foodborne outbreaks of Bacillus cereus and probable calicivirus (with 17 and 13 ill, respectively) and a person-to- person outbreak of suspected viral gastroenteritis (17 ill). However, all three were ruled out as true associations by the health department on the basis of the circumstances and the low numbers of affected persons seeking medical care. DiscussionWhen evaluating a syndromic surveillance system, the two most important features are the number of false signals and the number of true outbreaks detected. With respect to the former, the number of signals was roughly what would have been expected by chance alone, suggesting that the modeling did a good job of estimating the expected counts of illness and that false alarms would not have occurred much more often than the number predicted at the various thresholds. This implies that health departments need not be concerned about unexpectedly high numbers of false alarms from this surveillance system and the consequent waste of resources to investigate them. Of the previously known outbreaks of gastrointestinal illness, none were found with certainty in this retrospective study. The three most unusual signals (with recurrence intervals of at least 6 months) that appeared linked to outbreaks were ultimately deemed unrelated by the health department. Instances of concordance between signals and outbreaks where the signals where less strong (those with recurrence intervals of <6 months) were not investigated in depth, so the plausibility of a true connection in those cases is unknown, although it could be clarified through additional investigation of outbreak data and patient-level data held at the health plan. Sensitivity of the system was low at all thresholds. Among the possible reasons for this finding is that approximately two thirds of foodborne outbreaks in Minnesota are caused by caliciviruses, which lead to a selflimiting illness for which the affected typically do not seek medical care. Other possible reasons for low sensitivity include the somewhat low proportion (about 8%) of the Twin Cities population in the surveillance system and the fact that points of exposure (e.g., a lunch-time restaurant) might be far from the ZIP codes of residence on which the signal detection method is trained. Of the unlinked signals, although many might have been false alarms, others might have represented undetected outbreaks. For example, outbreaks where no laboratory specimens are submitted can elude Minnesota's enhanced surveillance systems. Distinguishing between these two was not possible in this study because such a determination requires case-by-case investigation, possibly including specimen collection and interviews, which would not likely be informative so long after the events. ConclusionProspective evaluation is the best way to understand the usefulness of syndromic surveillance systems to enhance existing public health surveillance because it allows immediate case-by-case investigation of exposure histories and course of illness and the collection of clinical specimens. Performance probably will vary depending on the type of acute illness in question because of differences in such characteristics as predominant mode of transmission, speed of transmission, severity of illness, and whether the disease is reportable to state or local health departments. In any prospective evaluation, it will be important to determine not only how often signals and true outbreaks are associated with each other but how many detected outbreaks are of public health significance, how many of those are also picked up by existing public health surveillance systems, and how many of those doubly detected outbreaks are identified earlier by the syndromic surveillance system. Acknowledgments This work has been supported by CDC cooperative agreement UR8/CCU115079 and Minnesota Department of Health contract A57182. Daniel Neises tabulated the outbreaks in the realization of his Master of Public Health thesis, and Arthur Davidson and Ross Lazarus critiqued early drafts. References
Table 1 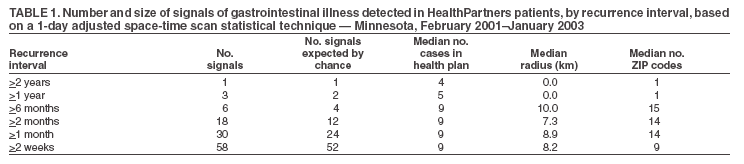 Return to top. Table 2 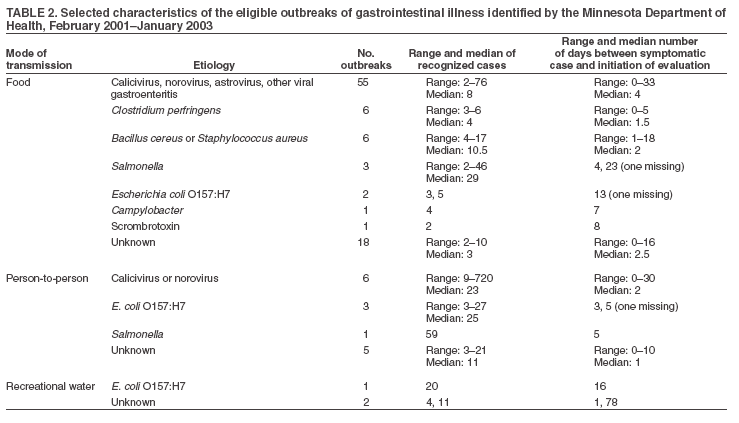 Return to top. Table 3 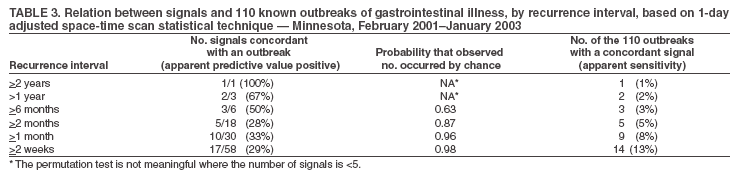 Return to top.
Disclaimer All MMWR HTML versions of articles are electronic conversions from ASCII text into HTML. This conversion may have resulted in character translation or format errors in the HTML version. Users should not rely on this HTML document, but are referred to the electronic PDF version and/or the original MMWR paper copy for the official text, figures, and tables. An original paper copy of this issue can be obtained from the Superintendent of Documents, U.S. Government Printing Office (GPO), Washington, DC 20402-9371; telephone: (202) 512-1800. Contact GPO for current prices. **Questions or messages regarding errors in formatting should be addressed to mmwrq@cdc.gov.Date last reviewed: 8/5/2005 |
|||||||||
|