|
|
|
|
|
|
|
| ||||||||||
|
|
|
|
|
|
|
||||
| ||||||||||
|
|
|
|
|
Persons using assistive technology might not be able to fully access information in this file. For assistance, please send e-mail to: mmwrq@cdc.gov. Type 508 Accommodation and the title of the report in the subject line of e-mail. Initial Evaluation of the Early Aberration Reporting System --- FloridaYiliang Zhu,1 W. Wang,1 D.
Atrubin,2 Y. Wu1
Corresponding author: Yiliang Zhu, Department of Epidemiology and Biostatistics, University of South Florida, 13201 Bruce B. Downs Blvd., MDC 56, Tampa, FL 33612. Telephone: 813-974-6674; Fax: 813-974-4719; E-mail: yzhu@hsc.usf.edu. Disclosure of relationship: The contributors of this report have disclosed that they have no financial interest, relationship, affiliation, or other association with any organization that might represent a conflict of interest. In addition, this report does not contain any discussion of unlabeled use of commercial products or products for investigational use. AbstractIntroduction: In recent years, many syndromic surveillance systems have been deployed around the United States for the early detection of biologic terrorism--related and naturally occurring outbreaks. These systems and the associated aberration detection methods need to be evaluated. Objective: This study evaluated several detection methods of the Early Aberration Reporting System (EARS) under serially correlated syndromic data and to demonstrated the need for calibrating these methods. Methods: In an initial evaluation of the Syndromic Tracking and Reporting System in Hillsborough County, Florida, serially correlated syndromic data were simulated using statistical models in conjunction with real syndromic data. The detection methods were tested against two patterns of simulated outbreaks. They were compared using a conditional average run length and a receiver operating characteristic curve under defined patterns of detection. Results: Increasing serial correlation inflates the false alarm rate and elevates sensitivity. Among the detection methods in EARS, C2 and P-chart have the best overall receiver operating characteristic curve within the context of the simulations. C2 is least affected by the serial correlation, the outbreak type, and the defined patterns of detection signal. Conclusion: Evaluation of the detection methods needs to be adaptable to the constantly changing nature of syndromic surveillance. Deployment of EARS and other methods requires adjusting the false alarm rate and sensitivity in accordance with the syndromic data, the operating resources, and the objectives of the local system. For timely detection, C2 is superior to other methods, including C3, under the simulation conditions. Pchart is the most sensitive when the serial correlation is negligible. IntroductionThe risk for biologic terrorism attacks has promoted the development and deployment of syndromic surveillance systems in the United States and around the world (1). The majority of these systems use patient or consumer encounter data from multiple sources (e.g., hospital emergency departments (ED), military facilities, or theme parks). Workplace absenteeism and over-the-counter drug sales are also being monitored for statistical aberrations. The data are converted to specified syndrome categories and analyzed to detect significant temporal or spatial aberrations that deviate from the expected baseline trends. Although some systems conduct spatial analysis (2), most use trend analysis to detect temporal aberrations. Developed by CDC, the Early Aberration Reporting System (EARS) consists of a class of quality- control (QC) charts, including Shewhart chart (P-chart), moving average (MA), and variations of cumulative sum (CUSUM) (3). Many syndromic surveillance systems use EARS for temporal aberration detection (4); some also use other QC charts such as exponentially weighted moving average (EWMA) (5,6). A common characteristic in adopting these QC charts for syndromic data analysis is the use of a sample estimate for the baseline mean and standard deviation (SD). This approach circumvents the difficulties associated with the modeling of the baseline trend of the syndrome, a process complicated by the discreteness, serial correlation, seasonality, and daily fluctuation of the syndromic data. At present, understanding of these methods within the context of syndromic data is limited, and systematic evaluations of syndromic surveillance have not been conducted. In QC settings, serial correlations can substantially affect the time length to the first aberration signal (Average Running Length [ARL]) when using such methods as CUSUM and P-chart (7,8). How serial correlation also could affect other performance measures such as the false alarm rate (one minus specificity) or the sensitivity (defined generally as the probability of successful detection [PSD] associated with a pattern of signals) is unclear. Certain signal patterns or event detection (e.g., signaling three days in a row) might provide more information than a single day signal about the strength or duration of the outbreak, thus guiding public health agencies in designating the necessary followup investigation according to the strength of the signals (9). Simulation studies were conducted to evaluate the sensitivity and specificity of a single day signal for three EARS' variations of CUSUM (C1, C2, and C3) (10), a seasonally adjusted CUSUM, and an historic limits method (11). However, these simulations assumed serially independent data, with the magnitude of aberrations ranging between 1.65 to 51.0 times the baseline mean (10) or 2--3 times the baseline standard deviation. Seasonality was added to simulated baseline data in the second study (11), but was not modeled in the baseline mean. The simulation indicated that C3 is superior to C2, without controlling for specificity. This study focuses on the impact of serial correlation on the PSD of selected patterns of signals and compares the performance of five common detection algorithms (P-chart, C2, C3, MA [employed in EARS], and EWMA [a general statistical QC chart not included in EARS]). Two different outbreak patterns are considered here. The comparisons are based on two criteria. The first criterion is a conditional average run length (CARL) given successful detection in a given time window. The second is the receiver operation characteristic (ROC) curves. The purpose is to provide guidance for selection of detection methods and to illustrate the need for calibrating the methods to attain a required level of specificity and sensitivity. MethodsDetection AlgorithmsThe QC charts in EARS use daily syndromic counts or incidences (daily counts of a specific syndrome divided by total ED volume for the day) yt between day t-K+1 and day t (current day) to derive a monitoring statistic mt (4). The monitoring statistic is
for P-chart, MA, and EWMA, respectively. P-chart uses the current day only; MA is the average of K days before and including the current day; EWMA is a weighted average of all previous days with an exponentially decreasing weight given to days further away from the present day. The system generates a signal if mt exceeds a threshold c σm above the expected level µm. The PSD of a single alert (sensitivity) is the probability Pr(mt -µm > cσm) given an outbreak. The constant c determines the threshold in multiples of the standard deviation σm. Because the distribution of mt is complex, EARS uses a sample estimate of µm and σm on the basis of data in a baseline window of B days: yt-B-g, yt-B+1-g, …, yt-1-g with a gap of g days before the present day t. Specifically,
EARS also employs three variations of the CUSUM method (4) (C1, C2, and C3). C1 uses data from the current day only and a baseline window of the preceding 7 days: day t-7 to t-1 (B = 7 and g = 0). If C1 generates a signal on day t, day t will become a part of the baseline for day t+1, which might inflate the corresponding baseline mean µm, and reduce the PSD for that day. C2 differs from C1 by shifting the 7-day baseline window to left with a gap of g = 3 days. As a result, its PSD of signaling on day 2 and 3 is not affected by a signal on day 1. Analytically, C1 and C2 are nearly equivalent in the absence of outbreaks, but C2 is more sensitive than C1 in signaling a continued outbreak past its onset. For this reason, C1 was not evaluated. C3 differs further from C2 by using a partial sum of positive daily deviations for the current and 2 previous days (t-1 and t- 2):
The superscript + truncates the quantity in the parentheses to zero if its value is negative, and I assumes the value 0 if y > µm + 3σm for (t-1 and t-2) or 1 otherwise. Thus, C3 includes only the deviations that are 1--3 standard deviations above its mean and will generate a signal if mt is >2, the default threshold in EARS. C2 exceeding the threshold of 3 implies the first component of mt (C3) exceeds the threshold of 2. In EARS, the sample estimate of mean µm does not adjust for seasonality (e.g. the day-of-the-week effects) of the baseline. Ideally, seasonality can be filtered out before applying these methods to the data. Performance MeasuresQC charts are traditionally evaluated with respect to the sensitivity and false alarm rate (one minus specificity) of single day detections (10,11). Because disease outbreaks probably are associated with temporal patterns, corresponding patterns of aberration signals should be considered. For example, with a disease outbreak that persists at a high level of incidence or count for a number of days after onset, consecutive signals might alert not only the onset but also the duration of the outbreak. Such a pattern of signals is called a detection event. More importantly, public health workers can use a detection event to estimate the duration or strength of an outbreak and respond accordingly. Therefore, detection events of composite detection signals (e.g., the first or the first pair of consecutive signals) are used to define sensitivity and false alarm rates, which are in turn converted to ROC curves and used as an overall performance measure. Average run length (ARL) also provides information on the distribution of time to first signal. Analytical results on run-length distribution are difficult to obtain for the monitoring statistic (12), so a conditional ARL is considered by assuming a detection event on the first day or the first two days (within the first 4--5 days of the outbreak). SimulationsDaily ED visit data were collected from a local hospital during March 2002--December 2003. A common syndrome, respiratory infection (RI), was chosen for simulation. The data revealed an average daily visit of 155 patients (standard deviation = 32.6). Daily RI count was 5.96 on average, or 0.0319 in incidence. The patient volume and RI count showed a lag-one serial correlation between two consecutive observations of 0.768 and 0.438, respectively. The lag-one correlation for incidences was 0.323. The magnitude of these correlations is expected for common syndromes; rare syndromes are less correlated. Ignoring the serial correlation can yield a misleading level of sensitivity and false alarm rate. The data also indicated day-of-week-effects (lower values on Friday and peaks on Sunday and Monday). In evaluating the detection methods used in STARS, these simulations did not incorporate day-of-the-week effects in the baseline. On the basis of these parameters derived from the RI data, multilevel, generalized linear mixed-effects models (13) were used to simulate the baseline of daily ED volume Nt and RI count Xt. Under the Poisson distribution for Nt, the daily mean λt fluctuates around a constant λ0 with log(λt) = log(λ0) + α-t . Random effects αt characterize the variation, which are serially correlated through a classic first order autoregressive time series (AR1) model αt = Ø1 a t-1 + ε1t . The errors {ε1t} are independent, normal N(0,σ21). Presently, λ0 = 155, Ø1 = 0.8, and α1 = 0.479 are used to approximate the observed parameters. The simulation model for count Xt uses a binomial distribution B(Nt, pt) given the volume Nt and incidence pt. The incidence pt fluctuates around the baseline average p0 through the model logit (pt) = logit (p0) + βt with the random effects βt also following an AR1 time series model βt = Ø2 βt-1 + ε2t . The errors {ε2t} were independent, normal N(0,σ21). The RI data suggested p0 = 0.0319, Ø2 = 0.699, and σ2 = 0.315 (9). Each simulation consists of 100 days of data {Nt , Xt}, and the study involved 5,000 replications. Simulated incidences yielded a sample serial correlation of 0.277 (SD = 0.175). Outbreak data are simulated under two patterns: a slow-building and a sudden-surge trend. The slowbuilding trend is characterized by a constant-pace increase in incidence that peaks on day 4 as it rises to three times the incidence at baseline. It then decreases at a constant rate back to the baseline by day 8. A norovirus outbreak that is spread from person-to-person with a short incubation period of 12--50 hours could produce such a pattern. The sudden-surge trend describes an elevation of incidence to three times that of the baseline on day 1, remaining at the same level for the following 3 days, then dropping back to the baseline level on day 8 at a constant rate. A foodborne salmonellosis outbreak is a good example of an outbreak of such a pattern. If persons were exposed during a 1--2 day window, many cases would be expected in a 3-4 day period, with the cases declining over the next few days. Secondary cases could occur as a result of person-to-person transmission that could account for some of the cases occurring during the end of the outbreak. The magnitude for the simulated outbreaks was chosen at three times that of the baseline; the actual size will depend on several factors, particularly the size of the exposed population. Syndromic cases were simulated using the same models for the baseline but under the incidence parameters of the designed outbreak pattern and size. Outbreak cases replaced baseline data between day 81 and day 87. Simulations were also conducted with zero serial correlation to further demonstrate the impact of correlation. Detection methods were tested against 5,000 replications of the outbreak and nonoutbreak data during days 61-67. The periods of the outbreaks and nonoutbreaks were chosen to ensure that the simulated data reached statistical stability. The false alarm rate was calculated by the number of detected events divided by the total possible number of detection events during the nonoutbreak period. PSD was estimated identically, but over the outbreak period. ResultsConditional ARLThe probability of successful first detection on day one, two (no alert on day 1), three (no alert on day 1 and day 2), or four (no alert on day 1, day 2, and day 3) varies, along with the probability of first detection within the first four days of the slow-building outbreak (Table 1). The detection algorithms were calibrated by a varying threshold so that the probability of false alert was approximately 0.05. Given the PSD within 4 days, the conditional average run length (CARL) is the weighted average of the days to the first detection, with the weight being the conditional probabilities of detection on each day, given detection by day four. P-chart has the highest probability (0.97) of first signal within four days, and MA has the lowest (0.32). Given detection by day four, CARL is 2.60 for P-chart and 3.32 for EWMA (λ=0.72). For a single day, C2 is more likely to signal (PSD = 0.18) than others on day 1, P-chart on day 2 and 3 (0.33 and 0.37), and EWMA on day 4 (0.45). With the detection event of first pair of consecutive signals, CARL is the weighted average of PSD on days 1 and 2, 2 and 3 (but not day 1), up to days 4 and 5 (Table 2). The PSD decreases with time for C2, C3, and P-chart, and increases for EWMA. With the sudden-surge outbreak, the PSD of first signal (Table 3) and of first pair of consecutive signals (Table 4) decreases with time, with the only exception being MA on days 1 and 2 (Table 3). For the event of day 1 signal, Pchart has the highest PSD followed by C2. For the event of first pair of consecutive signals, the five methods are comparable on days 1 and 2, but EWMA (λ=0.464) retains a slightly higher PSD on days 2 and 3. ROC CurvesFor the serially correlated baseline (ρ=0.277) with the slow-building outbreak, the ROC curves of first detection occurred on day 1 (Figure 1). Each marked point on an ROC curve indicates the PSD (sensitivity, verticalaxis) and false alarm rate (one minus specificity, horizontal-axis) associated with a given threshold. As the threshold increases, the point moves to the left along the ROC curve. The PSD can be read off of a ROC curve at its intersection with a vertical line given a fixed false alarm rate. The overall performance of a detection method is evaluated by the area under the curve. Thus, a method associated with a higher ROC curve is superior to one with a lower ROC curve. Ideally, ROC curves are plotted in an identical range of false alarm rates. However, because the false alarm rate is unknown for a given threshold, a sequence of threshold levels with 0.25 increments were used in determining the plotting range of false alarm rate for each curve. As a result of this approximation, ROC curves do not fill the maximum intended range in each plot. C2 has the best ROC for day 1 detection within the common range, followed by C3 and P-chart (Figure 1). This clarifies the misperception that C3 is more sensitive than C2 when one holds the threshold constant. C3 is only more sensitive if one ignores the higher false alarm rate associated with it. A threshold of 3 for C2 (third point from left) is similar to that of 4.75 for C3 (fourth point from left) in terms of false alarm rate (Figure 1). For consecutive signals on days 1 and 2 (Figure 2), C2 retains the highest PSD; MA and EWMA remain low. As the false alarm rate reaches a level above 5%, C3 performs nearly as well as C2 (Figures 1 and 2). Under the sudden-surge outbreak, the ROC curves of day 1 detection (Figure 3) demonstrate a superior performance of P-chart compared to the other algorithms, with C2 performing nearly as well. At an approximately 2% false alarm rate, the PSD is approximately 60% for P-Chart (Figure 3) for the sudden-surge outbreak. In contrast, the PSD is less than 5% for the slow-building outbreak (Figure1). The PSD is generally higher with outbreaks of large magnitude. ROC curves for signals on both days 1 and 2 (Figure 4) indicate that C2 and P-chart perform the best. C3 is comparable only when the false alarm rate exceeds 5%. MA and EWMA gain in the PSD as the outbreak sustains itself (Figures 3 and 4). ROC Associated with a Zero CorrelationTo further demonstrate the impact of serial correlation on aberration detection, 5,000 replications of baseline and outbreak data with serial correlation ρ = -0.0176 (theoretically ρ = 0) were generated. The ROC curves of detection on day 1 of the slow-building outbreak (Figure 5) indicate that P-chart is most capable, followed by C2, C3, and EWMA; MA was the least capable. PSD increases for all methods, particularly P-chart, compared with the case of moderate correlation (Figure 1). Similar results are observed for the ROC curves of detection on both of the first two days (Figure 6) compared with correlated case (Figure 2). P-chart is superior to the other algorithms. Evaluation under the sudden-surge outbreak with zero correlation yielded a similar conclusion. The PSD is generally higher in the absence of serial correlation. However, EWMA now places second in PSD, behind P-chart. PSD increases rapidly as the false alarm rate increases at the lower end (Figure 7). Compared with the nearly linear ROC curves under the slow-building outbreak (Figure 3), the PSD is larger under outbreaks of larger magnitude. The ROC curves of detection on both of the first 2 days (Figure 8) again depict a superior performance of P-chart, closely followed by EWMA. Unexpectedly, C3 has the lowest PSD when the false alarm rate falls below 0.01. ConclusionOn the basis of the CARL and ROC, these simulations suggest that P-chart has the best overall performance when the data are serially independent under both the slow-building and sudden-surge outbreak (Table 5). This conclusion holds true for both detection on day 1 and detection on both day 1 and 2. Under the slow-building outbreak, C2 delivers the second best performance; under the sudden-surge outbreak EWMA performs well, closely following P-chart and clearly outperforming C3, especially at the lower false alarm rates. With the moderate serial correlation (0.277), C2 has the best ROC under the slow-building outbreak, followed by C3. However, C3 is outperformed by C2 with respect to both day 1 detection and consecutive signals on day 1 and 2 at the lower false alarm rates. Under the sudden-surge outbreak P-chart and C2 outperforms the other methods. The difference between P-chart and C2 is generally small. Contrary to the common perception among the users of EARS, C3 is not more sensitive than C2 once the false alarm rate is held constant. With an emphasis on timely detection of outbreaks within the first few days of onset, the findings of this report suggests the use of C2 and P-chart for surveillance purposes when the syndromic data are moderately correlated. Surveillance of rare syndromes also might benefit from EWMA because rare syndromes tend to be less correlated. EWMA also is expected to be more sensitive as an outbreak persists. Serial correlation can considerably increase the false alarm rate and reduce the PSD. For example, the PSD of Pchart is approximately 0.20 with the false alarm rate of 0.04 for independent data; as the serial correlation increases to 0.277, the PSD decreases to approximately 0.075. In general, similar trends hold, although the magnitude of such impacts varies between detection methods and detection events. These trends were confirmed by an additional simulation with a higher serial correlation. The impact on MA and EWMA is particularly pronounced because these methods depend on an average of several days' data. C2 appears to be least affected by serial correlation and is most robust. For example, the PSD of C2 declined from approximately 0.22 to 0.20 while holding the false alarm rate at 0.06; at the false alarm rate of 0.04, the PSD stayed almost constant. This offers another justification for favoring C2. Another simulation was conducted to evaluate the use of count data (9). In comparison with daily incidence, using counts yielded slightly higher false alarm rates and PSDs. It seems practical to use counts for monitoring rare syndromes and proportions for common syndromes. The two approaches would be similar when the ED volume is stable and only specific syndrome cases fluctuate. Syndromic data might demonstrate day-of-the week effects, which can be accounted for through modeling of the mean µm and the standard deviation σm. This is not done in EARS. Assessing the impact of ignoring such trend on the methods of EARS would be useful (11). Modeling syndromic data is complex, requiring sufficient amounts of historical data. Because syndromic data might vary by location, season, syndrome category, and type of outbreak, performance of aberration detection methods must be evaluated specifically. Appropriate use of any detection method requires evaluation and calibration of its operating characteristics. Although a higher level of PSD is generally desirable, false alarm rate needs to be controlled at a level according to the objectives of the local system and resources required to maintain the system. References
Table 1 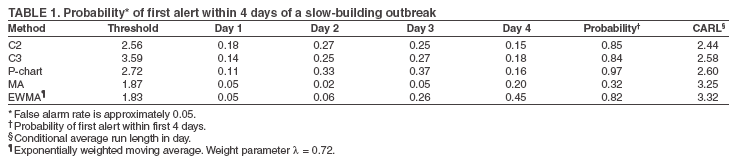 Return to top. Figure 1 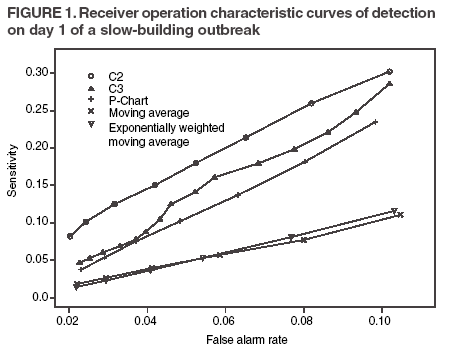 Return to top. Table 2 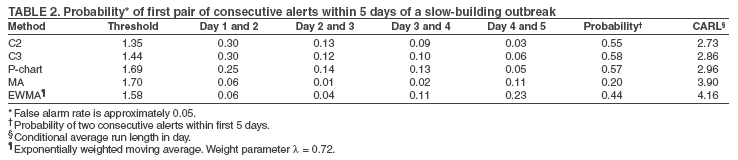 Return to top. Figure 2 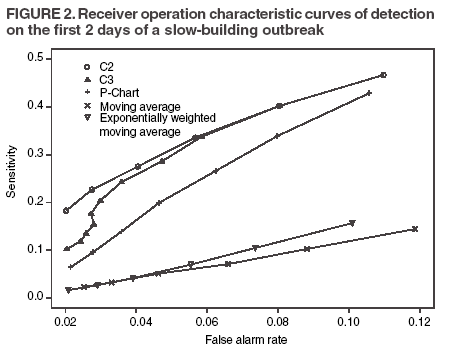 Return to top. Table 3 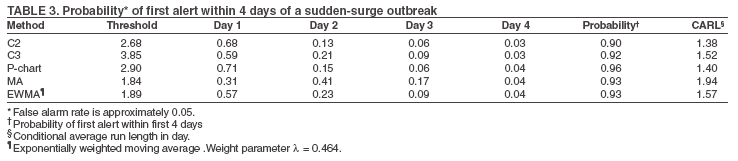 Return to top. Figure 3 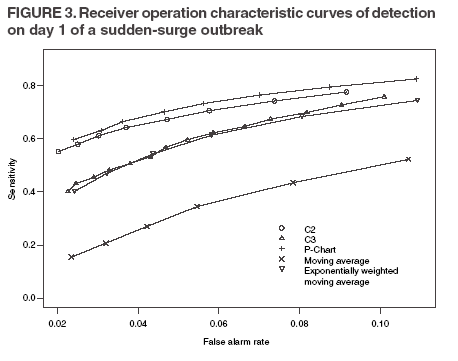 Return to top. Table 4 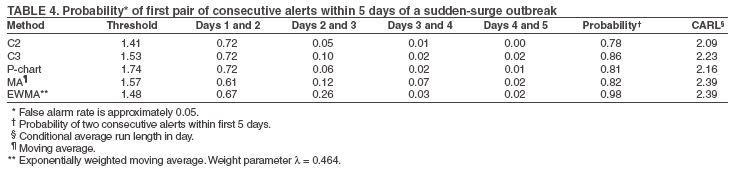 Return to top. Figure 4 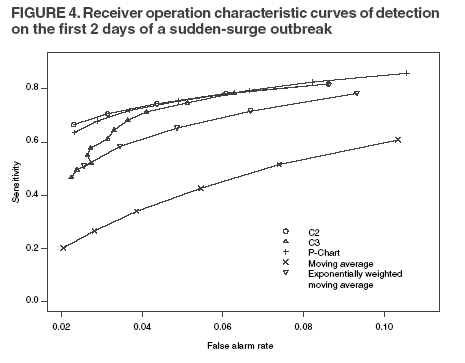 Return to top. Table 5 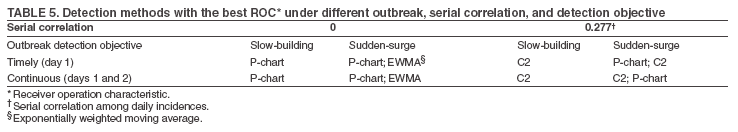 Return to top. Figure 5 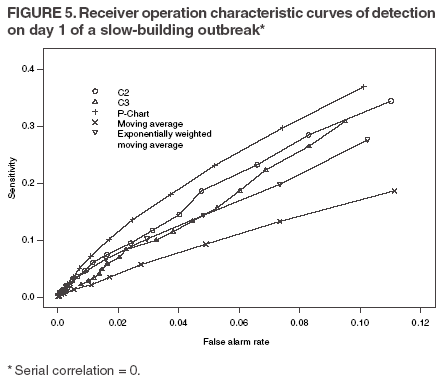 Return to top. Figure 6 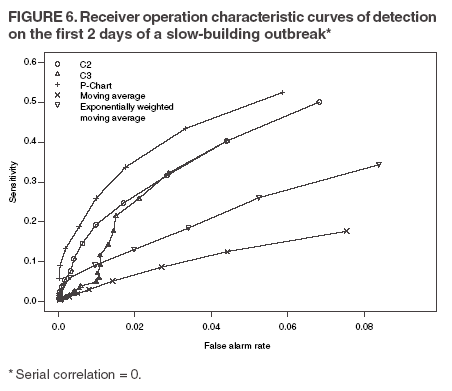 Return to top.
Disclaimer All MMWR HTML versions of articles are electronic conversions from ASCII text into HTML. This conversion may have resulted in character translation or format errors in the HTML version. Users should not rely on this HTML document, but are referred to the electronic PDF version and/or the original MMWR paper copy for the official text, figures, and tables. An original paper copy of this issue can be obtained from the Superintendent of Documents, U.S. Government Printing Office (GPO), Washington, DC 20402-9371; telephone: (202) 512-1800. Contact GPO for current prices. **Questions or messages regarding errors in formatting should be addressed to mmwrq@cdc.gov.Date last reviewed: 8/5/2005 |
|||||||||
|