 |
|
|
|
|
|
|
| ||||||||||
|
|
|
|
|
|
|
||||
| ||||||||||
|
|
|
|
|
Persons using assistive technology might not be able to fully access information in this file. For assistance, please send e-mail to: mmwrq@cdc.gov. Type 508 Accommodation and the title of the report in the subject line of e-mail. High-Fidelity Injection Detectability Experiments: a Tool for Evaluating Syndromic Surveillance SystemsGarrick L. Wallstrom, M. Wagner, W. Hogan Corresponding author: Garrick L. Wallstrom, RODS Laboratory, University of Pittsburgh, Suite 550, Cellomics Building, 100 Technology Drive, Pittsburgh, PA 15219. Telephone: 412-383-8141; Fax: 412-383-8135; E-mail: garrick@cbmi.pitt.edu. Disclosure of relationship: The contributors of this report have disclosed that they have no financial interest, relationship, affiliation, or other association with any organization that might represent a conflict of interest. In addition, this report does not contain any discussion of unlabeled use of commercial products or products for investigational use. AbstractIntroduction: When public health surveillance systems are evaluated, CDC recommends that the expected sensitivity, specificity, and timeliness of surveillance systems be characterized for outbreaks of different sizes, etiologies, and geographic or demographic scopes. High-Fidelity Injection Detectability Experiments (HiFIDE) is a tool that health departments can use to compute these metrics for detection algorithms and surveillance data that they are using in their surveillance system. Objective: The objective of this study is to develop a tool that allows health departments to estimate the expected sensitivity, specificity, and timeliness of outbreak detection. Methods: HiFIDE extends existing semisynthetic injection methods by replacing geometrically shaped injects with injects derived from surveillance data collected during real outbreaks. These injects maintain the known relation between outbreak size and effect on surveillance data, which allows inferences to be made regarding the smallest outbreak that can be expected to be detectable. Results: An example illustrates the use of HiFIDE to analyze detectability of a waterborne Cryptosporidium outbreak in Washington, DC. Conclusion: HiFIDE enables public health departments to perform system validations recommended by CDC. HiFIDE can be obtained for no charge for noncommercial use (http://www.hifide.org). IntroductionWhen public health surveillance systems are evaluated, CDC recommends that the expected sensitivity, specificity, and timeliness of surveillance systems be characterized for outbreaks of different sizes, etiologies, and geographic or demographic scopes (1). An important approach for computing these metrics is the simulation of outbreaks. Researchers have developed injection methods in which artificial spikes, perturbations of the surveillance data, are injected into a time series of real surveillance data from nonoutbreak periods (2--4). This method is called semisynthetic, because artificial data are injected into real data. After a spike is injected, any outbreak detection algorithm can be run on the injected time series to determine whether the spike can be detected, on what date, and with what false alarm rate. To understand how the detection algorithm would work on average, the injection is then repeated systematically with the inject date moving forward one time unit per repetition (Figure 1). From the results of this procedure, the parameters of sensitivity, false alarm rate, and timeliness for spike detection can be computed. To explore detection algorithm performance at different false alarm rates, the entire procedure is then repeated, varying the detection algorithm alarm threshold. The results are typically displayed graphically by using activity monitor operating characteristic (AMOC) curves (Figure 2) (5). The primary limitation of the semisynthetic technique is that it only determines the smallest spike that could be detected, leaving unanswered the key detectability question, "What is the smallest outbreak that can be detected?" For example, the first published semisynthetic analysis injected spikes that increased linearly in height over time into daily sales data of cough products (2). The results indicated that if an outbreak increased sales by a factor of 1.36, it would be detected. The limitation is what size outbreak increases sales by a factor of 1.36 is unknown. A second limitation of semisynthetic analyses conducted is the use of geometrically shaped injects, which might be poor estimates of actual temporal outbreak contours and which do not account for variations in the data as a result of individual behavior. An alternative injection technique addresses these limitations by forming injections with a shape derived from surveillance data collected during an actual outbreak (6). This inject is called a high-fidelity inject. Moreover, with this technique, the height of the inject is scaled in a method that preserves the known relationship between the magnitude of the real outbreak and the strength of the signal in the surveillance data from the real outbreak. Because of this property, a detectability analysis can be used to determine the smallest outbreak that can be detected. The scaling adjusts for differences in population size and in data completeness, which is the proportion of the data that is available in a jurisdiction. This technique allows health departments to ask whether an outbreak that occurred in some other region would have been detected in their own region, provided that the outbreak region was collecting the same type of surveillance data as the region performing the detectability analysis. The technique can be applied to the majority of surveillance data, including over-the-counter (OTC) sales data and emergency department registrations. However, the two regions might differ in population size, population density, and completeness of surveillance data. High-Fidelity Injection Detectability Experiments (HiFIDE) is a software tool that uses high- fidelity injects to analyze detectability of surveillance systems. The mechanics of a HiFIDE analysis are similar to those of a semisynthetic analysis, although the software primarily automates this process. A user selects from a user interface the type of surveillance data and outbreak. The user can then easily create a substantial number of injects by using different values of outbreak size (defined as the proportion of the population that would be affected by the outbreak) and surveillance data completeness. HiFIDE combines each inject with real surveillance data to form a time series. HiFIDE then runs a set of detection algorithms on each injected time series, varying the alarm threshold, and summarizes the detectability results in AMOC curves and plots of sensitivity versus timeliness. This report illustrates how HiFIDE can be used to investigate the detectability of a water-borne Cryptosporidium outbreak in the Washington, DC, metropolitan area by assessing data from sales of OTC diarrheal remedies. HiFIDE is used to address the following questions:
MethodsHiFIDE is a software application that runs under the Microsoft Windows® operating systems. It uses R as a computational backend to enable the rapid inclusion of sophisticated detection algorithms (7). However, no knowledge of R is required, because the user interacts with only the graphical user interface of HiFIDE. Initiating an AnalysisA user initiates a HiFIDE analysis by selecting an outbreak and surveillance data type from the HiFIDE library of outbreaks and data types. The user then selects a file with sampled surveillance data from their jurisdiction. The data must be organized as a daily time series of counts. Missing data are not allowed, and outbreak-dependent minimum data requirements are checked by HiFIDE to ensure that the time series is long enough to complete the analysis. The user also has the option of providing the data completeness for the sampled surveillance data. If the user provides data completeness, then HiFIDE permits investigation of the effect of varying the data completeness of the surveillance data. For example, the user could investigate the effect that recruiting additional retailers would have on detection timeliness. Creating InjectsThe user creates injects in collections called inject repetitions. An inject repetition consists of one inject for each feasible day in the sampled surveillance time series. Two horizontal sliders on the right of the screen (Figure 3) can be manipulated by the user to adjust the outbreak size and data completeness; the data completeness slider is only active if the data completeness for the sampled surveillance data was provided when the analysis was initiated. A third slider controls the false alarm rate and does not affect the creation of injects. When the user selects "Inject," one inject repetition is added for the selected values of outbreak size and data completeness. Summarizing DetectabilityHiFIDE presents the results of the analysis graphically by using AMOC plots (Figure 3), which depict the relationship between day of detection (computed relative to a reference date) and the false alarm rate, and plots of sensitivity versus day of detection (Figure 4). The user can alternate between these plots by selecting the "Switch Plot" button in the upper right-hand corner. The three sliders control the values of outbreak size, data completeness, and false alarm rate (the false alarm rate slider is only active for the sensitivity versus day of detection plot). HiFIDE reads the values of the sliders and selects values for outbreak size and data completeness that are closest to the slider-specified values for which at least one inject repetition exists. The values used by HiFIDE for the plot are displayed above the plot. The user can select up to two algorithms to display at a time from the HiFIDE library of algorithms. The results for each of the algorithms are pre-computed when the injects are created, therefore enabling rapid switching between detection algorithms. ResultsThis report illustrates how HiFIDE can be used to investigate the detectability of a water-borne Cryptosporidium outbreak in the Washington, DC, metropolitan area by assessing data from sales of OTC diarrheal remedies. JurisdictionsThe focus of the detectability analysis was the Washington, DC, metropolitan area, which has a resident population of approximately 550,000. Daily sales of antidiarrheal products during August 9--December 20, 2003, were obtained from the National Retail Data Monitor (8). These sales represented approximately 89% of all such sales. The analysis is based on a waterborne Cryptosporidium outbreak in North Battleford, Saskatchewan. The outbreak began on March 20, 2001, when the solids contact unit at a surface water treatment plant malfunctioned (9). Public health officials issued a precautionary drinking water advisory 5 weeks later on April 25 after laboratoryconfirmed cases of cryptosporidiosis were identified. The date of the drinking water advisory is a reference date for measuring timeliness. The outbreak affected approximately 36% of the 18,000 residents. The number of weekly retail sales of diarrheal remedies was available (9) from a single pharmacy. Detection AlgorithmsMultiple simple detection algorithms were used for this analysis. The algorithms are a day-specific moving average (DSMA), autoregressive integrated moving average (ARIMA [1,0,1] ) time series model (3), exponentially weighted moving average (EWMA) with weights of 0.05 and 0.2, and CUSUM with a baseline computed via EWMA with weights of 0.05 and 0.2 (10). The ARIMA parameters and EWMA weights were set to commonly used values for simplicity rather than by any model selection criteria. Number of RepetitionsMultiple values of outbreak size and data completeness were used in the analysis. Five outbreak sizes were used with a range of 0.1%--10% in addition to three values of data completeness --- 50%, 100%, and 89% --- the data completeness for the surveillance data. Five inject repetitions were created for each pair of outbreak size (five sizes) and value of data completeness (three values). The entire computation took approximately 4.5 hours on a personal computer with a 2.4GHz Pentium 4 CPU. FindingsWhat detection algorithm would be expected to detect a Cryptosporidium outbreak in Washington, DC, the earliest? At a false alarm rate of four per year, the DSMA algorithm detects outbreaks of all sizes that are considered the earliest (Table 1). The AMOC curves can be inspected to determine how the false alarm rate affects relative algorithm performance. This report illustrates AMOC curves and a sensitivity versus timeliness plot for DSMA and ARIMA for an outbreak of size 1% (Figures 5 and 6); ARIMA detects the outbreak earlier than DSMA at smaller false alarm rates. What is the smallest Cryptosporidium outbreak that health departments can expect to be detected, given the available surveillance data in the city? The values (Table 2) for DSMA were interpolated to determine the smallest outbreak that is detected 2 weeks before public health response (using the North Battleford experience as a benchmark) at least 75% of the time. The smallest outbreak that is detectable is approximately 0.78% at a false alarm rate of four per year and 3.10% at a false alarm rate of two per year.
When using DSMA, health departments can expect to detect an outbreak that affects 10% of the population 26 days before public health response, whereas an outbreak size of 1% is expected to be detected 21 days before public health response. The timeliness of detection for other algorithms and outbreak sizes are illustrated in this report (Table 1).
This report illustrates the trade-off between the false alarm rate and timeliness for an outbreak size of 1% for the DSMA and ARIMA algorithms (Figure 5). For example, increasing the false alarm rate from two to four per year improves timeliness by 11.67 days for DSMA and 6.09 days for ARIMA.
The current completeness of data is approximately 89%, and limited improvement would be expected in timeliness if coverage was increased to 100%. The timeliness of detection of a 1% outbreak when using the DSMA algorithm at a false alarm rate of four per year only improves from -20.66 days to -20.94 days if the remaining 11% is obtained. The effect that timeliness has on losing pharmacies can also be investigated. If data completeness decreases to 50%, the timeliness increases to -19.74 days. A limitation of this example is that the North Battleford surveillance data used to estimate the shape of the injects come from only a single pharmacy. However, weekly sales data from a second pharmacy also exhibited a similar temporal effect to the outbreak (11). These results are from a system that aggregates counts for the entire jurisdiction. A full detectability analysis would exploit knowledge of the water distribution system, and substantial improvements in performance might be possible. DiscussionThe primary contribution of HiFIDE is that it enables public health departments to conduct detectability analyses for their jurisdictions. Public health departments can estimate the sizes of outbreaks that are expected to be detectable and the timeliness of their detection by using currently available surveillance data. Decisions regarding whether to allocate resources to improve data completeness by recruiting more retailers or connecting additional hospitals to the surveillance system can also be explored. HiFIDE also enables researchers in the field of biosurveillance to evaluate and compare detection algorithms. HiFIDE supports detectability analyses for Cryptosporidium and influenza when sales of diarrheal remedies and emergency department registrations with constitutional chief complaints are used, respectively. Additional outbreaks and data sources are expected to be added. ConclusionIn the HiFIDE analysis, the substantial practical information that HiFIDE can provide users of surveillance systems is illustrated. In particular, HiFIDE provides the sensitivity, specificity, and timeliness (metrics recommended by CDC [1]) for outbreaks of different sizes, etiologies, and scopes. The HiFIDE tool is available at no charge for noncommercial use (http://www.hifide.org). Acknowledgments This report was supported by the Agency for Healthcare Research and Quality (290-00-0009), the Pennsylvania Department of Health (ME-01-737), the Department of Homeland Security (F30602-01-2-0550), and the National Library of Medicine (LM008278-01). References
Table 1 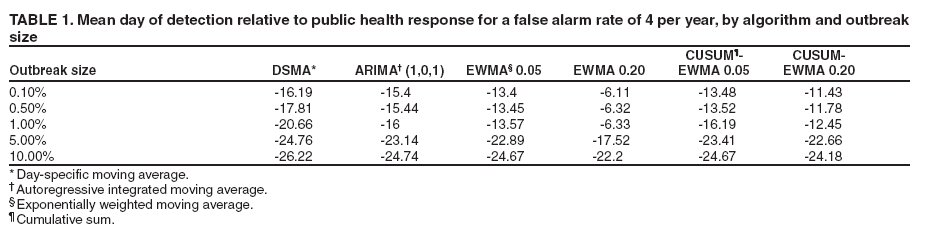 Return to top. Figure 1 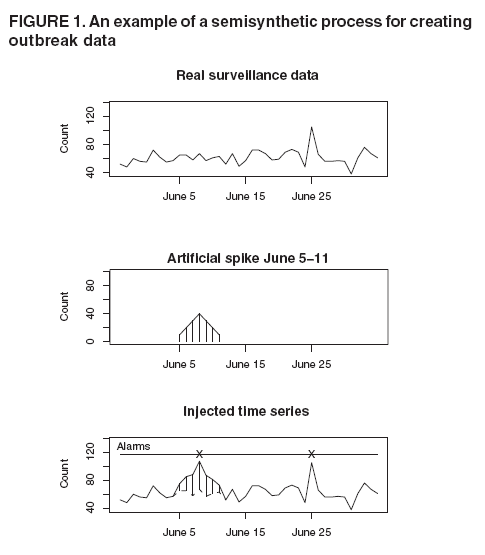 Return to top. Table 2 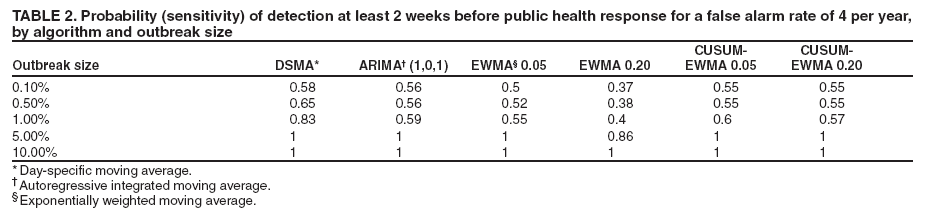 Return to top. Figure 2 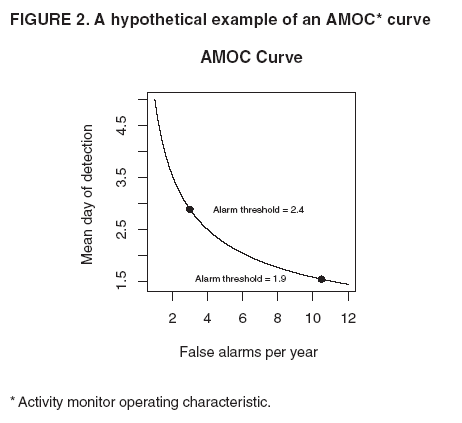 Return to top. Figure 3 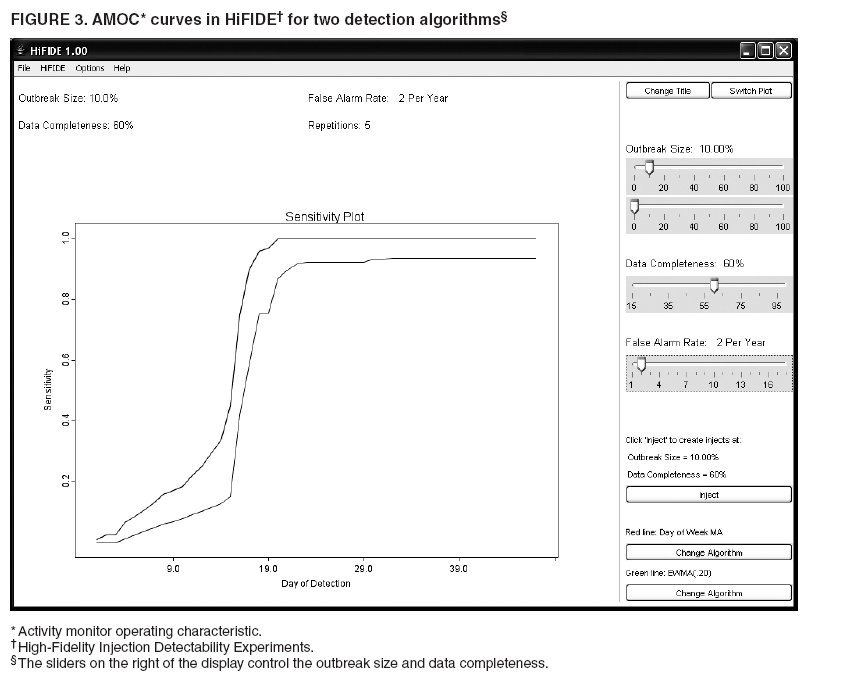 Return to top. Figure 4 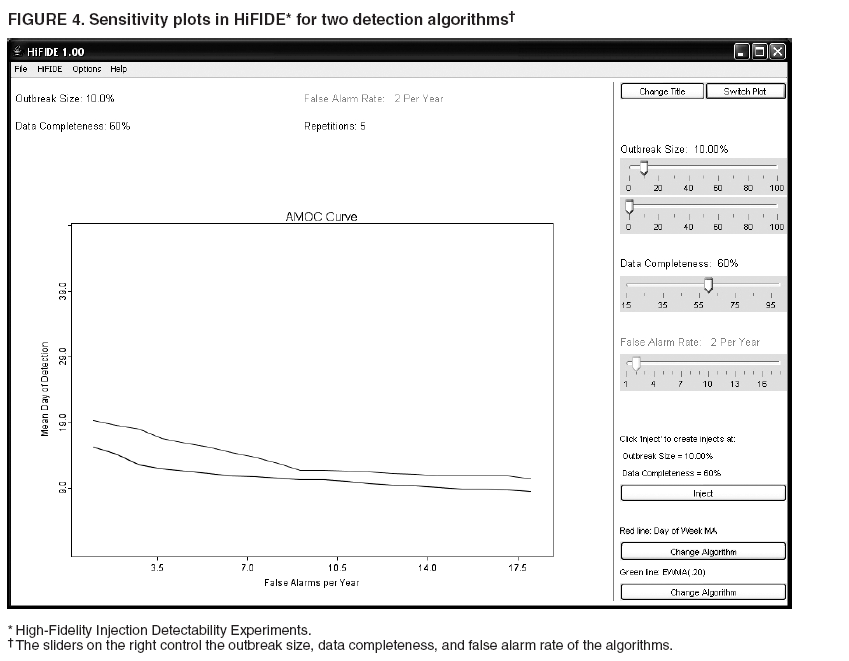 Return to top. Figure 5 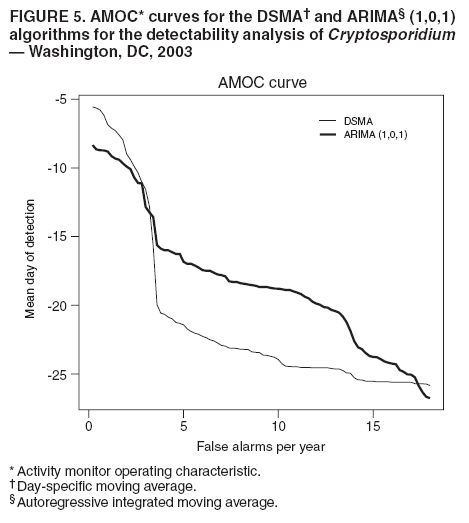 Return to top. Figure 6  Return to top.
Disclaimer All MMWR HTML versions of articles are electronic conversions from ASCII text into HTML. This conversion may have resulted in character translation or format errors in the HTML version. Users should not rely on this HTML document, but are referred to the electronic PDF version and/or the original MMWR paper copy for the official text, figures, and tables. An original paper copy of this issue can be obtained from the Superintendent of Documents, U.S. Government Printing Office (GPO), Washington, DC 20402-9371; telephone: (202) 512-1800. Contact GPO for current prices. **Questions or messages regarding errors in formatting should be addressed to mmwrq@cdc.gov.Date last reviewed: 8/5/2005 |
|||||||||
|