 |
|
|
|
|
|
|
| ||||||||||
|
|
|
|
|
|
|
||||
| ||||||||||
|
|
|
|
|
Persons using assistive technology might not be able to fully access information in this file. For assistance, please send e-mail to: mmwrq@cdc.gov. Type 508 Accommodation and the title of the report in the subject line of e-mail. Use of Multiple Data Streams to Conduct Bayesian Biologic SurveillanceWeng-Keen Wong,1 G.
Cooper,1 D. Dash,2 J. Levander,1 J.
Dowling,1 W. Hogan,1 M. Wagner1 Corresponding author: Greg Cooper, Center for Biomedical Informatics, University of Pittsburgh, 8084 Forbes Tower, 200 Lothrop Street, Pittsburgh, PA 15213. Telephone: 412-647-7113; Fax: 412-647-7190; E-mail: gfc@cbmi.pitt.edu. Disclosure of relationship: The contributors of this report have disclosed that they have no financial interest, relationship, affiliation, or other association with any organization that might represent a conflict of interest. In addition, this report does not contain any discussion of unlabeled use of commercial products or products for investigational use. AbstractIntroduction: Emergency department (ED) records and over-the-counter (OTC) sales data are two of the most commonly used sources of data for syndromic surveillance. The majority of detection algorithms monitor these data sources separately and either do not combine them or combine them in an ad hoc fashion. This report outlines a new causal model that combines the two data sources coherently to perform outbreak detection. Objectives: This report describes the extension of the Population-wide Anomaly Detection and Assessment (PANDA) Bayesian biologic surveillance algorithm to combine information from multiple data streams. It also outlines the assumptions and techniques used to make this approach scalable for real-time surveillance of a large population. Methods: A causal Bayesian network model used previously was extended to incorporate evidence from daily OTC sales data. At the level of individual persons, the actions that result in the purchase of OTC products and in admission to an ED were modeled. Results: Preliminary results indicate that this model has a tractable running time consisting of 209 seconds for initialization and approximately 4 seconds for every hour's worth of ED data, as measured on a Pentium-4 three-Gigahertz machine with two Gigabytes of RAM. Conclusion: Preliminary results for surveillance using a new Bayesian algorithm that models the interaction between ED and OTC data are positive regarding the run time of the algorithm. IntroductionSyndromic surveillance systems routinely monitor data concerning sales of over-the-counter (OTC) medications and records of chief complaints of persons reporting to hospital emergency departments (EDs) (1,2). If a disease outbreak occurs in a region, its effects are often expected to be seen in both data sources (3,4). Although ED and OTC data sources contain the signal of an outbreak, detection algorithms generally monitor each data type separately, which limits the surveillance system's detection capabilities. Persons with initial symptoms of disease are assumed often to treat themselves before seeking medical care (5--7). Consequently, an outbreak signal is expected to appear first in OTC medication sales data and then later in ED data (3). Although an early signal is expected to appear in OTC data, this signal typically will be weak. Furthermore, OTC data are often reported as a univariate time series in which regional sales volume for a particular category of product (e.g., sales of cough medications) is recorded daily, and case-level data about sales transactions are not available. If such data were to be available, a multivariate detection algorithm could be applied, and the additional information about each transaction might be exploited to improve detection capability. In contrast, ED chief complaint data do contain case-level information (e.g., admission date and time, age, sex, home ZIP code, and chief complaint) about each patient admitted. These data can be used to improve a detection algorithm's capability by identifying known spatial, temporal, demographic, and symptomatic patterns of the disease in the data. Nevertheless, an outbreak signal typically is expected to appear later in ED data than in OTC data. Developing a detection algorithm that integrates the two data sources would combine the advantages of both data types and might help monitors determine that an outbreak is occurring. The key difficulty with this data-fusion approach is in measuring the relationship between data sources when an outbreak occurs. Correlations between OTC and ED data during an outbreak cannot be estimated from data because because no training data exist that capture the effects of a large-scale epidemic on these data sources during the same period. The majority of existing data-fusion approaches treat data sources as independent (8--10). However, despite the absence of training data, a certain amount of background knowledge does exist about the plausible relationship between OTC and ED data for particular diseases that can be used to model the actions of persons that result in possible OTC medication purchases and ED admissions. This report extends the Population-wide Anomaly Detection and Assessment (PANDA) algorithm described previously (11). That algorithm used a causal Bayesian network to model a population of persons. The original PANDA algorithm was designed to monitor only ED chief complaint data. This report enhances PANDA to simultaneously monitor two data sources of different granularity: aggregated regional counts for OTC sales and multivariate ED records for individual patients. Although the Bayesian network can be used to model the effects of any noncontagious disease outbreak (i.e., those not involving person-to-person transmission) in a geographic area (11), this report focuses on monitoring to detect an outdoor, aerosolized release of an anthrax-like agent within a countywide region. MethodsThe key aspect of the PANDA algorithm is the explicit modeling of each person in the population as a subnetwork of the overall causal Bayesian network. In this report, these persons are referred to as "person models"; however, models could be generalized to entities that provide information about disease outbreaks (e.g., biosensors or livestock). The advantage of modeling each person in a population is that it allows the algorithm to have substantial representational power and flexibility. Having a subnetwork for each person enables users to represent different types of background knowledge coherently in the model. For instance, to model an aerosolized anthrax release, designers can build into the model a temporal assumption about the incubation time of anthrax and a spatial assumption that the release will take the shape of a downwind plume (12,13). In addition to the power in representing prior knowledge, modeling an entire population allows the model to combine spatial, temporal, demographic, and symptomatic evidence to derive a posterior probability of a disease outbreak. With respect to representational flexibility, individual modeling allows new types of knowledge and evidence to be readily incorporated into the model. For example, radiology reports (which are especially useful indicators of an anthrax attack) can easily be added to the model as a new evidential variable. Finally, the majority of the background knowledge of the characteristics of respiratory anthrax disease is at an individual rather than a population level. Generic ModelIn this model, the causal Bayesian network is used to detect an outbreak caused by an aerosolized release of an anthrax-like biologic agent (Figure 1). This network is an instantiation of a generic model for infectious but noncontagious diseases. The generic model can be partitioned into four sets of nodes, as follows:
The generic model makes the following three assumptions that are intended to facilitate the calculation of the probability of the target node T given the evidence:
Thus, from Assumptions 1 to 3, arcs are not allowed directly between the person models. For noncontagious diseases that might cause outbreaks, these assumptions are reasonable when I contains all the factors that influence the status of an outbreak disease in persons in the population. For example, in the case of a biologic terrorist--released agent, such information includes the time and location of release of the agent. A key characteristic of nodes in I is that they have arcs to the nodes in one or more person models, and they induce the conditional independence relationships described in Assumptions 1 and 2. In contrast, for contagious diseases (i.e., those involving person-toperson transmission), arcs are needed between person models because persons can infect each other. Once these three assumptions no longer hold, inference becomes much more computationally expensive, and the current optimizations that allow PANDA to run efficiently do not hold. Anthrax ModelIn this prototype model, the simplifying assumption is made that persons living in a particular ZIP code purchase OTC medications only within that ZIP code. Consequently, the OTC purchases in each ZIP code are independent of each other. Because this assumption will be violated in the event of a large-scale biologic terrorist attack, this issue will be addressed subsequently; however, this assumption was used for the initial prototype. One straightforward way to avoid this assumption is to model the populationwide evidence O as OTC sales for an entire region (Allegheny County, in this model); however, doing so would lose spatial information that might be helpful in detecting an outbreak. The OTC Sales for ZIP code nodes are integer-valued nodes representing the aggregate number of units of OTC medications sold throughout the specified ZIP code. These nodes are considered to be observed nodes because they are instantiated with values from the OTC data. The structure of the person model (Figure 2) was created on the basis of expert judgment. Certain nodes in this model are temporal and modeled for 3 days; that duration was selected for use in the prototype as the shortest period of time meaningful for modeling a disease outbreak. For modeling an anthrax outbreak, this period will be extended to 2 weeks. Evidence nodes whose values are observed in the ED data include home ZIP code, age decile, sex, respiratory chief complaint when admitted, and ED admission. The parameters of certain nodes in this model were estimated from a training set consisting of 1 year's worth of HIPAA compliant ED patient data from certain hospitals in western Pennsylvania during 2000 or from a training set of OTC data from 2004 (2). The parameters of other variables were obtained from U.S. Census data about the region. Respective probabilities (whether prior or conditional) for the rest were derived as a logical function of their parents or assessed subjectively on the basis of the published literature and general knowledge about infectious diseases. Because of space restrictions, this report describes only six nodes that differ from the original PANDA model (1):
InferenceThe goal of PANDA is to monitor the state of the target node T, which captures the probability of a disease outbreak occurring. PANDA calculates the posterior probability of T as new ED and OTC data arrive. Let o be the set of populationwide evidence (i.e., OTC sales volume for each ZIP code in the countywide region). Similarly, let e be the collective set of evidence from individual persons (i.e., case information from persons who recently visited EDs in the region). From ED data, demographic data from the most recent U.S. Census can be used to infer information about persons who have not been recently admitted to an ED. The sets e and o can be expressed as follows:
The goal of the algorithm is to calculate the probability of a disease outbreak given the OTC and the ED data. Mathematically, this objective is expressed as: Equation 1. P(T | o, e ) = k .P( o, e | T ) . P(T), where the proportionality constant is The term P(T) can be calculated by using Bayesian network (BN) inference on just the portion of the model that includes G. Performing BN inference over just the nodes in G is much preferable to inference over all the nodes in X, because the number of nodes in X is approximately 107 in the current model. Because the set I renders the nodes in P (including e) independent from the nodes in G, the term P(o, e | T) can be derived as follows: Equation 2.
The above summation can be very demanding computationally, because e usually contains many nodes. The term P(o, e | I = i) can be factored as follows: P(o, e | I ) = P(o | e, I ) .P(e | I ) The term P(o | e, I ) can be considered to be the conditional contribution of the OTC evidence to the posterior probability P(T | o, e), whereas the term P(e | I ) can be considered as the conditional contribution of the ED evidence. Incorporating ED EvidenceThe term P(e | I ) is calculated efficiently by using equivalence classes and incremental updating (11). Space can be saved and inference time reduced by using equivalence classes to group persons who are indistinguishable on the basis of their evidence. Persons in the same equivalence class have the same values for the home ZIP code, age decile, sex, respiratory chief complaint when admitted, and ED admission nodes. Incremental updating dramatically reduces inference time by avoiding the necessity to calculate P(e |I ) for the entire population every time new ED data arrive. Incorporating OTC EvidenceFor OTC evidence to be incorporated into the posterior probability, the probability P(o, e | I ) must be computed. If, for the purpose of this initial prototype, the simplifying assumption is made that persons living in a specific ZIP code purchase OTC medications only within their home ZIP code, then OTC purchases for each ZIP code are independent of each other, conditioned on the nodes in I. OTC purchases within a given equivalence class are also assumed to be capable of being modeled with a binomial distribution, and the distribution of OTC purchases within a given ZIP code is assumed to be capable of being modeled as the sum of independent binomial distributions of the equivalence classes within that ZIP code. Let Z be the set of all ZIP codes in the region under surveillance, and let OZk be the variable representing the OTC cough-medication sales volume for ZIP code Zk. Furthermore, let the observed OTC coughmedication sales volume during the previous 3 days for ZIP code Zk be oZk. The ZIP-code independence assumption allows the probability P(o | e, I ) to be factored as follows: Equation 3.
To model the probability P(OZk = oZk |
e, I ), which corresponds to the probability of the OTC cough-medication data
for ZIP code Zk, the contribution of the equivalence classes that belong to this ZIP code need to be determined. Let
ΩZk be the set of equivalence classes that have home ZIP codes equal to Zk. For the sake of clarity, assume only one person model exists (Figure 2) that is common to all persons in the population; in general, as many person models can exist
as is useful to represent different types of persons. An equivalence class
The OTC sales volume for each equivalence class
Distributions for each equivalence class in
ΩZk are combined by using a normal approximation to the binomial
distribution (14) to represent the OTC sales distribution for each equivalence class. The normal approximation is needed
because no efficient way exists to derive the distribution over the sum of binomial variates directly. In contrast, deriving the distribution over the sum of normal variates is straightforward. With this
approximation, a binomial distribution with parameters nj and pj can be converted into a normal distribution with mean
nj pj and variance nj pj
(1-pj ). The distribution for the entire ZIP code is therefore represented as a normal distribution
Finally, to derive the probability of observing the OTC sales for each ZIP code, the following is computed: Results and DiscussionThe average running times for the ED model described previously (1) and for the ED+OTC model described in this report were compared, with both models operating on a Pentium-4 three-Gigahertz machine with two Gigabytes of RAM. The initialization time for the ED+OTC model (209.7 seconds) is nearly four times that of the ED model (45.3 seconds). However, when actually processing the 3-day window of data, the models take approximately the same amount of time (3.0 seconds for the ED model and 3.9 seconds for the ED+OTC model). For example, suppose PANDA is run in real-time starting at t = 72 hours. The algorithm first performs an initialization phase and then processes the data from t = 0 to t = 71 hours. When data accumulate for the next hour, PANDA moves its window of cases forward by 1 hour and analyzes the data from t = 1 to t = 72 hours. For each subsequent 72-hour window, the running time of PANDA is approximately 4 seconds. Even with the OTC extension, the new PANDA model is capable of processing all current data well before the next hour's worth of data arrives. These timing results indicate that the method is practical for real-time biosurveillance. The false-positive rate and detection time of this approach will be evaluated by using data created by injecting simulated anthrax cases into existing ED and OTC data streams. Related WorkThe algorithms used in syndromic surveillance have been described previously (15). Two approaches have been suggested (10) for using a spatial scan statistic (16) to combine multiple data sources in performing syndromic surveillance. The first method treats the multiple sources as covariates. The spatial scan statistic is calculated by using the sum of the observed counts from the data sources and the sum of the expected counts. One of the main problems of this approach is that a data source with a large count might mask data sources with smaller counts. An alternative approach is to calculate the log likelihood ratio for each data source and sum these ratios to form the scan statistic, similar to an approach taken previously (11). Combining multiple univariate statistical process control methods by using a consensus method technique (9,17,18) has also been suggested. However, the consensus method assumes independence among the data sources. To capture the correlation between data streams, multivariate methods (e.g., Hotelling's T2 [19], MCUSUM [20] and MEWMA [21]) have been used on multiple univariate signals (17). In these multivariate methods, the covariance matrix for the data streams is typically estimated from a baseline period. If the covariance matrix changes substantially during an outbreak, then this estimate will not capture the actual relationship between the data streams during an outbreak. ConclusionThis report has introduced a data-fusion approach to biosurveillance that is based on modeling the effects of an outbreak disease (excluding diseases associated with person-to-person transmission) on individual persons in the population. The causal Bayesian network (1) was extended to incorporate evidence from both ED and OTC data by modeling the actions of individuals in terms of purchasing OTC products and visiting the ED. This data-fusion model can process a 3- day window of ED and OTC data in approximately 4 seconds, making it a feasible algorithm for real-time surveillance. In future work, the model will be extended to cover a 2-week period and relax the ZIP code independence assumption. A thorough and high-fidelity evaluation of the detection algorithm will be performed that will involve injecting simulated anthrax cases into actual ED and OTC data streams. Acknowledgments This research was supported by grants from the National Science Foundation (IIS-0325581), the Department of Homeland Security (F30602-01-2-0550), and the Pennsylvania Department of Health (ME-01-737). References
Figure 1 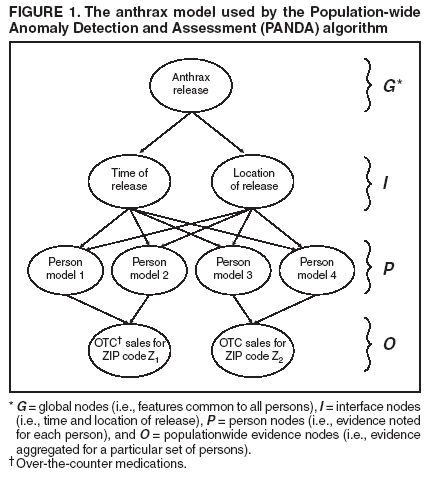 Return to top. Figure 2 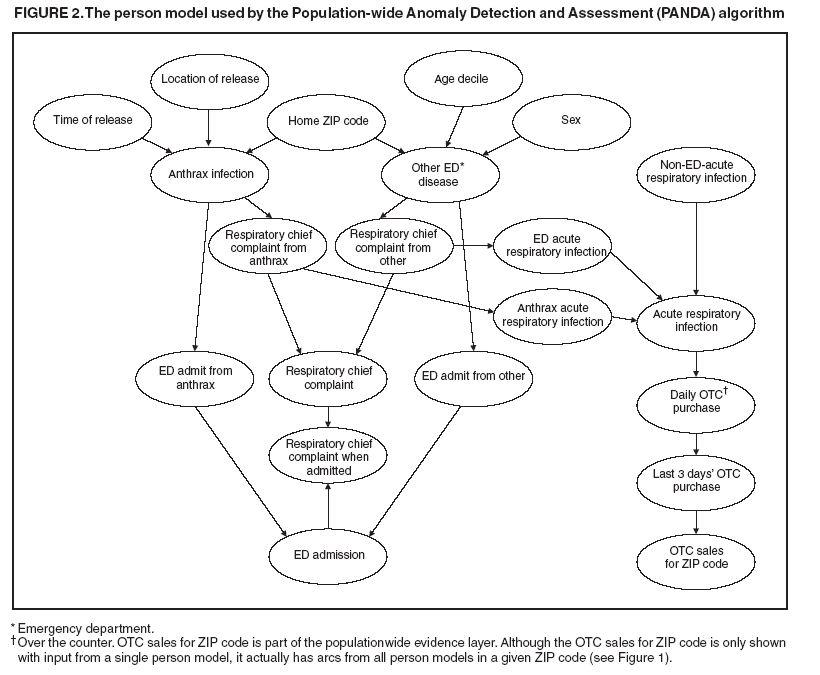 Return to top.
Disclaimer All MMWR HTML versions of articles are electronic conversions from ASCII text into HTML. This conversion may have resulted in character translation or format errors in the HTML version. Users should not rely on this HTML document, but are referred to the electronic PDF version and/or the original MMWR paper copy for the official text, figures, and tables. An original paper copy of this issue can be obtained from the Superintendent of Documents, U.S. Government Printing Office (GPO), Washington, DC 20402-9371; telephone: (202) 512-1800. Contact GPO for current prices. **Questions or messages regarding errors in formatting should be addressed to mmwrq@cdc.gov.Date last reviewed: 8/5/2005 |
|||||||||
|