|
|
|
|
|
|
|
| ||||||||||
|
|
|
|
|
|
|
||||
| ||||||||||
|
|
|
|
|
Persons using assistive technology might not be able to fully access information in this file. For assistance, please send e-mail to: mmwrq@cdc.gov. Type 508 Accommodation and the title of the report in the subject line of e-mail. Bio-ALIRT Biosurveillance Detection Algorithm EvaluationDavid Siegrist,1 J.
Pavlin2*
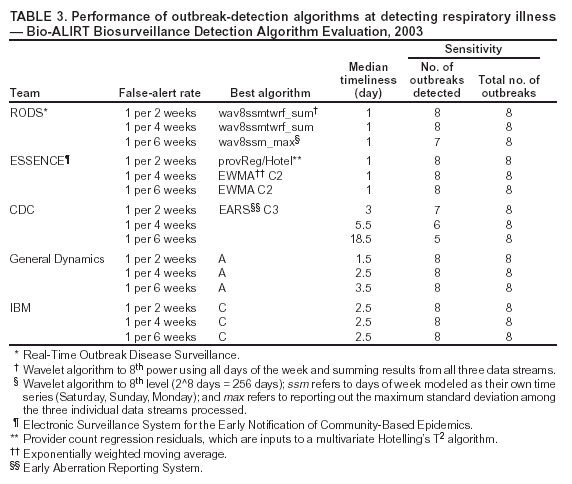
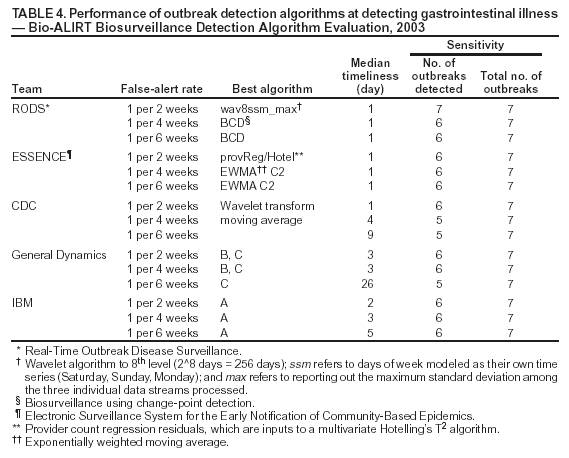
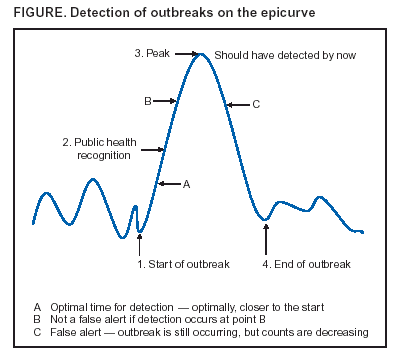
Corresponding author: David Siegrist, Potomac Institute for Policy Studies, 901 N. Stuart Street, Suite 200, Arlington, Virginia 22203. Telephone: 703-525-0770; Fax: 703-562-1000; E-mail: dsiegrist@potomacinstitute.org. AbstractIntroduction: Early detection of disease outbreaks by a medical biosurveillance system relies on two major components: 1) the contribution of early and reliable data sources and 2) the sensitivity, specificity, and timeliness of biosurveillance detection algorithms. This paper describes an effort to assess leading detection algorithms by arranging a common challenge problem and providing a common data set. Objectives: The objectives of this study were to determine whether automated detection algorithms can reliably and quickly identify the onset of natural disease outbreaks that are surrogates for possible terrorist pathogen releases, and do so at acceptable false-alert rates (e.g., once every 2--6 weeks). Methods: Historic de-identified data were obtained from five metropolitan areas over 23 months; these data included International Classification of Diseases, Ninth Revision (ICD-9) codes related to respiratory and gastrointestinal illness syndromes. An outbreak detection group identified and labeled two natural disease outbreaks in these data and provided them to analysts for training of detection algorithms. All outbreaks in the remaining test data were identified but not revealed to the detection groups until after their analyses. The algorithms established a probability of outbreak for each day's counts. The probability of outbreak was assessed as an "actual" alert for different false-alert rates. Results: The best algorithms were able to detect all of the outbreaks at false-alert rates of one every 2--6 weeks. They were often able to detect for the same day human investigators had identified as the true start of the outbreak. Conclusions: Because minimal data exists for an actual biologic attack, determining how quickly an algorithm might detect such an attack is difficult. However, application of these algorithms in combination with other data-analysis methods to historic outbreak data indicates that biosurveillance techniques for analyzing syndrome counts can rapidly detect seasonal respiratory and gastrointestinal illness outbreaks. Further research is needed to assess the value of electronic data sources for predictive detection. In addition, simulations need to be developed and implemented to better characterize the size and type of biologic attack that can be detected by current methods by challenging them under different projected operational conditions. IntroductionThe Bio-Event Advanced Leading Indicator Recognition Technology (Bio-ALIRT) biosurveillance program was implemented during 2001--2004. The program's objective was to develop data sources, technologies, and prototypes for monitoring nontraditional data sources (e.g., animal sentinels, human behavioral indicators, and nondiagnostic medical data) that might enable public health authorities to detect terrorist release of a pathogen or toxin at the earliest possible moment. Technical challenges to the development of Bio-ALIRT have included 1) determining the value of each data source, alone and in combination with others, for earlier outbreak detection; 2) correlating and integrating information derived from heterogeneous data sources; 3) developing autonomous signal-detection algorithms with high sensitivity and low false alerts; and 4) maintaining privacy protection while correlating de-identified data sources. Early detection of disease can be divided into two components: contributions made by the data, and contributions made by anomaly-detection algorithms. Bio-ALIRT investigators evaluated multiple data sources in comparison with standard data that indicated when an outbreak of influenza-like illness (ILI) or gastrointestinal illness (GI) actually occurred (as documented by de-identified insurance claims). The lead-time over those reference data and the confidence interval can then be calculated. (Additional information about the Bio-ALIRT data research is available from the corresponding author.) This paper focuses on the evaluation of the detection algorithms as a component of a biosurveillance system. A common challenge problem and common data set are required to evaluate detection algorithms; for the first Bio-ALIRT algorithm evaluation in August--September 2002, this was accomplished by using the BioWar simulation, which uses a software agent-based approach to simulate both a normal background and an outbreak signal (1). In 2003, to determine whether the algorithms could detect real disease outbreaks, the investigators used wholly authentic, de-identified, historic military and civilian data from five cities. An advantage of the evaluation approach used in 2003 is that it relied exclusively on real data and not on simulation, which might inadvertently introduce bias into the assessment. Also, by working with real data from cities of interest, the evaluators were able to hone their skills in a realistic environment that might also produce insights to further program goals. Limitations of the historic outbreak evaluation approach include uncertainty about the exact start dates and sizes of outbreaks and the inability to examine algorithm outbreak-detection capabilities under a substantial number and variety of conditions. Furthermore, pathogens likely to be used in a terrorist attack are presumed to have a different epidemiologic curve than an ILI outbreak. However, detecting slowly increasing seasonal respiratory outbreaks and more rapidly rising GI outbreaks across a metropolitan region were considered to be reasonable surrogates for detecting deliberate pathogen releases. Bio-ALIRT was sponsored by the Defense Advanced Research Projects Agency (DARPA), a central U.S. Department of Defense (DoD) research and development agency, primarily to protect troops from biologic agents. Contract investigators included the Johns Hopkins University Applied Physics Laboratory in cooperation with the Walter Reed Army Institute of Research; the University of Pittsburgh/Carnegie Mellon University team; the General Dynamics Advanced Information Systems (formerly Veridian) team with the Stanford University Medical Informatics group; and IBM Corporation. The Potomac Institute performed an independent evaluation function. Both CDC and a municipal department of health also participated in the detection evaluation. MethodsData SourcesAuthentic military and civilian data from five cities were analyzed. ILI and GI were used as surrogates for a biologic attack because these syndromes might mimic early symptoms of certain Class A pathogens on CDC's biologic terrorism threat list.† Naturally occurring historic outbreaks of ILI and GI were identified by using measurable phenomena (e.g., visits for symptomatic care to a health-care provider) that generated records (e.g., insurance claims from physicians' offices or hospital outpatient care) from which identifying information was removed. Three data sources were obtained for the evaluation: military outpatient-visit records with International Classification of Diseases, Ninth Revision (ICD-9) codes, civilian ICD-9-coded outpatient visit records, and military outpatient prescription records. All data were stripped of identifying information to protect patient privacy. After geographic regions with overlap between available military and civilian populations were determined, five areas were selected for investigation: Norfolk, Virginia; Pensacola, Florida; Charleston, South Carolina; Seattle, Washington; and Louisville, Kentucky. DoD military treatment facility (MTF) coverage was approximately 100% for those five areas, whereas civilian coverage for the regions ranged from 15.9% to 32.7%, with a mean of 25.1%. All three data streams generated signals for the same disease outbreaks for approximately the same dates (Table 1), which increased the investigators' confidence in the overall quality of the data set. The military data included ICD-9 codes from all MTF outpatient visits by active duty personnel, retirees, and dependent family members. These data included date of visit, <4 ICD-9 codes per visit, age, residential zip code, and MTF designator. Military pharmacy data captured all prescriptions paid for by the military health-care system and filled at either MTFs or civilian pharmacies. The evaluation data set included the pharmacy identification (ID) number; the date the prescription was written and filled; the drug name, generic drug classification, and therapeutic class identifier; whether the prescription was new or a refill; the number of refills; and the patient's age. Surveillance Data, Inc. (SDI) provided de-identified ICD-9 outpatient data from similar geographic regions, including the date of visit, <5 of the selected ICD-9 codes, and the patient's age and residential zip code. Military outpatient ICD-9 information was captured electronically shortly after the outpatient visit. ICD-9 codes are added to the electronic record either by the provider or by a professional coder and sent with demographic and clinic information to a central repository. Pharmacy data were collected electronically at the time the prescription was filled. Over-the-counter drug prescriptions (e.g., decongestants and antidiarrheals) at MTFs were also included in the data. All identifying information was removed from military outpatient and pharmacy data before their provision to the Walter Reed Army Institute of Research (WRAIR) and the teams. SDI data were generated from electronically transmitted insurance claims for physician office services from a substantial sample of physicians across the United States. As claims were sent from the physicians to the insurers, identifying information was removed pursuant to the Health Insurance Portability and Accountability Act of 1996 (HIPAA), and data were transmitted to SDI and loaded into a data warehouse. WRAIR uses military outpatient ICD-9 codes for an active disease surveillance system known as the Electronic Surveillance System for the Early Notification of Community-Based Epidemics (ESSENCE). On the basis of previous experience and in conjunction with CDC, groups of ICD-9 codes and medications that best reflect respiratory and gastrointestinal illness were used for the evaluation. (A list of these ICD-9 codes is available from the corresponding author.) Only these drug categories and ICD-9 codes were provided to participants. However, participants were allowed to manipulate the syndrome categories and to delete or subgroup codes to improve their analysis. Data for July 2001--August 2002 were provided for training of the algorithms. The test data stream ran during September 2002--May 2003. Outbreak DeterminationAn outbreak detection group (ODG) was formed to determine when natural outbreaks of gastrointestinal and respiratory illness took place in the selected areas and times. This group included medical specialists and epidemiologists from throughout the program; after joining the group, they were sequestered from participating in the detection portion of the evaluation. Using visual and statistical techniques, ODG found evidence of disease outbreaks in the data and also determined that the three data streams correlated effectively (Table 1). For convenience, a simple anomaly-detector algorithm was run over the data to assist in identification of outbreaks. Four dates were then determined for each of the agreed outbreaks: 1) start date, 2) date ODG expected that public health officials would declare prospectively that an outbreak was occurring, 3) peak date, and 4) end of outbreak (Figure). ODG included both broad, seasonal outbreaks and more concise disease-count elevations that occurred both inside and outside of seasonal fluctuations. Because the data were retrospective, outbreaks could not be confirmed in the majority of cases. However, because the algorithms being evaluated are intended to alert public health authorities to the likelihood of an outbreak, the presumptive standard was considered reasonable for the evaluation of the detection algorithms. The data were divided into 14 months of training data and 9 months of test data. Two outbreaks were identified in the training data, and the dates of these outbreaks were provided to the teams. The dates of all outbreaks identified in the test data were withheld from the teams until after they submitted their detection results. Assessing Algorithm PerformanceThe sensitivity and timeliness of each outbreak-detection algorithm were assessed at false-positive rates of practical relevance for public health surveillance. Teams submitted detection results for <3 algorithms. The detection results for each algorithm consisted of two files, one for respiratory outbreaks and one for GI outbreaks. Each row in a file contained a date followed by five numbers, one for each city. The numbers were the algorithm output indicating the likelihood of an outbreak in a given city on a given day. For the majority of algorithms, the numbers were p-values, but the assessment method did not require this. The three false-positive rates selected were one per 2 weeks, one per 4 weeks, and one per 6 weeks. Sensitivity and timeliness for respiratory and GI outbreak detection were calculated separately at each false-positive rate. This resulted in six estimates of sensitivity and timeliness for each algorithm. A false-positive rate for an algorithm corresponds to a threshold applied to the algorithm's numerical output. This threshold was determined separately for each type of outbreak (i.e., respiratory and GI) and for each city by examining the number of false alerts during nonoutbreak periods at each threshold. The numerator for sensitivity was defined as the number of outbreaks with >1 algorithm output over the threshold between the start date of the outbreak and the date public health authorities were expected to recognize the outbreak; the denominator for sensitivity was the number of outbreaks. The dates for respiratory and GI outbreaks in the five metropolitan areas are presented (Table 2). Timeliness of outbreak detection was measured by using a variation of the activity monitor operating characteristic (AMOC) method (2). In practice, this entailed calculating the median time to outbreak detection for an algorithm at each false-positive rate. Median time to detection was used because mean time is problematic; outbreaks have different lengths, and no obvious way exists to penalize evaluation participants for an undetected outbreak. For example, if missed outbreaks are ignored, then a method that alerts late can have a larger mean than a method that does not alert at all. For a single outbreak, time to detection was defined as the number of days between the outbreak start date and the date the algorithm output first crossed the threshold. If the algorithm did not identify the outbreak before the date public health authorities were expected to recognize the outbreak, then an infinite time to detection for that outbreak was assigned to the algorithm. Assignment of an infinite time for a single outbreak does not unduly influence the calculation of the median the way it would influence calculation of the mean. Charts for sensitivity and timeliness were calculated for each algorithm and used to compare performance of the various alerting algorithms on the 15 outbreaks identified by the ODG. The limited number of outbreaks precluded testing for statistically important differences in detection performance between algorithms. Conducting the TestEvaluation data were collected and distributed by WRAIR. Approximately 14 months of training data with two labeled outbreaks were released to the teams, including DoD ambulatory ICD-9 codes, DoD pharmacy data, and civilian medical-claims data for five cities. Unlabeled test data were released 6 weeks later. The teams were on the honor code to analyze the data prospectively (e.g., daily) as they were presented rather than identify peaks and then trace them back to their origins to determine the start of the outbreak. The processes used by the teams were asserted to be repeatable and thus verifiable. Two weeks after distribution of the test data, the algorithm-detection output was collected from participating teams, and software to score detection results was distributed to them. The software automatically computed sensitivity and timeliness. Desirable characteristics for the evaluation were high values for sensitivity (i.e., detecting that an outbreak occurred) and low values for timeliness (i.e., a slight delay in detecting the outbreak at the different false-alert rates). ResultsThe best algorithms were able to detect all of the outbreaks, often for the same day the ODG had determined retrospectively that the outbreaks had begun, at a false-alert rate of one every 2 weeks (Tables 3 and 4). This study measured the number of days after the initial outbreak that the algorithms would detect the outbreak; therefore, detecting on day 1 is optimal. Compared with the human investigators, the algorithms detected the outbreaks "virtually prospectively." That is, the algorithms determined a probability of outbreak for a particular day as the date they were encountered, instead of when human investigators were projected to have detected the outbreak, leading to an average detection advantage of >18 days (Table 2). The detection advantage was more marked for seasonal respiratory outbreaks; the GI outbreaks peaked more rapidly and decisively. The leading detection algorithms included statistical process control methods applied to regression residuals, Bayesian change-point techniques, and wavelet methods. One of the analytic teams, instead of measuring raw syndrome counts, instead obtained good results by detecting variation in the total number of medical providers reporting and measuring the regression by using Hotelling's T2 (3). A fuller description of the evaluation results and techniques will be forthcoming. ConclusionThis paper has described a methodology and results for quantitatively evaluating the performance of outbreak detection algorithms used in biosurveillance. This methodology permits assessment of the performance of algorithms implemented by different research teams in detecting real outbreaks identified by expert opinion. Both timeliness and sensitivity were assessed at false-positive rates of practical relevance for public-health surveillance. An advantage of the approach used is that it relied solely on actual data; no simulation was conducted that might inadvertently introduce bias into the assessment. Using real data from cities of interest enabled teams to hone their skills in a realistic environment that might also produce important insights that would further program goals. However, this approach has certain limitations, including uncertainty about the exact start date and size of outbreaks and inability to examine algorithm outbreak-detection capabilities under a substantial number of diverse conditions. In addition, the numbers of real outbreaks in the data set used in this evaluation were not sufficient to support statistical significance testing, which limited the precision of the results. Further, pathogens that would be used in a terrorist attack are presumed to have a somewhat different epidemiologic curve than a natural ILI outbreak, for instance. However, detecting slowly rising seasonal respiratory outbreaks, as well as more rapidly rising GI outbreaks, over a metropolitan region were considered to be reasonable surrogates for detecting deliberate pathogen releases. The results of this analysis indicate that authentic historic data with real outbreaks can support evaluation across research teams by providing a common challenge problem and common data set. ODG members agreed on the number and dates of the outbreaks in all three parallel data streams for each of the five cities. The reliability of this agreement was not assessed quantitatively, but the general agreement indicates that the data were adequate to support the comparison. Epidemiologic investigators determined the dates of outbreaks on the basis of professional judgment. However, no further investigation was conducted to determine whether local public health authorities in these five metropolitan areas believed that actual outbreaks took place at those times. Rather, the outbreak was determined on the basis of the fact that an unusual number of case counts were reported. This evaluation provides a "snapshot" of the performance of certain algorithms and data-processing methods, in the hands of five teams, at detection of outbreaks identified by a panel of experts. Whether certain algorithms were better overall than others was not determined. The evaluation indicates that objective ways exist to compare critical aspects of biosurveillance systems by using authentic data from real outbreaks. Acknowledgments The following persons provided exceptional help in the conduct of the evaluations: Virginia Foster, WRAIR; David Buckeridge, Stanford University; Andrew Kress, Surveillance Data, Incorporated; Ted Senator, DARPA; Judith Brillman, University of New Mexico; Howard Burkom, Johns Hopkins University Applied Physics Laboratory; Murray Campbell, IBM; Karen Cheng, General Dynamics; Kathleen Carley, Carnegie Mellon University (CMU); Yevgeniy Elbert, WRAIR; Jay Mansfield, WRAIR; Andrew Moore, CMU; Doug Stetson, General Dynamics; Michael Wagner, University of Pittsburgh. The following persons provided helpful comments regarding earlier drafts: Howard Burkom; David Buckeridge; Virginia Foster; Bill Hogan, University of Pittsburgh; Henry Rolka, CDC. References
* The opinions expressed in this paper are those of the authors and do not necessarily reflect the position of the U.S. Department of Defense. † Approximately 250 International Classification of Diseases, Ninth Revision (ICD-9) codes are closely associated with ILI and GI illness. Table 1 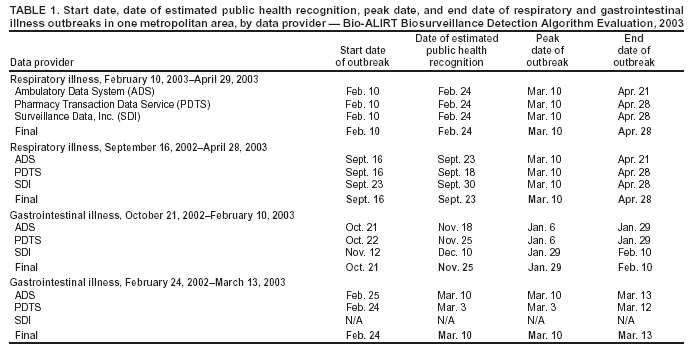 Return to top. Table 2 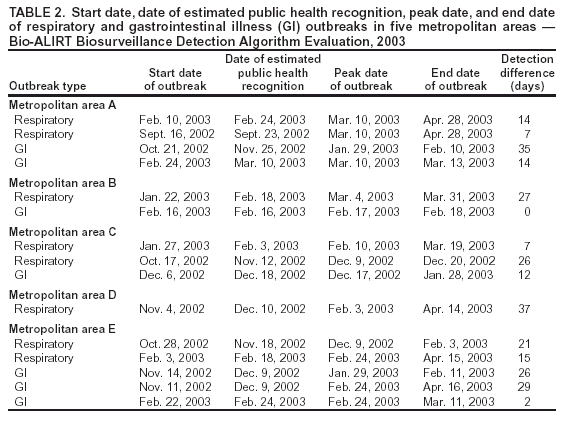 Return to top. Table 4
Disclaimer All MMWR HTML versions of articles are electronic conversions from ASCII text into HTML. This conversion may have resulted in character translation or format errors in the HTML version. Users should not rely on this HTML document, but are referred to the electronic PDF version and/or the original MMWR paper copy for the official text, figures, and tables. An original paper copy of this issue can be obtained from the Superintendent of Documents, U.S. Government Printing Office (GPO), Washington, DC 20402-9371; telephone: (202) 512-1800. Contact GPO for current prices. **Questions or messages regarding errors in formatting should be addressed to mmwrq@cdc.gov.Page converted: 9/14/2004 |
|||||||||
This page last reviewed 9/14/2004
|