 |
|
|
|
|
|
|
| ||||||||||
|
|
|
|
|
|
|
||||
| ||||||||||
|
|
|
|
|
Persons using assistive technology might not be able to fully access information in this file. For assistance, please send e-mail to: mmwrq@cdc.gov. Type 508 Accommodation and the title of the report in the subject line of e-mail. Evaluation of Syndromic Surveillance Systems --- Design of an Epidemic Simulation ModelDavid L. Buckeridge,1,2 H.
Burkom,3 A. Moore,4 J. Pavlin,5* P. Cutchis,3 W. Hogan6
Corresponding author: David L. Buckeridge, Stanford Medical Informatics, MSOB X-215, 251 Campus Dr., Stanford, CA 94305-5479. AbstractIntroduction: The paucity of outbreak data from biologic terrorism and emerging infectious diseases limits the evaluation of syndromic surveillance systems. Evaluation using naturally occurring outbreaks of proxy disease (e.g., influenza) is one alternative but does not allow for rigorous evaluation. Another approach is to inject simulated outbreaks into real background data, but existing simulation models generally do not account for such factors as spatial mobility and do not explicitly incorporate knowledge of the disease agent. Objective: The objective of this analysis was to design a simulated anthrax epidemic injection model that accounts for the complexity of the background data and enables sensitivity analyses based on uncertain disease-agent characteristics. Model Requirements and Assumptions: Model requirements are described and used to limit the scope of model development. Major assumptions used to limit model complexity are also described. Available literature on inhalational anthrax is reviewed to ensure that the level of model detail reflects available disease knowledge. Model Design: The model is divided into four components: 1) agent dispersion, 2) infection, 3) disease and behavior, and 4) data source. The agent-dispersion component uses a Gaussian plume model to compute spore counts on a fine grid. The infection component uses a cohort approach to identify infected persons by residential zip code, accounting for demographic covariates and spatial mobility. The disease and behavior component uses a discrete-event approach to simulate progression through disease stages and health-services utilization. The data-source component generates records to insert into background data sources. Conclusions: An epidemic simulation model was designed to enable evaluation of syndromic surveillance systems. The model addresses limitations of existing simulation approaches by accounting for such factors as spatial mobility and by explicitly modeling disease knowledge. Subsequent work entails software implementation and model validation. IntroductionSyndromic surveillance systems potentially allow rapid detection of outbreaks and enable prompt public health intervention (1). Although considerable effort and funding have been directed in recent years toward the development of systems and outbreak-detection algorithms, minimal evaluation of their performance in real surveillance environments has been conducted (2,3). The conditions under which a syndromic surveillance system is likely to rapidly detect an outbreak need to be better understood. Public health decision-makers faced with funding decisions for terrorism preparedness should understand which types of disease agents and attack scenarios are likely to be detected by syndromic surveillance and which are not. Although speculations on this topic have been published (4,5), limited empirical research has been conducted. From a systems-development perspective, such evidence is required to ensure that developers understand which system configurations (especially which detection algorithms) are best suited to detecting specific attack scenarios and disease agents. The efficacy of algorithms in tightly controlled settings has been evaluated to an extent (6,7), but evaluation of outbreak-detection effectiveness in realistic settings has been minimal. The ideal evaluation approach would assess system performance by using existing outbreaks of the type the system is intended to detect. However, for the majority of locations where systems are operating, essentially no previous data exist on outbreaks from agents of biologic terrorism. An alternative suggestion is to use data on seasonal outbreaks as a proxy signal for evaluation (8). This approach is useful but limited. Seasonal outbreaks are limited in number and might differ in important ways from the type of outbreaks systems are intended to detect. Moreover, performing sensitivity analyses using real outbreak data is not usually possible. Another alternative is to use simulated data for evaluation. Given the complexities of real data, evaluation should be based on real data injected with simulated outbreaks as opposed to relying on fully simulated data (8). To date, simulations have focused on injecting relatively simple signals with abstract characteristics into univariate time series (6,9) or on creating simple, abstract spatial signals (7). These simulation efforts are useful for understanding the general performance characteristics of detection algorithms, but they do not enable thorough evaluation of surveillance-system and detection-algorithm performance in realistic settings. A limitation of existing simulation approaches is that they create signals with insufficient complexity to evaluate the effectiveness of certain algorithms in the scenarios and data environments for which they were designed. For example, algorithms used by syndromic surveillance systems often rely on spatial information (10) and on the joint distribution of multiple attributes (7). To evaluate the performance of a system that uses such algorithms, a simulation must be capable of producing a signal that accounts for such factors as the spatial mobility of persons among regions and the joint distributions of such variables as age and diagnosis. Another limitation of current simulation approaches (6,7,9) is that the disease agent responsible for the simulated signal is not explicitly modeled. Such explicit modeling is necessary to understand the plausible range of detection-performance results for a specified outbreak scenario. Different assumptions about disease-agent parameters (e.g., time spent in the incubation state) are required for a simulation model developed for system evaluation. This paper describes the design for a simulation model intended to enable evaluation of the outbreak-detection characteristics of a syndromic surveillance system. The goal is to develop a model that 1) creates a realistic signal for injection into background data sources, 2) explicitly incorporates knowledge of disease, and 3) is as simple as possible. The aim is to design a model that can be generalized to multiple disease agents, geographic locations, and data sources. However, to focus model development, developers limited the model design to simulate exposure to aerosolized Bacillus anthracis spores in the Norfolk, Virginia, area and the resulting effect on outpatient clinical visits and pharmaceutical prescriptions. Model Requirements and AssumptionsModel RequirementsDeveloping a simulation model requires simplifying reality in a way that sufficiently decreases complexity but still meets model requirements (11). The purpose of this model is to enable evaluation of the outbreak-detection characteristics of syndromic surveillance systems. Functionally, the model must simulate the effects of an epidemic in sufficient detail such that attributable cases can be plausibly injected into the background of authentic health-utilization records. The simulated records must account for such factors as the spatial mobility of the population and joint distributions of multiple attributes within and across data sources. From a design perspective, the model must explicitly incorporate knowledge of the disease agent in a way that enables analyses of the sensitivity of detection performance to key disease parameters. Model Scope and AssumptionsFocusing on evaluation of timely outbreak detection provides a means of limiting the model's scope. This model assumes that outbreak detection by a surveillance system is successful only if it occurs 1) before the outbreak is evident because a sufficiently large number of persons seek care and 2) before a limited number of persons are diagnosed with a disease caused by a nonendemic Category A biologic agent (12). This assumption allows the scope of the model to be limited to the early stages of disease progression, up to hospital admission. However, it also requires that the model accurately reflect population and provider behavior before and after illness onset. Another assumption is that before an epidemic is recognized, the behaviors of both health-care seekers and providers are reflected by historic data. This means that persons use health-care services, and health-care providers assign diagnoses and prescribe medications, according to historic patterns for persons with similar demographic characteristics and similar symptoms. Historic patterns for health-care consumers and providers can be determined empirically from background data, and this assumption substantially limits the need for quantitative data on health-care utilization in the early stages of an epidemic. Parameters for Simulation of Inhalational AnthraxTo develop a model for inhalational anthrax, the investigators reviewed the literature on anthrax to ensure that the disease was modeled at a resolution appropriate to available knowledge. A limited number of studies have quantitatively modeled dispersion of anthrax spores, infection with inhalational anthrax, and disease progression among infected persons. A study of the Sverdlosk anthrax outbreak indicated that dispersion of an aerosol of B. anthracis is adequately described by a Gaussian plume model (13). Although it was based on incomplete data, that validation of the Gaussian plume model is the most complete analysis described in the literature. The Gaussian plume model seems to provide a reasonable first approximation in an urban setting, and others have used the model in an urban environment with essentially no modifications (14). The estimates of an infectious dose of B. anthracis spores (ID10 = 1,135, ID50 = 8,940) proposed previously (15) are the geometric means of estimates from subject matter specialists, obtained before the U.S. anthrax cases in 2001. The age-specific estimates proposed (ID10 = 450--4,500, ID50 = 1,500--15,000) (16) were apparently based on the previous estimate (15) but were modified to account for knowledge derived from analysis of the 2001 exposures to mailborne B. anthracis. The revised age-specific values are consistent with the observation that the infectious doses in the 2001 cases were lower than previously thought necessary, and with observation from the Sverdlosk cases that children seem to require higher infectious doses (13). The probability of infection can be estimated from the number of spores inhaled (S) and the age category (n), by using functions described previously (14,16). In terms of disease progression, one researcher (14) modeled five disease states for inhalational anthrax: uninfected, incubating, prodromal, fulminant, and dead. In addition, values determined from the Sverdlosk outbreak (17) were used to parameterize the lognormal distribution of duration in the incubation state (14). Parameters for the lognormal distributions of time in the prodromal and fulminant states from the 2001 cases in the United States (18,19) and an analysis of the time from exposure to death (17) were also estimated (14). These estimates in days are incubation (median = 10.95; dispersion = 2.04), prodromal (median = 12.18; dispersion = 1.41), and fulminant (median = 1.5; dispersion = 1.41), where the log of time in a state is normally distributed with mean m and variance s2: log(t) ~ N(m, s2). Following other published work (20), the dispersion factor d = exp(s). Approximately 68% of the cases in a state fall in the interval median/d to median * d, and roughly 95% of the cases fall in the interval median/d2 to median * d2. Human (21) and animal (22) evidence demonstrates that duration in the incubation state depends on the number of inhaled spores, although research indicates that the Sverdlosk data do not support this (14). In addition, animal evidence indicates that time from exposure to death is dose-dependent (22), although whether this is attributable only to a shortened incubation period and not also to a shortened duration of subsequent states is not clear. Background Data and Simulation RegionAlthough the model is intended to be generalizable to other settings, our initial design focuses on two specific data sources drawn from the Norfolk, Virginia, region: ambulatory physician visit billing records and pharmaceutical prescription records for military personnel and their dependents. These types of data are used routinely by syndromic surveillance systems (23--26). Persons are uniquely identified with encrypted personal identifiers in a way that allows anonymous linkage of records for persons across the two data sources. The simulation region is defined as an area approximately 160 km by 200 km that encompasses 158 zip codes from two states. During July 2001--May 2003, a total of 115,732 persons from the simulation region made 231,116 clinical visits and 148,761 pharmacy visits. Within the region, clinical visits were made to 16 clinical facilities, and prescriptions were filled at 316 pharmacies. The fields in the background data sources are provided (Table 1). Model DesignTo facilitate overall model development and description, the model was divided into four components: a dispersion model, an infection model, a disease and behavior model, and a data-source model (Figure 1). The dispersion model makes a calculation of the distribution of aerosolized spores over the study area. The infection model then takes the spatial distribution of spores, along with information on the covered population and inter-region travel information, to estimate the number of infected persons by home location. The disease and behavior model then determines progression of infected persons through disease stages and identifies the health-care--seeking behaviors of these persons over time. Finally, the data-source model converts the generic behaviors taken by persons into specific database records that can be combined with real background data. The rest of this section describes each model component, focusing on the general structure, main assumptions, and parameters to be varied. Mathematical and technical details are available from the corresponding author and are not presented here. Dispersion ModelThe dispersion model calculates the number of spores inhaled at point locations in the simulation region. A Gaussian plume model was used to simulate dispersion of spores over the region. Home locations of covered persons in the background data are available by zip code. Because considerable variation exists in the shape and size of zip codes within the region, the simplest approach of estimating spore exposure at a single point within each zip code was rejected. Instead, a regular grid over the simulation region, with at least one grid cell falling within each zip code, was defined. A cell size of 100 m is sufficient for this purpose in the Norfolk, Virginia, region. Therefore, each run of the dispersion model will take as input the release parameters (location, amount, and atmospheric conditions) and the grid description, and produce as output the number of spores inhaled at the center of each cell on the grid. The main parameters to vary within this model component are the amount of release, the location of the release, and the atmospheric conditions (wind direction and speed and atmospheric turbulence). Infection ModelThe infection model determines the number of infected persons from the covered population in each age/residential zip code/sex/spore-dose stratum. The covered population is defined as the set of unique persons represented in the background data sources. The average of the spore counts for the grid cells that fall within the zip code is used to determine the spore concentrations within each zip code. Correspondence of grid cells to zip codes is determined by overlaying the grid on the zip- code boundaries by using a geographic information system (GIS) and then using spatial topology to assign each grid cell the zip code that contains the centroid of the grid cell. The geographic distribution of the covered population at the time of exposure is modeled as the probability of a person being in a zip code at a certain time given his or her residential zip code and age category. Time is divided into three categories (work/school, recreation, and home) on the basis of time of day and day of week, and three age groups are identified (young [0--18 years], middle-aged [19--64 years], and elderly [>64 years]. For the work time category and the middle-aged age group, probabilities are determined from U.S. Census workflow data (27) (Figure 2). For all other combinations of time categories and age groups, probabilities are determined by using inverse exponential driving distance between zip codes, with a distinct exponential weight for each time category. The weights are to be varied in sensitivity analyses and are chosen so that persons tend to be more widely dispersed during recreation times than during work or school times, and in turn more widely dispersed during work or school times than during home times. The spore-concentration data, the geographic distribution of the covered population, and the probability of infection given dose and age (as described in Methods) are used to determine the probability of infection for each age/residential zip code/sex/spore dose stratum given the attack time. This probability is then used along with the number of persons in the covered population to sample the number infected in each stratum from a binomial distribution. Each run of the infection model will therefore take as input the time of the attack, the number of spores at each location on the grid (from the dispersion model), the covered population, grid cell-to-zip code correspondence, workflow mobility, inter-zip code driving distances, and distance weights. The output of this model will be the number of persons infected within each age/residential zip code/sex/spore-dose stratum. The main parameters to vary are the probability of infection given spore dose and the distance weights used to determine the geographic distribution of nonworking persons. Disease and Behavior ModelThe disease and behavior model determines the progression of infected persons through disease states and the generic types of health-care--utilization behaviors of infected persons. Drawing on previous work in modeling anthrax (14), progression is modeled through three disease states: incubation, prodromal, and fulminant. The disease progression for each person is modeled as a semi-Markov process (28), with the transition time between states sampled from a log-normal distribution parameterized by the person's spore dose. Base case parameters are adapted from a previous simulation study (14) (Table 2). Each infected person begins in the incubation state and progresses to the prodromal state. Unless successfully treated with curative therapy while in the prodromal state, the illness progresses to the fulminant state and then exits the model after the simulated duration of the fulminant state. For each day a person is in the prodromal or fulminant disease state, the person's health-care--utilization behaviors are simulated. The behaviors of persons are modeled as a Markov process (28), with the transition probabilities drawn primarily from the background data (Figure 3). The model is run for each person on each day until the person exits the model. Each person begins in the initial state (N) from which he or she can seek care in one of three ways: 1) a physician visit (MD); 2) an emergency-department visit (ED); or 3) a prescription without a clinical visit (Rx), or not seek care and exit the behavior model for that day. The first step in determining whether and how a person seeks care is to determine the daily background probability distribution of age/sex/diagnostic set for each care-seeking behavior. The diagnostic set is the set of International Classification of Diseases, Ninth Revision (ICD-9) diagnoses consistent with a person in the same disease state. Day-of-the-week variation in visit probability is taken into account when calculating background probabilities during the prodromal stage but not in the fulminant stage. In the fulminant stage, the assumption is that the only behavior that can be taken is to visit the ED, and that, at the first visit, the person is admitted and therefore leaves the simulation model. In the prodromal state, multiple visits can occur, and the background distribution of person-visit frequency is used to scale the probability of repeat visits. After the background probability of type of care by covariates has been determined, the next step in determining whether a person seeks care is to multiply the background probability by a scale factor unique to each disease state. These scale factors, to be varied in sensitivity analyses, account for the probability of not making a health-care visit for persons having symptoms consistent with the disease state. This cannot be estimated from the background data. Work is under way to identify these scale factors for classes of symptoms (e.g., lower respiratory, constitutional) through literature review and health-utilization surveys (29). After an individual care-seeking behavior is chosen, subsequent transition probabilities are determined directly from the background data for persons with the same age/sex/diagnostic set. The disease component of the model is run once for each infected person, and the behavior component of the model is run once for each day an infected person is in the prodromal state and once for each day in the unhospitalized fulminant state. Input to the disease-behavior model is the number of infected persons in each age/sex/spore-dose stratum, the disease state transition parameters, the diagnostic sets for each disease state, and the scale factors for seeking care in each disease state. The output is a set of behavior records for each infected person with each record defining the date of health-care utilization, demographic information including residential zip code, and type of utilization. The main parameters to vary are the disease state transition parameters, and the diagnostics sets and care-seeking scale factors for each disease state. Data-Source ModelThe data-source model uses the behavior records from the disease and behavior model to generate records for injection into background data sources. The current model includes two data sources: clinical visits and pharmaceutical prescriptions. These data sources are described in the Methods section; a list of the fields in each data source is provided (Table 1). Creation of a data source record requires assigning a diagnostic (ICD-9) or pharmaceutical code (GC3) and facility (clinic, hospital, or pharmacy) to a behavior record and formatting the resulting information to match the background data structure. Facility location is chosen by sampling the background data distribution based on the historic use of facilities by persons from the same residential zip code with the same diagnostic set. Diagnostic and pharmaceutical codes are chosen by sampling historic data distributions for persons with similar demographic characteristics. The inputs to the data source model are the behavior records and the diagnostic sets for each disease state. The output is the records for injection into the background data sources. The only parameter to vary is the diagnostic sets. ConclusionsThis paper defines requirements and specifies a design for an injection simulation model that should enable evaluation of outbreak detection through syndromic surveillance. Although it is intended to be generalizable, the model is described in the form required to simulate an aerosol attack with B. anthracis spores in the Norfolk, Virginia, area. The model scope and complexity have been limited by making plausible assumptions regarding patient and health-care provider behavior. The model also demonstrates an approach to developing a sufficiently complex outbreak signal by incorporating spatial mobility and by relying on joint variable distributions in background data sources. Finally, a method for incorporating explicit models of disease and illness behavior into a simulation model was demonstrated. The degree of detail in the model should allow for sensitivity analyses based on uncertain disease and behavior parameters to determine their influence on detection performance. References
* The views expressed are those of the author and should not be construed as representing the position of the U.S. Department of Defense. Table 1 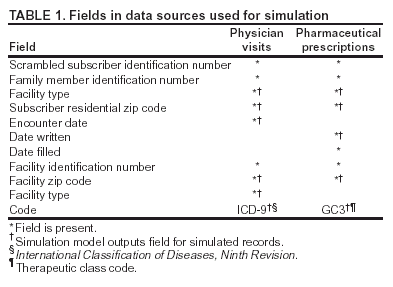 Return to top. Figure 1  Return to top. Table 2  Return to top. Figure 2 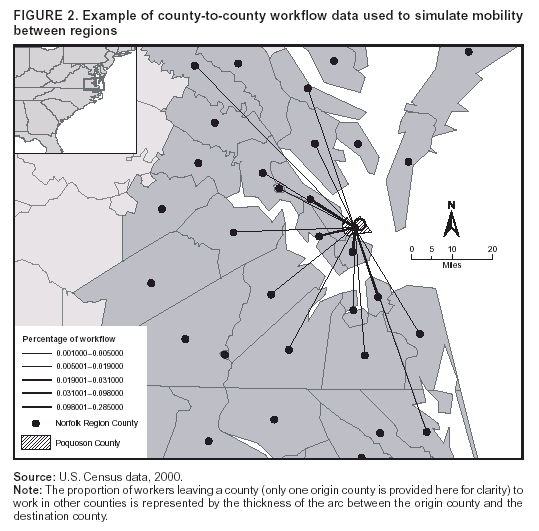 Return to top. Figure 3  Return to top.
Disclaimer All MMWR HTML versions of articles are electronic conversions from ASCII text into HTML. This conversion may have resulted in character translation or format errors in the HTML version. Users should not rely on this HTML document, but are referred to the electronic PDF version and/or the original MMWR paper copy for the official text, figures, and tables. An original paper copy of this issue can be obtained from the Superintendent of Documents, U.S. Government Printing Office (GPO), Washington, DC 20402-9371; telephone: (202) 512-1800. Contact GPO for current prices. **Questions or messages regarding errors in formatting should be addressed to mmwrq@cdc.gov.Page converted: 9/14/2004 |
|||||||||
This page last reviewed 9/14/2004
|