 |
|
|
|
|
|
|
| ||||||||||
|
|
|
|
|
|
|
||||
| ||||||||||
|
|
|
|
|
Persons using assistive technology might not be able to fully access information in this file. For assistance, please send e-mail to: mmwrq@cdc.gov. Type 508 Accommodation and the title of the report in the subject line of e-mail. Measuring Outbreak-Detection Performance By Using Controlled Feature Set SimulationsKenneth D. Mandl,1,2 B. Reis,1 C. Cassa1,3
Corresponding author: Kenneth D. Mandl, Division of Emergency Medicine, Children's Hospital Boston, 300 Longwood Avenue, Boston, MA 02115. Telephone: 617-355-4145; E-mail: Kenneth.Mandl@childrens.harvard.edu. AbstractIntroduction: The outbreak-detection performance of a syndromic surveillance system can be measured in terms of its ability to detect signal (i.e., disease outbreak) against background noise (i.e., normally varying baseline disease in the region). Such benchmarking requires training and the use of validation data sets. Because only a limited number of persons have been infected with agents of biologic terrorism, data are generally unavailable, and simulation is necessary. An approach for evaluation of outbreak-detection algorithms was developed that uses semisynthetic data sets to provide real background (which effectively becomes the noise in the signal-to-noise problem) with artificially injected signal. The injected signal is defined by a controlled feature set of variable parameters, including size, shape, and duration. Objectives: This report defines a flexible approach to evaluating public health surveillance systems for early detection of outbreaks and provides examples of its use. Methods: The stages of outbreak detection are described, followed by the procedure for creating data sets for benchmarking performance. Approaches to setting parameters for simulated outbreaks by using controlled feature sets are detailed, and metrics for detection performance are proposed. Finally, a series of experiments using semisynthetic data sets with artificially introduced outbreaks defined with controlled feature sets is reviewed. Results: These experiments indicate the flexibility of controlled feature set simulation for evaluating outbreak-detection sensitivity and specificity, optimizing attributes of detection algorithms (e.g., temporal windows), choosing approaches to syndrome groupings, and determining best strategies for integrating data from multiple sources. Conclusions: The use of semisynthetic data sets containing authentic baseline and simulated outbreaks defined by a controlled feature set provides a valuable means for benchmarking the detection performance of syndromic surveillance systems. IntroductionEvaluation of surveillance systems for early detection of outbreaks is particularly challenging when the systems are designed to detect events for which minimal or no historic examples exist (1). Although infection by biologic agents is rare, exceptions have occurred. For example, in 1979, persons living in Sverdlovsk in the former Soviet Union were exposed to Bacillus anthracis during an unintentional release from a weapons plant (2), and a limited number of persons were exposed in Florida, New York, and the District of Columbia during 2001 when B. anthracis spores were released through the mail (3). However, absent sufficient real outbreak data, measuring a system's detection performance requires simulation. Simulated outbreaks must reflect the diversity of threats, both natural and man-made, that a surveillance system might reasonably be expected to encounter and detect. This paper describes a flexible approach to generating standardized simulated data sets for benchmarking surveillance systems and provides examples of its application. Rather than model all possible conditions and factors, the approach relies on simulated outbreaks characterized by a controlled feature set that systematically defines the magnitude, temporal progression, duration, and spatial characteristics of the simulated outbreaks on the basis of variable parameters. Stages of Outbreak DetectionThe goal of outbreak detection is to generate an alert whenever observed data depart sufficiently from an expected baseline (4). In other words, the system must be able to detect a signal (i.e., disease outbreak) against background noise (i.e., normally varying baseline disease in the region). Four basic methodologic stages are used to process data for outbreak detection: 1) the syndrome grouping stage, in which data acquired from different sources are used to assign each patient to a particular syndrome group (e.g., respiratory infection or gastrointestinal infection); 2) the modeling stage, in which historic data, including data for patients during the past year(s), are analyzed to establish a model from observed temporal and spatial patient distributions; 3) the detection stage, in which the expected values (i.e., predicted daily frequencies of patients in each syndrome group) are compared with observed values to determine whether abnormal activity is occurring; and 4) the alert stage, in which thresholds are set to evaluate whether an unusual pattern warrants notifying public health authorities. The first two stages can be accomplished by using historic data from a given region. Depending on the data source, different methods can be used to assign a case to syndrome group. For example, emergency department (ED) data can be categorized by chief complaint by using a naïve Bayesian classifier (5) or by a standardized grouping of International Classification of Disease, Ninth Revision (ICD-9) codes (6). Outbreaks are identified by comparing observations with the predictions generated by a model describing the expected baseline temporal or spatial pattern. Examples include time-series models (7), spatial scan statistics (8,9), and models of interpoint distance distributions (10). At the detection stage, observed values must be compared with expected values; a signal containing outbreaks (hereafter referred to as an outbreak signal) is required to evaluate a system's detection performance. However, limited data are available concerning terrorism-related events, and none are available in the format used by existing syndromic surveillance systems. Data Sets for Benchmarking PerformancePerformance of outbreak-detection models can be measured by using authentic data, synthetic data, or combinations of the two (Table). Two kinds of purely authentic data sets are possible. One is genuine syndromic data contemporaneous with either a known large-scale local outbreak (e.g., a winter influenza surge) (11) or a more circumscribed event (e.g., a diarrheal outbreak) (12). The data set would contain the background of ordinary disease or symptom occurrence and the signal of the actual outbreak. A second type of authentic data set is a hybrid containing background from a regional surveillance system spiked with cases from a known outbreak. This approach was taken when over-the-counter medication-sales data were spiked with an outbreak based on the Sverdlosk incident (13). Alternatively, a hypothetical baseline can be constructed, and actual or simulated signals can be imposed and injected. Although this approach is valid, limited need exists to simulate background activity, given the abundance of readily available real-signal streams from surveillance systems. The approach described in this paper superimposes a simulated signal onto an authentic baseline, permitting exploration of the effects of controlled variations of signal characteristics. Two main approaches can be taken to creating this simulated signal: 1) using multistage, multivariate mathematical models to produce the signal or 2) defining a series of parameters that enable generation of a controlled feature set simulated signal. For example, a complex mathematical model (14) might be based on a scenario in which a particular form of aerosolized B. anthracis is dispersed under a certain set of atmospheric conditions over a specific geographic region with a well-characterized population demographic. The number of susceptible persons might be estimated and their subsequent behaviors modeled. The resulting effect on the syndromic surveillance data set (e.g., retail sales, primary care visits, or ED visits) could be projected. However, this approach for evaluating outbreak-detection performance is labor-intensive, and the models are based on multiple assumptions. A more flexible approach is to use a set of variable parameters describing a particular outbreak. Defining feature sets of outbreaks (e.g., magnitude, shape, and duration) allows rapid determination of the limits of a system's ability to detect an outbreak under varying conditions. Using Parameters To Specify Outbreak CharacteristicsBackground noise can be spiked with additional cases configured as spatial or temporal clusters, describable as a controlled feature set. Different adjustable parameters enable ready manipulation of the simulated outbreaks. Optimally, a training data set should be modeled, and the artificial outbreak signal should be injected into a validation data set. However, if sufficient data are not available to do so, the artificial outbreak signal can be injected into the same data used for training. Outbreak DurationA key parameter is the duration of the added outbreak signal. Executing simulations over a range of outbreak durations is useful, and various factors might influence the range chosen. Different agents can cause outbreaks of different lengths; for example, a surge in influenza activity lasts weeks or months, whereas a foodborne outbreak might last only 4--5 days. Furthermore, the temporal window used by the detection system might have a substantial effect on how outbreaks of different magnitudes are detected. If the detection window were based, for example, on a sliding moving average of 7 days, 2- or 3-day--long outbreaks would be smoothed out; under certain conditions, this smoothing might dilute the signal. Conversely, outbreaks gently trending upward in numbers might not be detected with a shorter sliding window. Outbreak SpacingOne efficient way to measure outbreak-detection performance and the factors that influence it is to spike a data stream with a substantial number of individual outbreaks. The more outbreaks presented to a model-based system, the more accurately the system's detection performance can be characterized. To maximize the number of simulated outbreaks in the data set, one can introduce multiple nonoverlapping outbreaks in a single data set (e.g., a 5-day outbreak beginning on day 1, a second beginning on day 11, and a third on day 21). The outbreaks are then removed and replaced by a different set of nonoverlapping outbreaks and again presented to the system (e.g., days 2, 12, and 22). For measurement purposes, all individual outbreaks must be isolated temporally to ensure any response to the previous outbreak has been eliminated from the system before the next outbreak is encountered. For systems that analyze data by using a temporal window of >1 day, the spacing between outbreaks must be greater than that width to ensure independence. Although such temporal isolation is critical for accurate measurement of detection performance, it will not directly address the system's ability to detect overlapping outbreaks. Shifting the outbreaks in time ensures that outbreaks are affected by different regions of noise (Figure 1). Spacing outbreaks throughout the year also permits measuring the effect of seasonal changes in the background on outbreak detection. Understanding the effects of different regions of background noise cannot be accomplished without simulation. Outbreak Temporal ProgressionThe time course of an outbreak spreading through a population can follow multiple paths, effectively producing a signature shape related to the epidemic curve. For example, a highly infectious disease (e.g., smallpox) could spread exponentially over time, whereas a point-source exposure that is not contagious from person to person (e.g., a release of B. anthracis) would be unlikely to grow exponentially. Multiple canonical shapes of temporal progression (Figure 2) can be used in simulations to characterize the detection performance of surveillance systems. In a system monitoring daily ED visits, for example, flat outbreaks have a fixed number of extra visits/day for the duration of the outbreak (e.g., 10, 10, 10, 10, and 10 extra visits for a 5-day outbreak). Linear outbreaks have a linearly increasing number of extra visits/day over the course of the outbreak (e.g., five, 10, 15, 20, and 25 extra visits for a 5-day outbreak). Exponential outbreaks have an exponentially increasing number of extra visits/day over the course of the outbreak (e.g., two, four, eight, 16, and 32 extra visits for a 5-day outbreak). Sigmoid-shaped outbreaks mirror epidemiologic phenomena in which the number of affected individuals increases exponentially at first, then slows down until it plateaus at a new fixed level (e.g., two, four, eight, 12, and 14 extra visits for a 5-day outbreak). Alternatively, a model of more complex shape described by a multinomial (e.g., the Sverdlosk [2] outbreak) might be desirable. Outbreak MagnitudeBecause the minimum detectable size of an outbreak is often of interest, outbreak-detection performance should be tested over a range of signal magnitudes; detection performance might vary substantially depending on these magnitudes. This variability is attributable primarily to the changes in signal-to-noise ratio that result from different outbreak sizes. For limited outbreaks that are at or near the "noise floor" of the model (i.e., the usual level of random variability in the model's predictions), the detection performance is typically poor because distinguishing outbreaks from the random noise of the model is difficult. As the relative size of an outbreak increases, identifying an outbreak in the presence of noise becomes easier. Once the outbreak magnitude is such that the noise does not effectively mask it, the outbreak-detection performance of the system typically plateaus at perfect or near perfect detection. For identification of an appropriate range of outbreak magnitudes for simulations, the error or noise profile of the model should be characterized. The daily forecast errors of the model, defined as the forecast value minus the actual value for each day, must be calculated. The error profile can be visualized by plotting a histogram of these daily forecast errors and standard deviation of the error distribution. Outbreak magnitudes should range from near zero to at least twice the standard deviation of the forecast error. For example, in the case of a model of ED visits with mean of 140 visits/day and an error profile with a standard deviation of 20 visits, simulations of outbreaks ranging in magnitude from 0 to 40 visits/day should be run. This range can be sampled in intervals of five, yielding the following set of outbreak magnitudes: 0, 5, 10, 15, 20, 25, 30, 35, and 40. The error profile of a model might vary during a year because of seasonal differences in signal variability. For example, respiratory-visit rates could vary more unpredictably in winter than in summer. In such cases, constructing separate error profiles for different seasons might be useful to tailor the detection test to each season. Spatial FeaturesThe outbreak cluster might describe the spatial relationship among the additional cases, which are represented as geocodes (i.e., latitude and longitude), possibly augmented by a time stamp. If so, the cluster can be described in terms of a maximum cluster radius, the distribution of cases within that radius, and the angle from a fixed point (e.g., a hospital). Simulating spatial clusters raises additional challenges, including the identification of realistic locations for simulated cases, based on the spatial features of a region (e.g., housing and of bodies of water). Metrics for Detection PerformanceSensitivity and SpecificityA tradeoff always exists between sensitivity and specificity, and the ability to detect outbreaks must be balanced against the cost of false alerts (1). For evaluation purposes, holding sensitivity or specificity constant can be useful when plotting the other against another variable (e.g., outbreak magnitude or duration). For example, specificity might be held constant while plotting sensitivity versus outbreak magnitude. For each outbreak magnitude, the alert threshold should be tuned until the desired number of false alerts (and thus the desired specificity) is achieved. At this point, the resulting sensitivity under these conditions is measured. This process is repeated for each outbreak magnitude, ultimately yielding a plot of sensitivity versus outbreak magnitude with specificity fixed. The likelihood of not having an alert when no signal (specificity) exists can be measured simply by running the model on the baseline data without inserting artificial outbreaks. Overall Outbreak Detection Versus Outbreak Day NumberBecause outbreaks presented to the system typically will last >1 day, sensitivity and specificity can be measured either in terms of detection of specific outbreak days or of the overall outbreak. When the outbreak-day approach is used, each day is considered a separate, independent case; if a particular 5-day outbreak is detected on 3 days but missed on 2 days, three successes (true positives) and two failures (false negatives) are recorded. Similarly, each of the intervening nonoutbreak days is considered independently when false-positive and true-negative rates are calculated. When the overall outbreak-detection approach is used, each outbreak is viewed as a single entity; if the outbreak is correctly detected on an outbreak day, the system has produced a true positive. An alternative criterion for a true positive is that the outbreak was correctly detected on a majority of the outbreak days. When the overall outbreak sensitivity is reported (e.g., "The system detected X% of all outbreaks presented to it"), full sensitivity and specificity statistics are reported by using the outbreak-days approach. Receiver Operator Characteristic (ROC) CurvesThe tradeoff between sensitivity and specificity is well-portrayed by ROC curves, which plot sensitivity versus one minus the specificity. For tests that have no diagnostic value, the ROC curve is a straight line along the diagonal of the plot. For plots of tests with higher diagnostic value, the line is curved away from the middle of the plot. The area under the ROC curve can thus be used as a measure of the diagnostic value of a test (9). The diagnostic value of two tests can be compared by comparing the areas under their respective ROC curves. Controlled Feature Set Simulation ApplicationsA series of experiments was conducted by using semisynthetic data sets containing authentic background noise and controlled feature set simulated outbreaks. These experiments illustrate the flexibility of the approach. In all these experiments, the primary sources of data were ED chief complaints and ICD-9 codes from two urban academic teaching hospitals that share the same catchment area. The first experiments were performed to test the accuracy of the model used for the Automated Epidemiologic Geotemporal Integrated Surveillance (AEGIS) system, which was developed at Children's Hospital Boston and Harvard Medical School. This autoregressive integrated moving average (ARIMA) model was constructed on the basis of approximately a decade of historic data from a single ED. The model is run every 10 minutes on real-time data streams producing forecasts of ED volume over the next 24 hours. The system was presented with 7-day--long outbreaks of fixed size, spaced 15 days apart. Specificity was held constant at 97% to produce approximately one false alert/month. On average, 137 visits occurred each day. The results indicated a positive relationship between outbreak magnitude and system sensitivity at varying outbreak magnitudes (7). For performance to be improved, a series of experiments was conducted in which the temporal detection window was widened from 1 day to 1 week, and a controlled feature set simulation was used to measure the effects of temporal filters, differentially weighting the importance of each day for 1 week. The results demonstrated that the wider temporal window was able to more than double the detection sensitivity while holding the specificity fixed. The results also indicated that different temporal filter shapes provided complementary sets of benefits with regard to timeliness and overall sensitivity of detection (15). Syndromic surveillance systems require data that allow the grouping of patients into syndromes or prodromes. Previous studies have examined the accuracy of different methods of syndrome grouping (16--19). This study assessed the effects of syndrome groupings on model accuracy, which is a key factor in outbreak-detection performance (20). Daily ED visit rates were analyzed from two urban academic tertiary-care hospitals. Three methods were used to group the visits into a daily respiratory-related syndrome category: chief complaint, diagnostic codes, and a combination of the two. These groupings were used to build historic models that were then tested for forecasting accuracy and sensitivity for detecting simulated outbreaks. For both hospitals, the data grouped according to chief complaint alone yielded the lowest model accuracy and the lowest detection sensitivity. Using diagnostic codes to group the data yielded better results. Smoothing of the data was demonstrated to improve sensitivity in all cases, although to varying degrees. Combining the two grouping methods yielded the best accuracy and sensitivity. In the last set of experiments, the optimal method for integrating data from multiple regional EDs was determined (21). In one simulation, the synthetic outbreak was introduced evenly into both hospital data sets (aggregate model). In the second, the outbreak was introduced into only one or the other of the hospital data sets (local model). The aggregate model had a higher sensitivity for detecting outbreaks that were evenly distributed between the hospitals. However, for outbreaks that were localized to one facility, maintaining individual models for each location proved to be better. Given the complementary benefits offered by both approaches, the results suggested building a hybrid system that includes both individual models for each location and an aggregate model that combines all the data. LimitationsThis study is subject to at least four limitations. First, using simulated data for benchmarking syndromic surveillance systems carries the risk of evaluating performance under unrealistic conditions. Second, the controlled feature set simulation approach entails the explicit assumption that the historic data are pure noise and contain no signal. For terrorism-related events, this assumption is almost certainly true. However, detectable outbreaks of naturally occurring infection are likely contained within the historic data. Third, this approach does not account for processes occurring at the syndrome-grouping stage because artificial cases are injected directly into the data stream. A person with a case of true upper respiratory infection who reports to an ED might not be correctly assigned to the proper syndrome group on the basis of a chief complaint or ICD-9 code. However, the approach could be modified to introduce simulated cases earlier in the process, hypothetically presenting them to the syndrome classifier, enabling modeling of the accuracy of the syndrome grouping process. Finally, in live syndromic surveillance systems, records representing specific events for a given day might be transmitted from the data sources at different points in time. Such time delays could be incorporated into the controlled feature set simulations. In the experiments described, discrete parameter values are assigned. Another approach would be to use a method such as Monte Carlo simulation (22) to redefine the model parameters over a smoother distribution of values. Application of controlled feature set simulation to surveillance by using multivariate data streams requires explicit assumptions about the relationships among the signal features across data sets. ConclusionsUse of semisynthetic data sets containing authentic background noise and outbreaks defined by a controlled feature set provides a valuable means for benchmarking the detection performance of syndromic surveillance systems. Acknowledgments This work was supported by the National Institutes of Health through a grant from the National Library of Medicine (R01LM07677-01), by contract 290-00-0020 from the Agency for Healthcare Research and Quality, and by the Alfred P. Sloan Foundation (Grant 2002-12-1). References
Figure 1 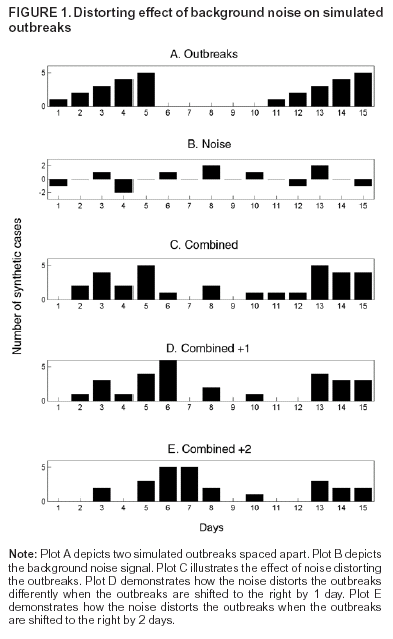 Return to top. Figure 2 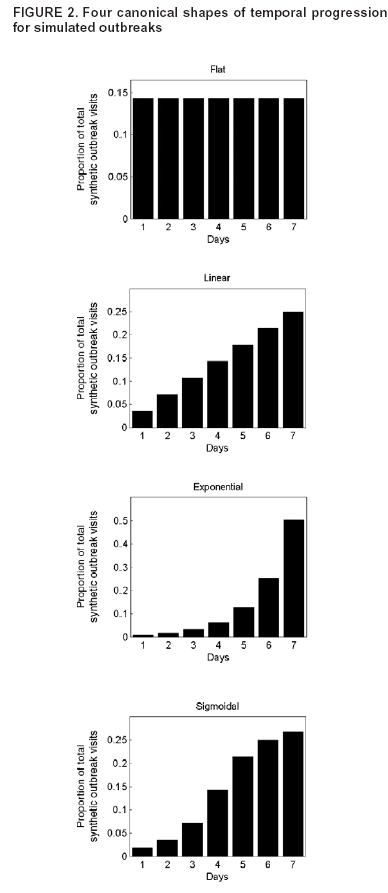 Return to top. Table 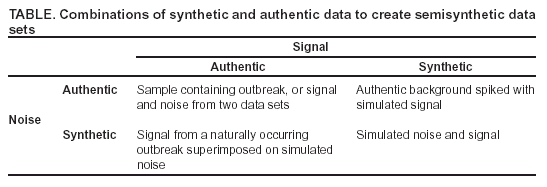 Return to top.
Disclaimer All MMWR HTML versions of articles are electronic conversions from ASCII text into HTML. This conversion may have resulted in character translation or format errors in the HTML version. Users should not rely on this HTML document, but are referred to the electronic PDF version and/or the original MMWR paper copy for the official text, figures, and tables. An original paper copy of this issue can be obtained from the Superintendent of Documents, U.S. Government Printing Office (GPO), Washington, DC 20402-9371; telephone: (202) 512-1800. Contact GPO for current prices. **Questions or messages regarding errors in formatting should be addressed to mmwrq@cdc.gov.Page converted: 9/14/2004 |
|||||||||
This page last reviewed 9/14/2004
|