 |
|
|
|
|
|
|
| ||||||||||
|
|
|
|
|
|
|
||||
| ||||||||||
|
|
|
|
|
Persons using assistive technology might not be able to fully access information in this file. For assistance, please send e-mail to: mmwrq@cdc.gov. Type 508 Accommodation and the title of the report in the subject line of e-mail. Progress in Understanding and Using Over-the-Counter Pharmaceuticals for Syndromic SurveillanceSteven F. Magruder, S. Happel Lewis, A. Najmi, E. Florio
Corresponding author: Steven F. Magruder, Johns Hopkins University Applied Physics Laboratory, 11100 Johns Hopkins Road, Laurel, Maryland, 20723-6099. Telephone: 443-778-6537; Fax: 443-778-5950; E-mail: steve.magruder@jhuapl.edu. AbstractIntroduction: Public health researchers are increasingly interested in the potential use of monitoring data on over-the-counter (OTC) pharmaceutical sales as a source of timely information about community health. However, fundamental uncertainties persist, including how timely such information is and how best to aggregate information about hundreds of products. Objectives: This analysis provides new information about OTC timeliness and illustrates a method of OTC product aggregation for surveillance purposes. Methods: Timeliness measurements were made by correlating pharmaceutical sales counts with counts of physician encounters, after adjustment to remove seasonal effects from both counts. OTC product aggregations were formed by a two-stage process. In the first stage, individual products were placed into small groups based on qualitative observations. In the second stage, a clustering algorithm was used to form supergroups (i.e., product group clusters) sharing similar sales histories. Results: Even after seasonal correction, OTC counts correlated with clinical measures of community illness. However, the lead time of nonseasonal fluctuations was substantially shorter than that for uncorrected data. The clustering approach produced 16 meaningful supergroups containing products that behaved approximately alike. Conclusions: Measurements of OTC lead time sensitive to the timing of annual cyclic trends in the behavior of persons seeking health care do not reliably indicate the lead time observed for short-term (e. g. weekly or monthly) fluctuations in community health-care utilization. IntroductionData on the sale of over-the-counter (OTC) pharmaceutical products might provide a convenient, meaningful, and timely indicator of public health conditions (1--6). Monitoring sales of OTC products offers at least three advantages as possible early indicators of public health. First, these products are widely used. Second, a reliable and detailed electronic record is made instantly at the time of each sale, and such records are aggregated regionally for commercial purposes; these electronic records can be readily transmitted to aid in health surveillance. Finally, OTC data also capture the location of sale and type of product (and, by implication, the symptom[s] that the product is intended to relieve). Despite growing interest in OTC data, certain questions persist, including 1) how to interpret OTC sales data, 2) how much lead time these data should be expected to provide, 3) how to aggregate OTC products into informative product groupings, 4) how to control confounding factors, and 5) which product sales correlate with which types of illnesses. This report outlines progress in answering two of those questions. With respect to OTC lead time in tracking trends in health-care utilization, the analysis indicates that lead-time measurements based on the timing of annual cyclic trends can be longer than those based on short-term fluctuations, which are more relevant to public health surveillance. With respect to appropriate aggregations of OTC products, the report describes a method used by the Electronic Surveillance System for the Early Notification of Community-Based Epidemics (ESSENCE II) (7). The actual product aggregations identified might also provide insights for future study. OTC Lead Time: Short-Term and Seasonal ObservationsMultiple studies have attempted to quantify the timeliness of OTC sales compared with other indicators of public health (1,5,6). A 1964 study based on two outbreaks in a single city identified a substantial peak in cold remedy sales at the beginning of an increase in encounters with clinical patients known to be infected with influenza B virus and 1 week before the peak in those encounters; an earlier increase in cold remedy sales was approximately coincident with the early winter increase in noninfluenza respiratory virus activity (1). A second study compared the time series of hospital-discharge diagnoses to OTC electrolyte sales for six cities and over three annual cycles (5). Because these discharge diagnoses were tagged with the time of hospital admission, they could be viewed as a proxy for a chief-complaint data source. Lead times were measured by two methods: cross-correlation of the raw time series and comparison of the times for the first detectable increase each year. The two methods produced consistent estimates indicating approximately 2-week lead times for pediatric electrolyte sales relative to pediatric hospital admissions for respiratory and diarrheal disease. Lead times measured by both methods are sensitive to the seasonal variation of the two data sources; the timing of events that occur on shorter time scales might be obscured. A third study compared a time series of outpatient insurance-claim diagnoses for acute respiratory conditions to OTC sales of influenza remedies in six different subregions of the Maryland--Washington, D.C.--Virginia area (6). Lead times were estimated by cross-correlation of data that were corrected for day-of-week effects and for the effect of the late-December holiday period. Measured peak correlations ranged from 0.86 to 0.93, and the average measured lead time of OTC sales relative to outpatient physician encounters was 2.8 days (range: 2--7 days). Although these results also were dominated by seasonal trends, this report presents corresponding results with seasonal effects removed. Although certain natural and societal processes that occur annually could influence these results, such processes might not be important for short-term surveillance time scales, and the applicability of seasonal results might be questionable. For public health surveillance applications, the timing of seasonal trends is not the quantity of primary interest. More often, disease surveillance seeks timely recognition of short-term (e.g., weeks or days) health trends. OTC Product AggregationsBecause the >1,000 OTC pharmaceutical products that are of potential interest for public health surveillance compete for customers with the same ailments, aggregation of related products is necessary to obtain statistically useful inferences about the number of people feeling ill. The goal of an aggregation method is to combine products that are used by the same demographic groups to treat the same illnesses (defined as a given combination of symptoms and by the relative severity of those symptoms). Differences in sales between products in an aggregated product group would then be irrelevant for public health surveillance. By contrast, when products are used by different demographic groups or to treat different symptoms, then aggregation of these products could compromise specificity and be less useful. Data SourcesThis analysis relied on two data sources identical to those used in a previous study (6). The first source was pharmacy-sales data from approximately 300 drugstores in the Maryland--Washington, D.C.--Virginia area. The pharmacy data included store location, product sold, number of units sold, and date sold; no information was provided that would identify the purchaser. For the timing study, only remedies for treating influenza were used. For the OTC aggregation study, a larger set of product categories was used, including cough, cold, allergy, sore throat, fever, "flu," antidiarrheal, bronchial, sinus, and pain remedies. The second data source was insurance-billing data from approximately 13,000 outpatient clinics and doctors offices in the Maryland--Washington, D.C.--Virginia area. These data included the patient's geographic region, the date of the patient-physician encounter, and the primary diagnostic code used for billing purposes. Not all patients from these 13,000 clinics were included. A weekly average of approximately 4,000 encounters was reported for acute respiratory conditions in all geographic regions. Only diagnostic codes of interest for syndromic surveillance were collected, and only acute respiratory diagnoses were used in the analysis. MethodsOTC Lead TimeBoth the physician acute respiratory encounter data and the OTC influenza remedy data were modeled by a Poisson regression. The covariates were a linear time ramp, a sinusoidal annual cycle (8), day-of-week factors, and a day-of-week/annual cycle interaction term. Holidays and heavy snow days were ignored when the regression parameters were estimated. After the data were fitted to a model of seasonality, separate considerations were made of seasonal and nonseasonal trends in the data. Weekly cycles were removed from the OTC- and physician-encounter--model fits by smoothing with a 7-day moving average window. The resulting smoothed model fits contained only linear and seasonal variations. The seasonal contribution to lead time was measured by cross-correlating the smoothed model fits. Nonseasonal contributions were measured by correlating the residuals of the model fits (smoothed actual counts divided by smoothed model fit) for each of the subregions in the study. A comparison of these residuals for the most populous region included in the study, the Urban National Capital Area (consisting of the urban and suburban areas near Washington, D.C., Baltimore, Maryland, and the corridor in between) is provided (Figure 1). A strong correspondence was observed between fluctuations in OTC sales and fluctuations in physician encounters, even after a sinusoidal annual cycle was removed from both. These residuals exhibited smaller correlations than did the original data, but because they were not driven by cyclic annual trends, the relevance to time-critical public health surveillance was clearer. Method To Cluster Similar Sales HistoriesA two-step OTC aggregation method was developed for preliminary use in the ESSENCE II surveillance system. The first step was to group individual products qualitatively into 41 adult groups, 16 pediatric groups, and four infant groups, each of which was formed by combining an indication (e.g., allergy, cough, or fever) with a physical type (e.g., chest rub, inhaler, or lozenge). Indications for the product were judged first by the product name. If the names alone left the indications ambiguous, then product descriptions were consulted. This first step was required to obtain a high enough count of sales in each group so more quantitative methods could be applied. Although the first step was essentially qualitative, a conservative approach was taken by finely dividing the set of all OTC products into a substantial number of first-level product groups. This process was not expected to result in products with distinct uses being placed in the same group. For the second stage of aggregation, observed sales histories (i.e., the number sold on each day during a certain period) of the different first-level groups were compared across a test period of approximately 17 months. If the ratio of sales of one product group to another was approximately constant over time, then the two product groups were assumed to be used to treat the same illnesses. Therefore, groups with approximately proportional sales histories were aggregated into supergroups for use in public health surveillance. The likelihood of observing the data under two different models was compared to measure the similarity of different groups' sales histories. Under model 1, the aggregated sales of product group N and M were assumed to be Poisson distributed with means that could vary from day to day. The natural log of the ratio of their means was assumed to be normally distributed with a standard deviation of 0.1. (This standard deviation was chosen to be small so the ratio between expected sales of products N and M could vary only slightly in the model.) The overall average log ratio and the daily (geometric) average of the means of product groups M and N were chosen by a maximum likelihood fit to the data. Under model 2, the sales of product groups N and M on each day were assumed to be independently Poisson-distributed, with means equal to the observed daily sales counts. Because it was less constrained, the second model would always fit better. However, if the product groups were closely related, and if sales of product group N tended to rise and fall in proportion to sales of product group M, then model 1 would fit almost as well. The difference in data likelihood between the two models indicated the degree to which the two sales histories are not proportional. Therefore, a distance, D, was defined between product groups M and N by applying the following formula: D = log(probability of observing the data under model 2) -- log(probability of observing the data under model 1) After this distance measure was obtained, standard hierarchical clustering techniques (9) were used to find clusters of product groups that were close together relative to the other product groups, as measured by the distance, D. As this technique was refined, a complication was encountered that was apparently attributable to the effects of product promotions. When daily sales of cold remedies in powder form were compared with sales of cold/influenza remedies in pill form, products were found to have closely related sales histories. However, on three occasions (November 2001, September 2002, and October 2002), sales of cold powders substantially exceeded their normal level for periods of 6--7 days, whereas sales of cold/influenza pills did not. These events were assumed to be attributable to promotions and were excluded from the analysis. An automated way to identify these 1-week aberrations was developed. First, a local background estimate was subtracted from raw OTC data, aggregated for each first-stage product group by using a trimmed-mean algorithm with a 20-day window centered on each day to create a normalized time series. Second, the normalized data were compared with a threshold, relative to a local estimate of the standard deviation. Finally, runs of threshold exceedences lasting 6--8 days were identified and excluded from the calculation of the distance, D. The output of the clustering algorithm for the adult product groups is summarized in a dendrogram (Figure 2). By setting a threshold on this dendrogram at a specific distance value, distinct clusters of product groups (supergroups) were formed to be aggregated for health surveillance purposes. If the threshold were set too high, specificity would be lost because unrelated groups would be aggregated together. If it were set too low, statistical power would be lost because the resulting larger number of aggregated groups would have lower counts, and results would also be more susceptible to product-specific influences (e.g., promotions or introductions of new products). For ESSENCE applications, the threshold was set initially at a level to form 16 supergroups, some of which might not be selected for monitoring. ResultsOTC Lead TimeAn analysis of the correlation-based measurements of OTC lead time identified high cross-correlations between the smoothed model fits for physician visits and OTC sales (Table 1). This finding reflects the fact that both model fits were 1-year--period sine waves that were shifted in time to maximize cross-correlation. In every case except Richmond, the sine-wave fit to the OTC data was shifted approximately 1--3 weeks earlier than the sine wave that was fit to the physician-encounter data. This indicates a repeatable 1--3 week lead in the seasonal cycle of OTC purchases, relative to the corresponding cycle in physician encounters. Strong correlations between physician-visit and OTC residuals were observed, even though the seasonal trends were removed. The observed time-shifts in these residuals (as defined by maximum cross-correlation) were much shorter (in every case except that of Richmond) than those observed for the seasonal fits. The correlation in the best case (Urban National Capital Area) was also evident from a plot of the data (Figure 1), and the lead for this case was measurable, as indicated by the rapid decrease in correlation at other lags (Figure 3). ClusteringA total of 16 supergroups were identified (Table 2). The sales histories represented by these groups ranged from strong winter seasonal peaks to approximately constant daily sales throughout the year to peaks in the spring and fall pollen seasons. Product groups with similar indications or similar physical forms tended to be placed in the same supergroups. This result was not guaranteed by the method but rather indicates that similar sales histories correlate with similar product use. Although this analysis took an empirical approach, certain supergroups (e.g., cough, allergy, sore throat, and sinus remedies) would have been formed anyway on the basis of intuition. However, the strength of this empirical approach is evident in the more surprising results. For example, pain pills were used heavily during the pollen season and therefore are grouped in the allergy cluster. Also, sales histories of powders sold to treat various maladies are more similar to each other than they are to other products advertised for the same maladies. Monitored allergy syrups do not appear to belong with other allergy medications because sales peak during the winter cold season rather than during the pollen season. (A probable explanation, obtained after the analysis was completed, was that most allergy syrups included in the data were targeted for diabetics.) Finally, products advertised to treat chest congestion had little indication of a seasonal trend and therefore did not cluster with products advertised to treat other respiratory conditions. ConclusionsOTC Lead TimePersistent correlations between OTC influenza remedy sales and physician acute-respiratory encounters were determined, even after removal of the annual sinusoidal variation from both. This makes a more convincing case for the use of OTC products to monitor sudden changes in public health than do results strongly influenced by annual variations. However, these data do not indicate a repeatable positive lead time of OTC products relative to physician encounters on shorter, subannual time scales. Earlier results about OTC timeliness based on annual cycles could be misleading. The findings outlined in this report are subject to at least two limitations. First, the lower correlations observed in certain regions might be biased by inexact spatial correspondence between physician encounter and OTC data sets; a more comprehensive data set might provide a basis for more precise measurements of correlations and lead times. Second, only the relation between influenza remedies and acute respiratory diagnoses was considered, and other OTC--physician connections might yield different results. If other researchers are able to verify the result of no significant lead time of OTC data relative to physician encounters at subannual time scales, this would not necessarily imply that OTC data are not useful for public health surveillance. None of this analysis includes the lag in reporting the data. OTC sales data might be electronically available with a shorter reporting lag after the sales event compared with the lag to receive physician outpatient data. The number of patients seeking OTC medications early during a given outbreak might also be larger than the number seeking care from a physician. All else being equal, OTC sales data are potentially a more sensitive measure of community illness. OTC Product AggregationA quantitative method was presented that can be used to enhance and validate a more qualitative approach by automatically sorting through a heterogeneous set of OTC product groups to find relatively homogenous supergroups of products. Both the method and the specific supergroups identified might be helpful to others attempting to use OTC data for surveillance of community health. This method demonstrated its value for the ESSENCE surveillance system by finding certain unexpected relationships between product groups. Appropriate aggregation of product supergroups might vary regionally or demographically. The method discussed in this report might be a good approach for identifying custom OTC aggregations for specific applications. Acknowledgments This work was sponsored by the Defense Advanced Research Projects Agency (DARPA) as part of the Bio-ALIRT program. The material contained in this report was cleared by DARPA and approved for public release, distribution unlimited. Ron Bloom of General Dynamics provided useful insights concerning the interpretation of lead time measurements. References
Table 1 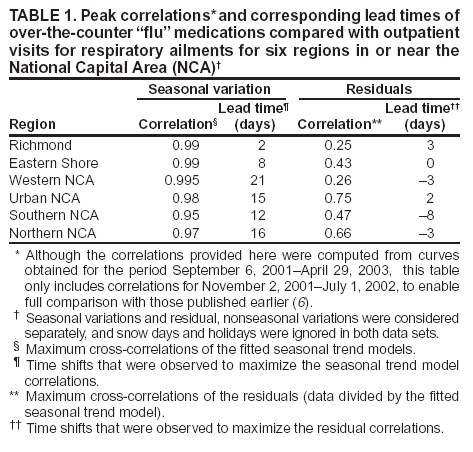 Return to top. Figure 1 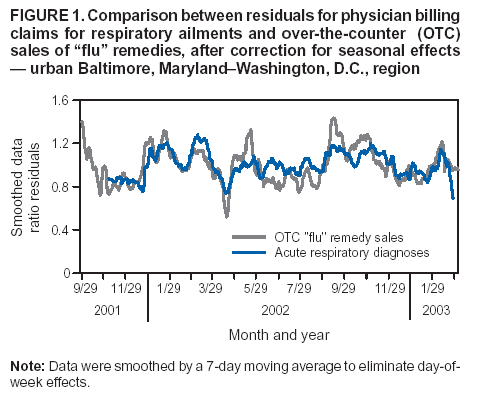 Return to top. Table 2 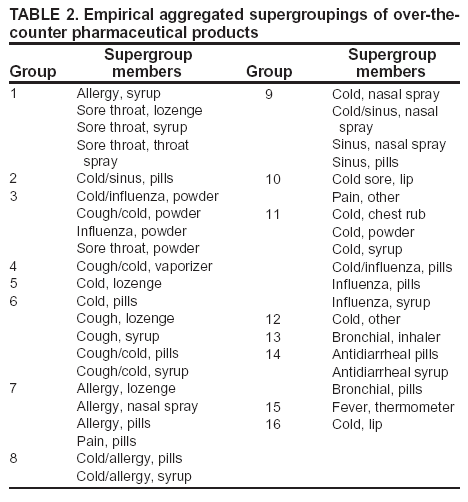 Return to top. Figure 2 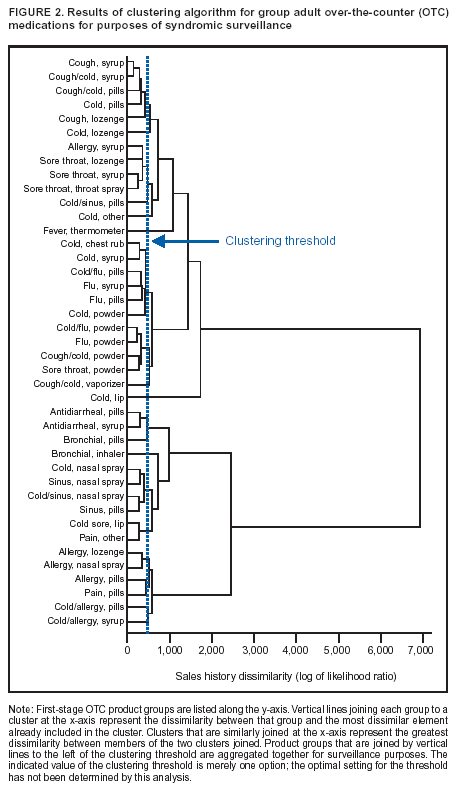 Return to top. Figure 3 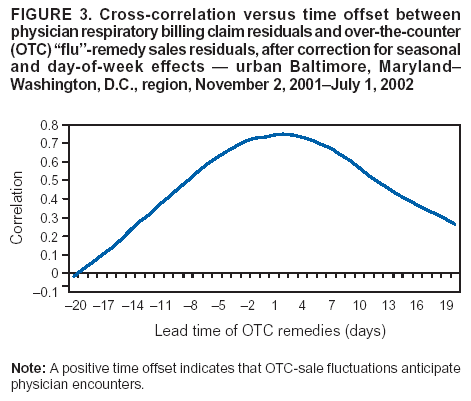 Return to top.
Disclaimer All MMWR HTML versions of articles are electronic conversions from ASCII text into HTML. This conversion may have resulted in character translation or format errors in the HTML version. Users should not rely on this HTML document, but are referred to the electronic PDF version and/or the original MMWR paper copy for the official text, figures, and tables. An original paper copy of this issue can be obtained from the Superintendent of Documents, U.S. Government Printing Office (GPO), Washington, DC 20402-9371; telephone: (202) 512-1800. Contact GPO for current prices. **Questions or messages regarding errors in formatting should be addressed to mmwrq@cdc.gov.Page converted: 9/14/2004 |
|||||||||
This page last reviewed 9/14/2004
|