 |
|
|
|
|
|
|
| ||||||||||
|
|
|
|
|
|
|
||||
| ||||||||||
|
|
|
|
|
Persons using assistive technology might not be able to fully access information in this file. For assistance, please send e-mail to: mmwrq@cdc.gov. Type 508 Accommodation and the title of the report in the subject line of e-mail. How Many Illnesses Does One Emergency Department Visit Represent? Using a Population-Based Telephone Survey To Estimate the Syndromic MultiplierKristina B. Metzger, A. Hajat, M. Crawford, F. Mostashari
Corresponding author: Kristina B. Metzger, Bureau of Epidemiology Services, New York City Department of Health and Mental Hygiene, 125 Worth Street, Room 315, CN-6, New York, NY 10013. Telephone: 212-788-9309; Fax: 212-788-4473; E-mail: kmetzger@health.nyc.gov. AbstractIntroduction: Syndromic surveillance monitors trends in nonspecific health indicator data to detect disease outbreaks in a timely manner; however, only a limited percentage of persons with mild illness might exhibit behaviors that could be detected by syndromic surveillance. Objectives: The objectives of this study were to 1) examine the demographic characteristics of New Yorkers with recent flu-like or diarrheal illness, 2) describe behaviors associated with having flu-like illness, and 3) estimate the citywide burden for selected illnesses by calculating the syndromic multiplier (i.e., the number of citywide illnesses represented by each visit to an emergency department [ED]). Methods: A cross-sectional telephone survey of 2,433 adult residents of New York City (NYC) was conducted during March 19--March 31, 2003, and October 27--November 23, 2003. Respondents were asked about flu-like illness, behaviors related to flu-like illness, and diarrheal illness during the 30 days before the interview. Estimated numbers of citywide illnesses were compared with ED visits for flu-like and diarrheal illnesses that were recorded by the NYC syndromic surveillance system for the same periods. Results: Every ED visit for flu-like illness represented approximately 60 illnesses among city residents; every visit for diarrheal illness represented approximately 251 illnesses. Among adults who reported a recent flu-like illness, 53.2% purchased over-the-counter (OTC) medications; 32.6% reported missing school or work; 29.1% visited a physician; 21.4% called a physician for advice; 8.8% visited an ED; and 3.8% called a nurse or health hotline for advice. Of those who reported multiple behaviors, respondents most commonly reported purchasing OTC medications as their first response to a flu-like illness. Conclusions: Population-based survey data can be used in conjunction with syndromic surveillance data to better understand the relation between nonspecific health indicators and the burden of certain illnesses in the community, and to assess the representativeness of different syndromic data sources. IntroductionSyndromic surveillance systems are typically designed to detect increases in nonspecific health indicators that potentially signal the beginning of a disease outbreak, including an outbreak attributable to biologic terrorism. The data used by syndromic surveillance systems often represent behavioral indicators of early illness (e.g., pharmaceutical sales or employee absenteeism) and clinical indicators associated with more severe illness (e.g., emergency department (ED) visits or ambulance dispatches). Syndromic surveillance is particularly notable for its timeliness because it collects and analyzes these data daily. Because diseases caused by potentially threatening biologic agents often have prodromes that include fever, cough, shortness of breath, muscle aches, and general malaise (1), syndromic surveillance systems frequently examine nonspecific respiratory and constitutional symptoms, collectively referred to here as symptoms for flu-like illness.* However, only a limited percentage of persons with such symptoms might exhibit behaviors that syndromic surveillance systems could detect. For example, ED visits for flu-like illness are likely to represent a fraction of the total number of flu-like illnesses in the community because persons with milder forms of the illness might not seek treatment at an ED. Unlike in traditional disease surveillance systems, syndromic surveillance data are highly dependent on health-seeking or consumer behaviors. Better understanding of the actions people take when they become ill could highlight potential gaps in surveillance, identify promising data sources, and improve quantification of the magnitude of community-level illness corresponding to syndromic alerts. Such information is also crucial to the development of simulated disease-outbreak models. To better understand the relation between illness in the community and syndromic surveillance data regarding nonspecific health indicators, the New York City Department of Health and Mental Hygiene (DOHMH) applied information from a citywide survey on self-reported illnesses and behaviors to its syndromic surveillance system. During the spring and fall of 2003, DOHMH conducted a population-based survey to estimate citywide prevalence of chronic diseases and behavioral risk factors. The survey asked adult NYC residents about recent flu-like and diarrheal illnesses as well as about their health-seeking and consumer behaviors during flu-like illness. Prevalence estimates of behaviors during flu-like illness could provide an indication of the most frequent and timely sources of health-indicator data for use in syndromic surveillance in NYC. By combining information from the survey on the prevalence of illness with ED syndromic surveillance data, DOHMH was able estimate the syndromic multiplier --- the number of citywide illnesses represented by each ED visit. ObjectivesThe objectives of this study were to 1) examine the demographic characteristics of New Yorkers with recent flu-like or diarrheal illness, 2) describe health-seeking and consumer behaviors associated with flu-like illness, and 3) estimate the citywide burden of illness corresponding to syndromic surveillance ED visits by calculating the syndromic multiplier. MethodsCommunity Health SurveyTo assess annual trends in the health and health behaviors of New Yorkers, DOHMH conducts the New York City Community Health Survey (3), a citywide, cross-sectional telephone survey of 10,000 persons, modeled after the Behavioral Risk Factor Surveillance System (BRFSS) (4). The target population for the survey is noninstitutionalized NYC adults aged >18 years with telephones. A smaller, supplemental citywide survey, used to ask timely and seasonally related questions and to pilot test other questions for the larger survey, was administered twice in 2003, once in the spring and once in the fall. A total of 1,211 interviews were conducted during March 19--March 31, 2003, and 1,222 interviews were conducted during October 27--November 23, 2003. Interviews were conducted in English, Spanish, and Chinese. The minimum cooperation rate, using the definition provided by the American Association of Public Opinion Research (5), was 48% in the spring survey and 64% in the fall survey. The survey was a simple random sample; weights were applied to each observation such that the sum of the weights equaled the total adult population of NYC (N = 6,068,009, on the basis of the 2000 U.S. Census). During both the spring and fall surveys, respondents were asked the following question about recent flu-like illness: "In the last 30 days, did you have a flu-like illness with high fever, muscle aches, and cough or sore throat?" If respondents answered yes, they were then asked about different behaviors: "During this illness, did you a) purchase an over-the-counter (OTC) medication; b) miss work or school; c) call a doctor's office for advice; d) call a nurse or other health hotline; e) visit with your regular doctor; f) visit a hospital emergency room or urgent care center; g) visit a health-care facility other than your doctor or an emergency room?" Questions regarding behavior were asked in random order to minimize bias associated with respondent fatigue. In the fall survey, respondents who replied yes to >2 behavior-related questions were asked to specify which action they took first. In the spring survey, respondents were also asked whether they experienced recent diarrheal illness: "In the last 30 days, did you have diarrhea with at least three loose bowel movements within 24 hours?" Syndromic Surveillance DataAs part of the NYC syndromic surveillance system, data on ED visits, which include chief complaints, are transmitted daily to DOHMH from participating NYC hospitals (6). Each ED visit is categorized into one of several syndromes (i.e., respiratory, fever/influenza, diarrhea, vomiting, and asthma) on the basis of the free-text information contained within each chief complaint. Daily counts of ED visits for these syndromes are analyzed each day to detect citywide temporal increases or localized spatial clustering that might be indicative of a disease outbreak. For this analysis, ED visits by adults (aged >18 years) for the respiratory or fever/influenza syndromes were considered to be visits for flu-like illness. Visits included in the diarrhea syndrome category were considered to be visits for diarrheal illness. Estimation MethodsUsing the survey data, DOHMH estimated the prevalence of self-reported flu-like illness, behaviors associated with flu-like illness, and diarrheal illness during the 30 days before the survey interview. The relative standard error (RSE) was used as a criterion of precision, calculated by dividing each estimate by its standard error; estimates with RSE of >30% have low precision and stability. The estimated numbers of New Yorkers with flu-like and diarrheal illness were calculated by using the weighted prevalence estimates from the survey. Using the syndromic surveillance data, DOHMH summed the total counts of ED visits for flu-like and diarrheal illness over 30-day periods. Because the survey was administered over multiple weeks, 30-day weighted averages of ED visits were calculated by applying the percentage of respondents on each interview date to the corresponding count of ED visits for the previous 30 days. The approximate number of citywide illnesses represented by each ED visit in the syndromic surveillance system was obtained by dividing the estimated number of New Yorkers with illness during the previous 30 days by the 30-day weighted average of ED visits. The syndromic multiplier was then calculated by multiplying the above estimate by the citywide coverage of the syndromic surveillance system (e.g., the percentage of ED visits reported out of all ED visits in NYC). By using the standard errors of the survey prevalence estimates, DOHMH also calculated 95% confidence limits on the syndromic multiplier. SAS® version 8.2 (7) and SUDAAN® version 8 (8) were used to conduct the analyses. ResultsSurvey ResultsThe overall prevalence of adult New Yorkers who reported a flu-like illness during the previous 30 days was 19.6% (Table 1), which corresponds to approximately 2.4 flu-like illnesses/person/year. The prevalence of flu-like illness was slightly higher during the fall survey (20.8%) than during the spring survey (18.5%). The prevalence of adult New Yorkers who reported a diarrheal illness during the previous 30 days was 8.7%, which corresponds to approximately one diarrheal illness/person/year. Of all reported behaviors during a flu-like illness, respondents most frequently reported purchasing OTC medications (53.2%) (Table 2). Additionally, 32.6% reported missing work or school, 29.1% reported visiting a physician, and 21.4% reported calling a physician for advice. Respondents less frequently reported visiting an emergency department (8.8%) or calling a nurse or health hotline (3.8%). Only 18.5% of those with flu-like illness exhibited none of the health-seeking behaviors asked about in the survey. Adults aged 18--64 years were significantly more likely to report a recent flu-like illness (22.0%) than adults aged >65 years (6.3%; p<0.001). Older adults reported calling a physician or visiting an ED during a flu-like illness more often than did younger adults, although those differences were not significant. No difference in prevalence of reported diarrheal illness by age group was observed. Females were slightly more likely than males to report both recent flu-like illness (21.4% and 17.6%, respectively; p = 0.05) and diarrheal illness (10.1% and 7.2%, respectively; p = 0.09). Although Hispanics were significantly more likely to report flu-like illness (25.8%) than whites (16.0%; p<0.001), limited differences were observed among the racial/ethic groups regarding behaviors during a flu-like illness. The prevalence of flu-like illness was similar across education level. However, persons with less than a high school education were significantly less likely to miss work or school because of this illness (16.3%) than were those with more than a high school education (35.2%; p<0.001). A higher prevalence of respondents without any health insurance reported flu-like illness (26.7%) than those with health insurance (18.0%; p = 0.002), but fewer reported calling a physician, visiting a physician, or visiting an ED because of this illness. Of those who reported flu-like illness during the previous 30 days, 50.7% reported carrying out >2 of the health-seeking or consumer behaviors examined by the survey. Of these, 36.6% of respondents reported purchasing OTC medications first, before carrying out any other behavior (Table 3). An additional 30.3% of respondents reported first missing work or school. The next most common initial behaviors were visiting a physician (16.2%) and calling a physician for advice (11.8%). Only 3.3% of respondents reported first visiting the ED before any other behavior. The least common first behavior was calling a nurse or other health hotline (0.7%). Calculating the Syndromic MultiplierApproximately three-quarters of all ED visits in NYC are captured by the city's syndromic surveillance system. In February and March 2003, a total of 39 hospitals provided daily ED data to the system, representing 58% of hospitals and 74% of ED visits in NYC. In October and November 2003, a total of 40 hospitals (60% of hospitals, 76% of visits) provided daily ED data. The mean (standard deviation) daily counts of adult visits were 476 (70) for flu-like illness and 46 (12) for diarrheal illness. Flu-like illness accounted for 9% of all ED visits; diarrheal illness accounted for <1% of all visits. The daily counts of ED visits for flu-like and diarrheal illness during September 1, 2002--November 30, 2003 are provided (Figure). By calculating the syndromic multiplier, DOHMH estimated that each ED visit represented 60.0 flu-like illnesses among adult New Yorkers, including 76.5 illnesses among those aged 18--64 years and 11.1 illnesses among those aged >65 years (Table 4). For diarrheal illness, each ED visited was estimated to represent approximately 250.6 illnesses among adults citywide. DiscussionUnderstanding the frequency and timing of health behaviors during illness provides valuable context for syndromic surveillance and can help guide development of simulated disease-outbreak models. The prevalence estimates of flu-like and diarrheal illnesses determined by this population-based survey of adult NYC residents are similar to those from other population-based surveys of communitywide flu-like illness (9) and diarrheal illness (10,11). By using these prevalence estimates, DOHMH was able to estimate the syndromic multiplier --- the number of citywide illnesses that each ED visit represents. Although OTC medication purchases and absenteeism appear to be two of the more frequent and timely health behaviors during flu-like illness, the lack of specificity and the variability caused nonhealth-related events (e.g., promotions influencing OTC medication purchases, or reasons for absenteeism other than illness) might reduce the suitability of these data sources for timely outbreak detection. The survey results also indicate that outpatient physician encounters were considerably more frequent and timely than ED visits. Where available, data on outpatient physician encounters might offer a degree of disease specificity and an ability to investigate signals equal to or greater than the more commonly monitored ED chief-complaint data. Population-based surveys can help identify gaps in current syndromic surveillance systems. For example, this survey determined that persons without health insurance were more likely to report recent illness but less likely to seek care. Including data from outpatient sites that provide health care to medically indigent and uninsured persons might improve the representativeness of syndromic surveillance data. Because the survey relied on self-reports, the data might suffer from bias caused by inexact recall of the timing of recent flu-like illnesses and resulting behaviors. Respondents might have reported illnesses and behaviors that occurred >30 days before the survey; this type of recall bias is often encountered in surveys eliciting temporal-based information (12). As a result, the self-reported 19.6% with a recent flu-like illness and subsequent 8.8% who visited an ED might represent overestimates of the illness' true prevalence. In addition, the syndromic surveillance case definition for flu-like illness is unlikely to identify all ED visits for flu-like illness. Previous studies have determined that the sensitivity of ED chief-complaint data ranges from 44% when medical chart review is used as the standard (13) to 81% when discharge diagnosis is used as the standard (14). However, visits for other reasons are unlikely to be misclassified as visits for flu-like illness; the specificity of chief-complaint data in the two studies were 97% and 95%, respectively. Consequently, this study's calculation of 60 citywide illnesses/ED visit for flu-like illness might overestimate the true ratio. These surveys were conducted during periods without any known outbreaks of influenza or gastrointestinal illness. A primary objective of syndromic surveillance is to detect abnormal increases in behaviors associated with flu-like illness not necessarily attributable to influenza (e.g., to detect events of biologic terrorism). However, these estimates of citywide illness might change during an outbreak if severity of illness alters the pattern of health-seeking behaviors. ConclusionsBy combining data from a citywide survey with syndromic surveillance data, DOHMH was able to use the syndromic multiplier to estimate the number of illnesses in the community represented by each ED visit. Survey responses regarding the actions persons take during a flu-like illness provided important information about health-seeking behaviors and about the representativeness of different data sources used in syndromic surveillance. References
* Use of flu-like illness in this paper is not synonymous with the CDC case definition for influenza-like illness, which is defined as fever >100°F and cough or sore throat (2). Table 1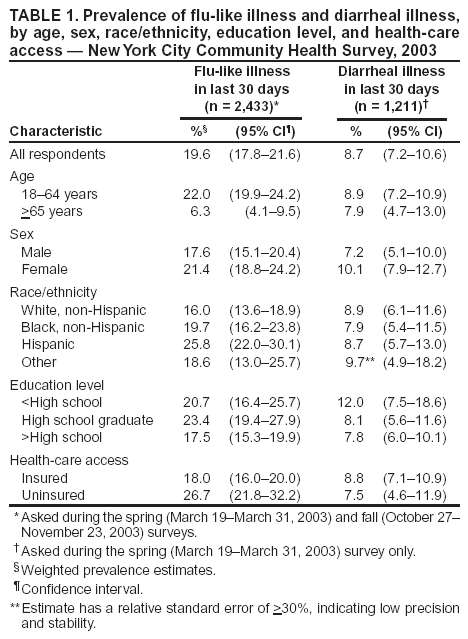 Return to top. Table 2 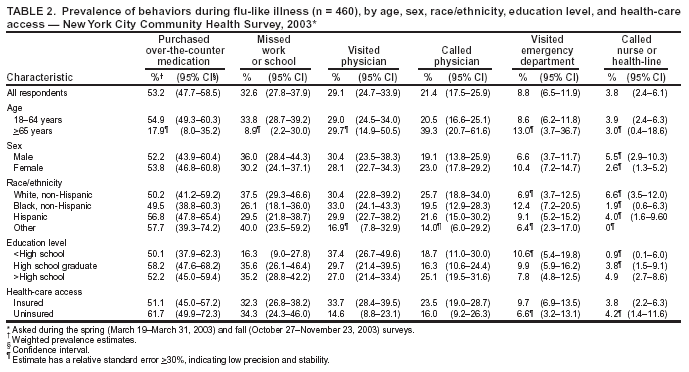 Return to top. Table 3 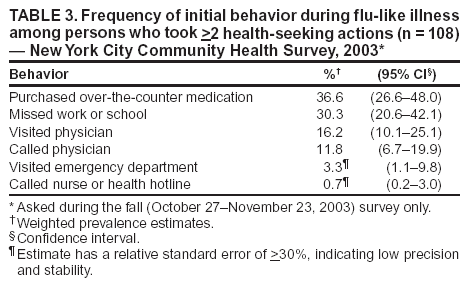 Return to top. Table 4 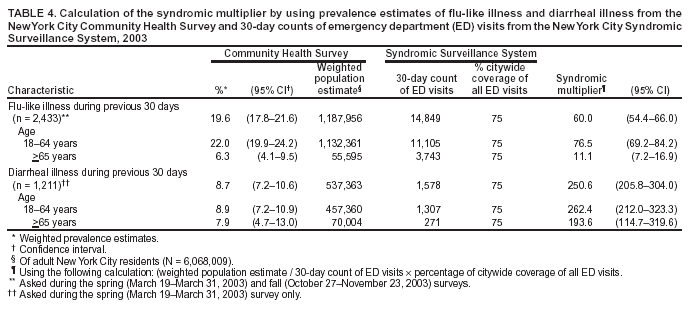 Return to top. Figure 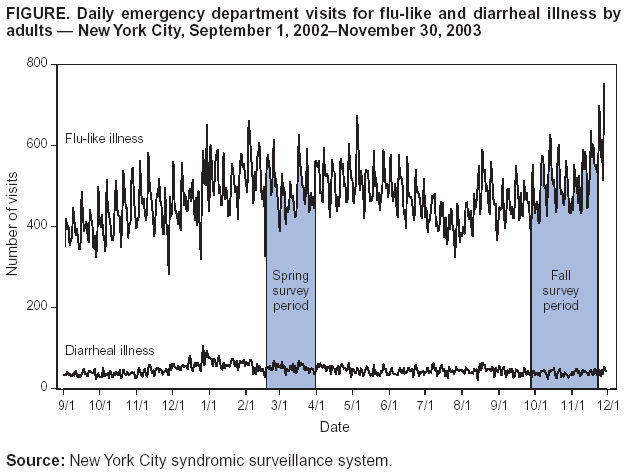 Return to top.
Disclaimer All MMWR HTML versions of articles are electronic conversions from ASCII text into HTML. This conversion may have resulted in character translation or format errors in the HTML version. Users should not rely on this HTML document, but are referred to the electronic PDF version and/or the original MMWR paper copy for the official text, figures, and tables. An original paper copy of this issue can be obtained from the Superintendent of Documents, U.S. Government Printing Office (GPO), Washington, DC 20402-9371; telephone: (202) 512-1800. Contact GPO for current prices. **Questions or messages regarding errors in formatting should be addressed to mmwrq@cdc.gov.Page converted: 9/14/2004 |
|||||||||
This page last reviewed 9/14/2004
|