Skip Navigation LinksSkip Navigation Links
Centers for Disease Control and Prevention
Safer Healthier People
Blue White
Blue White
bottom curve
CDC Home Search Health Topics A-Z spacer spacer
spacer
Blue curve MMWR spacer
spacer
spacer


Persons using assistive technology might not be able to fully access information in this file. For assistance, please send e-mail to: mmwrq@cdc.gov. Type 508 Accommodation and the title of the report in the subject line of e-mail.

Abortion Surveillance --- United States, 2006

Please note: An erratum has been published for this article. To view the erratum, please click here.

Karen Pazol, PhD

Sonya B. Gamble, MS

Wilda Y. Parker

Douglas A. Cook, MBIS

Suzanne B. Zane, DVM

Saeed Hamdan, MD, PhD

Division of Reproductive Health

National Center for Chronic Disease Prevention and Health Promotion, CDC

Corresponding address: CDC/National Center for Chronic Disease Prevention and Health Promotion/Division of Reproductive Health, 1600 Clifton Rd., NE, MS K-21, Atlanta, GA 30333. E-mail: cdcinfo@cdc.gov.

Abstract

Problem/Condition: Since 1969, CDC has conducted abortion surveillance to document the number and characteristics of women obtaining legal induced abortions in the United States.

Reporting Period Covered: 2006.

Description of System: Each year, CDC requests abortion data from the central health agencies of 52 reporting areas (the 50 states, New York City, and the District of Columbia); these data are provided to CDC voluntarily. In 2006, data were received from 49 reporting areas. For the purpose of trend analysis, data were evaluated from the 46 areas that reported data every year during 1996--2006.

Results: For 2006, a total of 846,181 abortions were reported to CDC. Among the 46 areas that provided data consistently during 1996--2006, a total of 835,134 abortions (98.7% of the total) were reported; the abortion rate was 16.1 abortions per 1,000 women aged 15--44 years, and the abortion ratio was 236 abortions per 1,000 live births. During the previous decade (1997--2006), reported abortion numbers, rates, and ratios decreased 5.7%, 8.8%, and 14.8%, respectively; most of these declines occurred before 2001. During the previous year (2005--2006), the total number of abortions increased 3.1%, and the abortion rate increased 3.2%; the abortion ratio was stable.

In 2006, as during the previous decade (1997--2006), women aged 20--29 years accounted for the majority (56.8%) of abortions and had the highest abortion rates (29.9 abortions per 1,000 women aged 20--24 years and 22.2 abortions per 1,000 women aged 25--29 years); by contrast, abortion ratios were highest at the extremes of reproductive age. Adolescents aged 15--19 years accounted for 16.5% of all abortions in 2006 and had an abortion rate of 14.8 abortions per 1,000 adolescents aged 15--19 years; women aged ≥35 years accounted for a smaller percentage (12.1%) of abortions and had lower abortion rates (7.8 abortions per 1,000 women aged 35--39 years and 2.6 abortions per 1,000 women aged ≥40 years). During 1997--2006, the percentage of abortions and the abortion rate increased among women aged ≥35 years but declined among adolescents aged ≤19 years and among women aged 20--29 years.

The majority (62.0%) of abortions in 2006 were performed at ≤8 weeks' gestation; few abortions were performed at 16--20 weeks' gestation (3.7%) or at ≥21 weeks' gestation (1.3%). During 1997--2006, the percentage of abortions performed at ≤8 weeks' gestation increased 11.7%; this increase largely was accounted for by procedures performed at ≤6 weeks' gestation, which increased 66.3%. In 2006, the greatest percentage (87.6%) of abortions were performed by curettage (including vacuum aspiration, sharp curettage, and dilation and evacuation procedures), followed by medical (nonsurgical) abortion (10.6%).

Deaths of women associated with complications from abortions for 2006 are being investigated under CDC's Pregnancy Mortality Surveillance System. In 2005, the most recent year for which data were available, seven women were reported to have died as a result of complications from known legal induced abortions. No reported deaths were associated with known illegal induced abortions.

Interpretation: Among the 46 areas that reported data consistently during 1996--2006, decreases in the total reported number, rate, and ratio of abortions were attributable primarily to reductions before 2001. During 2005--2006, the total number and rate of abortions increased. In 2005, as in the previous years, reported deaths related to abortions occurred only rarely.

Public Health Action: Abortion surveillance in the United States continues to provide the data needed to examine trends in the number and characteristics of women obtaining abortions. Policymakers and program planners can use these data to guide and evaluate efforts to prevent unintended pregnancies.

Introduction

This report is based on abortion data for 2006 provided voluntarily by the central health agencies of 52 reporting areas (the 50 states, the District of Columbia, and New York City) to CDC's National Center for Chronic Disease Prevention and Health Promotion, Division of Reproductive Health. Since 1969, CDC has conducted abortion surveillance to document the number and characteristics of women obtaining legal induced abortions in the United States (1). Following nationwide legalization of abortion in 1973, the total reported number, rate (the number of abortions per 1,000 women aged 15--44 years), and ratio (the number of abortions per 1,000 live births) of abortions increased rapidly, reaching their highest levels in the 1980s. These three measures of abortion subsequently have declined at a slow but steady pace, but with considerable variation across demographic populations (2,3). Continued surveillance is needed to monitor potential changes in the overall incidence of abortion procedures and to guide and evaluate programs for preventing unintended pregnancy in the United States.

Methods

Description of the Surveillance System

CDC requests tabulated data annually from 52 reporting areas (the 50 states, the District of Columbia, and New York City) to document the number and characteristics of women obtaining abortions in the United States. CDC requests data exclusively from the central health agency of each reporting area; before 1998, when CDC was unable to obtain abortion numbers from a central agency, information was requested from the hospitals and other facilities performing abortions in that agency's reporting area.* For the purpose of surveillance, a legal induced abortion is defined as a procedure performed by a licensed physician or by an appropriately licensed advanced practice clinician acting under the supervision of a licensed physician that is intended to terminate a suspected or known intrauterine pregnancy and produce a nonviable fetus at any gestational age (4). Collection of abortion data is facilitated in most states by the legal requirement for hospitals, facilities, and physicians to report abortions to a central health agency. However, the reporting areas provide this information to CDC on a voluntary basis (5,6). Since 1996, a total of 46 reporting areas have provided a continuous annual record of abortion numbers.§ However, the number of reporting areas providing data on the characteristics of women obtaining abortions and the completeness of the information provided has varied from year to year. For abortions performed in 2006, CDC obtained information from 49 reporting areas (excludes California, Louisiana, and New Hampshire).

Variables Recorded

Each year, CDC's Division of Reproductive Health sends suggested templates to central health agencies for them to compile aggregate abortion numbers according to the age of the woman having an abortion, the estimated gestational age at the time of the procedure, race (white, black, or other), ethnicity (Hispanic or non-Hispanic), type of procedure performed (e.g., curettage or medical), marital status, number of previous live births, number of previous abortions, and state of residence. Cross-tabulation also is requested by gestational age at the time of the procedure (for age, race, ethnicity, and type of procedure), age (for race and ethnicity), and age and race or ethnicity (for marital status). These variables are based on the information included on the standard reporting form developed by CDC's National Center for Health Statistics (NCHS) for the reporting areas to use to collect information on individual women (7). However, because no federal mandate exists that requires reporting areas to provide abortion data to CDC, many areas do not use this suggested reporting form and might not have all the information CDC requests on the characteristics of women obtaining abortions.

To comply with federal standards for the collection of data on race and ethnicity (8), CDC provides alternative data templates for cross-tabulation of aggregate numbers on race and ethnicity and for the addition of certain other racial categories (Asian, Native Hawaiian/Pacific Islander, and American Indian/Alaska Native). Only six reporting areas provided information cross-classified by race and ethnicity, accounting for a total of 8.7% of abortions reported in 2006; among these six areas, data were incomplete (27.1% of cases were returned with unknown values). Consequently, race and ethnicity are presented in this report as separate variables.

Measures of Abortion

Four measures of abortion are presented in this report: 1) the total number of abortions in a given population, 2) the percentage of abortions obtained within a given subpopulation, 3) the abortion rate (i.e., the number of abortions per 1,000 women aged 15--44 years within a given population), and 4) the abortion ratio (i.e., the number of abortions per 1,000 live births within a given population). The total number and percentage of abortions are useful measures for determining the total number of women affected. Abortion rates control for differences in subpopulation size and reflect how likely abortion is within certain populations. Abortion ratios reflect the relative number of pregnancies in a population that end in abortion compared with live births. For the calculation of abortion ratios, data from state health departments were used in surveillance summaries for 1973--1995 to document the number of live births recorded in each reporting area. Starting with the report for 1996, this information has been obtained from NCHS (9). For the calculation of abortion rates, the number of women residing in each reporting area was obtained from U.S. Census Bureau postcensual data (10). Overall abortion rates for women of all ages were calculated from the population of women aged 15--44 years. However, because 94.0% of abortions among adolescents aged <15 years occurred among adolescents aged 13--14 years (as measured in 1988, the last year that NCHS enumerated abortions for this age group) (11), the population of adolescents aged 13--14 years was used as the denominator for this youngest group. Similarly, for women aged ≥40 years, abortion rates were based on the number of women aged 40--44 years.

Data Analysis

This report provides state-specific and overall abortion statistics for 49 reporting areas (excludes California, Louisiana, and New Hampshire). For all 49 areas, state-specific data are reported for 2006. In addition, for the 46 areas that have have provided data for every year since 1996, trends are presented for the entire period during 1996--2006 or for the previous year (2005--2006) and the previous decade (1997--2006)

Although the total number of abortions performed in 2006 was available from 49 reporting areas, the completeness of reporting varied by characteristics and reporting areas. This report describes the characteristics of women from the reporting areas that submitted adequate data (i.e., data categorized in accordance with surveillance variables and with <15% unknown values for a given characteristic). Percentages reported in the text and figures are based on known values; unknown values have been retained in the tables for completeness of reporting. If fewer than five women in a given category obtained an abortion, this value was not displayed in the individual table cells or added to the column totals. However, these small numbers were included in the calculation of summary measures (percentage of total abortions, abortion rates, and abortion ratios).

Most of the data in this report are presented by the state or area in which abortions were performed. In addition, 47 reporting areas also provided the number of abortions by the state or reporting area in which women resided. However, four states (Delaware, Illinois, Maryland, and Wisconsin) reported characteristics for in-state residents but not for out-of-state residents. Four other states (Alaska, Arizona, Iowa, and Massachusetts) provided only the total number of abortions for out-of-state residents, without specifying individual states or areas of residence. As a result, abortion statistics presented in this report by area of residence must be viewed as minimum estimates and might be disproportionately low for areas in which many women travel to obtain abortions in states with incomplete residence reporting.

For the purpose of evaluating trends, linear regression analysis was used to assess the rate of change in overall abortion numbers, rates, and ratios in the United States during 1996--2006. Reporting areas were included in this analysis only if they provided complete data every year during 1996--2006. In addition, the percentage change in abortion statistics was determined for the previous year (2005--2006) and the previous decade (1997--2006). For variables that have been presented only as the percentage of total abortions (procedure type, gestational age, marital status, number of prior abortions, and number of previous births), reporting areas were included in the analysis if they provided complete data for 1997, 2005, and 2006. Summary measures for the subset of areas that reported for all 3 years are presented in the text and might differ from the numbers presented in the tables for all 49 areas that reported for 2006. For variables that have been presented with associated rates and ratios (abortions among all women and abortions by age, race, and ethnicity), data are displayed annually, and reporting areas were included in the analysis only if they provided data every year during 1997--2006; summary measures for these areas are presented in separate tables from the data for all 49 areas that reported for 2006.

Abortion Mortality

CDC has reported data on abortion-related deaths periodically since information on abortion mortality first was included in the 1972 abortion surveillance report (3,12). An abortion-related death is defined as a death resulting from a direct complication of an abortion (legal or illegal), an indirect complication caused by a chain of events initiated by an abortion, or aggravation of a preexisting condition by the physiologic or psychologic effects of abortion (13). An abortion is defined as "legal" if it was performed by a licensed physician or an appropriately licensed advanced practice clinician acting under the supervision of a licensed physician; an abortion is defined as "illegal" if it was performed by any other person. All deaths determined to be related causally to abortion have been classified as abortion-related regardless of the time between the abortion and death.

Since 1987, CDC has monitored abortion-related deaths through its Pregnancy Mortality Surveillance System (PMSS) (14). Additional sources of data for abortion-related deaths include state vital records, maternal mortality review committees, surveys, private citizens and groups, media reports, health-care providers, medical examiners' reports, public health agencies and computerized searches of full-text newspaper/print media databases. For each death that possibly is related to abortion, CDC requests clinical records and autopsy reports. Two clinically experienced medical epidemiologists review these reports to determine the cause of death and whether the death was abortion-related. Each abortion-related death then is categorized by abortion type as legal induced, illegal induced, spontaneous, or unknown type. This report provides data on abortion-related deaths that occurred during 1972--2005; data for 2005 have not been published previously and are the most recent data available. Possible abortion-related deaths that occurred during 2006--2008 are under investigation. Although national case-fatality rates (the number of abortion-related deaths per 100,000 reported legal induced abortions) have been published for 1972--1997, this measure could not be calculated for 1998--2005 with CDC data; a substantial number of abortions have been documented in states that did not report abortion data to CDC (2,15), and thus the total number of abortions was not available as the denominator.

Results

U.S. Totals

Among the 49 areas that provided data for 2006, a total of 846,181 abortions were reported. For the 46 areas that provided data every year during 1996--2006 (excludes Alaska, California, Louisiana, New Hampshire, Oklahoma, and West Virginia), 835,134 abortions (98.7% of the total) were reported; among these 46 consistently reporting areas, the abortion rate was 16.1 abortions per 1,000 women aged 15--44 years, and the abortion ratio was 236 abortions per 1,000 live births (Table 1). During the previous decade (1997--2006), the total number, rate, and ratio of reported abortions declined 5.7%, 8.8%, and 14.8%, respectively. By contrast, during the previous year (2005--2006), the total number of abortions increased 3.1%, and the abortion rate increased 3.2%; the abortion ratio remained stable.

Regression analysis also indicated a general decline during 1996--2006 in abortion numbers, rates, and ratios (Figure 1), but most of this change is attributable to reductions that occurred during 1996--2000. On average during 1996--2000, the number of abortions decreased 20,605 per year, the abortion rate decreased 0.5 abortions per 1,000 women per year, and the abortion ratio decreased 9.7 abortions per 1,000 live births per year. Reductions were much smaller on average during 2001--2006; the number of abortions declined 2,163 per year, the abortion rate declined 0.1 per year, and the abortion ratio declined 3.3 per year.

Occurrence and Residence

Total abortion numbers, rates, and ratios have been tabulated by individual reporting area of occurrence and the residence status of the women who obtained the procedures (Table 2). By area of occurrence, a considerable range existed in the total number of reported abortions (range: seven [Wyoming]--90,157 [New York City]), the rate of abortions (range: 4.2 [Idaho]--48.5 [New York City]),** and the abortion ratio (range: 52 [Idaho]--752 [New York City]).†† Similarly, a considerable range existed by residence status in the total number of reported abortions (range: 275 [Wyoming]--83,220 [New York City]), the rate of abortions (range: 2.7 [Wyoming]--44.7 [New York City]), and the abortion ratio (range: 36 [Wyoming]--694 [New York City]). Given the substantial variation across reporting areas that also occurred in the percentage of abortions obtained by out-of-state residents (range: none [Wyoming]--54.3% [District of Columbia]), abortion rates and ratios calculated by residence status might provide a more accurate reflection of population trends. However, these measures must be viewed with caution because of the variation across reporting areas in methods used to record residence status.

Age

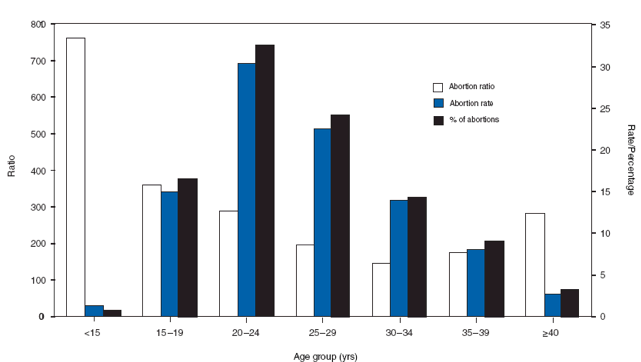
Among women from the 48 areas for which age was reported for 2006, women aged 20--29 years accounted for 417,402 (56.8%) of the 735,187 abortions (excludes 6,063 abortions for women of unknown age) reported by age (Figure 2; Table 3). Women in this age group also had the highest abortion rates (29.9 and 22.2 abortions per 1,000 women aged 20--24 and 25--29 years, respectively). Women at the youngest and oldest age extremes (<15 or ≥40 years) accounted for the smallest percentage of abortions (0.5% and 3.2%, respectively) and had the lowest abortion rates (1.2 and 2.6 abortions per 1,000 women aged <15 and ≥40 years, respectively). This pattern across age groups was stable during the previous decade (1997--2006) among the 44 reporting areas that provided data every year (Table 4). Nonetheless, during 1997--2006, the percentage of overall abortions accounted for by adolescents aged <15--19 years declined (from 20.0% to 17.0%) whereas the percentage among women aged ≥35 years increased (from 10.8% to 12.1%). In addition, although abortion rates declined steadily during 1997--2006 among all women aged ≤29 years, abortion rates in were slightly higher in 2006 than in 2005 for adolescents aged ≥15 years and for women aged 20--29 years (Table 4).

In contrast to abortion rates, abortion ratios for 2006 were highest at the extremes of reproductive age (Figure 2; Table 3). During 1997--2006, abortion ratios declined for all women except adolescents aged <15 years; however, abortion ratios were slightly higher in 2006 than in 2005 for women aged 25--39 years (Table 4).

Adolescents

Among the 46 areas for which age was reported by individual year for 2006, adolescents aged ≤19 years accounted for 116,613 abortions (Table 5). The adolescent abortion rate was 11.0 per 1,000 adolescents, and the adolescent abortion ratio was 358 abortions per 1,000 live births. Adolescents aged 18--19 years accounted for 62.0% of adolescent abortions and had the highest adolescent abortion rates (22.1 and 26.8 abortions per 1,000 adolescents aged 18 and 19 years, respectively). Adolescents aged <15 years accounted for the smallest percentage of adolescent abortions (3.0%) and had the lowest adolescent abortion rate (1.2 abortions per 1,000 adolescents). Among the 41 areas that reported data continuously during the previous decade (1997--2006), this pattern across age groups was similar for each year (Table 6). Although abortion rates among adolescents of all ages declined steadily during 1997--2006, this decline did not continue during 2005--2006 for adolescents aged ≥16 years (Table 6).

Abortion ratios among adolescents generally declined with age and were lowest (310 abortions per 1,000 births) among adolescents aged 19 years (Table 5). Among the 41 reporting areas that provided data for every year during 1997--2006, relative values across age groups again were stable; however, the difference between younger and older adolescents increased, with a comparatively large decline among adolescents aged 18--19 years (Table 6).

Gestational Age

Among women from the 43 areas for which gestational age at abortion was reported for 2006 (Table 7), the majority (62.0%) of abortions were obtained at ≤8 weeks' gestation; only 5.0% of abortions were obtained at ≥16 weeks' gestation (3.7% at 16--20 weeks and 1.3% at ≥21 weeks). Among the 38 reporting areas that provided data for 1997, 2005, and 2006,§§ the percentage of abortions obtained at ≤8 weeks' gestation increased 11.7% (from 55.5% in 1997 to 62.0% in 2006). The percentage of abortions obtained at ≥16 weeks was relatively stable (5.7%, 5.2%, and 5.0% of all abortions in 1997, 2005, and 2006, respectively).

Among women who obtained an abortion in 2006 in the 41 areas that provided the exact week of gestation, 29.6%, 18.2%, and 14.3% obtained their procedure at ≤6, 7, and 8 weeks, respectively (Table 8). Among the 36 areas that provided data in 1997, 2005, and 2006,¶¶ the percentage of abortions obtained at ≤6 weeks' gestation increased 66.3% (from 17.7% of all abortions in 1997 to 29.4% in 2006), resulting in a shift in the gestational age for abortions obtained at ≤8 weeks toward the lower end of the distribution (≤6 weeks gestation).

Method Type

Among the 45 areas for which procedure type was reported for 2006, curettage (including vacuum aspiration, sharp curettage, and dilation and evacuation procedures) accounted for 87.6% of abortions (Table 9); medical (nonsurgical) abortion accounted for 10.6%, and all other methods were uncommon. Among the 39 reporting areas that provided data in 1997, 2005, and 2006,*** curettage declined 11.2% (from 98.2% of all procedures in 1997 to 87.2% in 2006). Most of this decline was accounted for by an increase in the number of medical abortions. Among the 39 areas that provided information on procedure type in 1997, 2005, and 2006, medical abortions accounted for 0.4% of all procedures in 1997, compared with 11.1% in 2006. All other methods accounted for a consistently small percentage of abortions (0.4%--1.7%).

Race

Among women from the 39 areas for which race was reported for 2006, white women (including both Hispanic and non-Hispanic white women) accounted for the largest percentage (55.8%) of abortions; black women accounted for 36.4% and women of other racial groups for 7.8% (Table 10). Black women had higher abortion rates and ratios than white women and women of other races (Table 10). Among the 29 reporting areas that provided data every year during 1997--2006, the percentage of abortions by race changed little; abortions by women in the "other" racial category increased, but the percentage remained low (5.8%--7.7%) (Table 11). Among women from all racial groups, abortion rates and ratios generally declined during 1997--2006, but the abortion rate was higher in 2006 than in 2005; for black women, the abortion ratio was lower in 2006 than in 2005, whereas for white women and women in the "other" racial category, this measure was relatively stable during 2005--2006 (Table 11).

Ethnicity

Among women from the 31 areas for which ethnicity was reported for 2006, Hispanic and non-Hispanic women accounted for 20.1% and 79.9%, respectively, of all abortions (Table 12). Abortion rates were higher among Hispanic women than among non-Hispanic women (21.1 compared with 14.1 abortions per 1,000 women aged 15--44 years, respectively), but abortion ratios among the two ethnic groups were similar (200 and 224 abortions per 1,000 live births, respectively). Among the 19 reporting areas that provided data every year during 1997--2006, the percentage of abortions accounted for by Hispanic women increased 23.6%, whereas the percentage among non-Hispanic women decreased 4.8% (Table 13). In both ethnic groups, abortion rates and ratios generally declined during 1997--2006, but during 2005--2006, abortion rates increased and abortion ratios remained essentially unchanged (Table 13).

Marital Status

Among the 43 areas for which marital status was reported for 2006, 83.5% of all women obtaining abortions were unmarried (Table 14). For the 37 reporting areas that provided data in 1997, 2005, and 2006,††† unmarried women accounted for a slightly higher percentage of abortions in 2006 (83.7%) than in 1997 (81.0%); the percentage was essentially unchanged from 2005 (83.2%).

Previous Live Births and Abortions

Among the 41 areas for which the number of previous live births was reported for 2006, 41.3%, 26.4%, and 32.2% of all women had previously had zero, one, or two or more live births, respectively (Table 15). Among the 36 reporting areas that provided data in 1997, 2005, and 2006,§§§ the change in the distribution of women obtaining abortions by the number of previous live births was minimal (CDC, unpublished data, 2009).

Among the 41 areas for which the number of previous abortions was reported for 2006, the majority of women (55.2%) had not previously had an abortion; 25.5% and 19.2%, respectively, had previously had either one or two or more abortions (Table 16). Among the 34 reporting areas that provided data in 1997, 2005, and 2006,¶¶¶ the change in the distribution of women obtaining abortions by the number of previous abortions was minimal (CDC, unpublished data, 2009).

Age and Marital Status by Race and Ethnicity

In some reporting areas, women of each racial and ethnic category were classified further by age and marital status (Tables 17 and 18). By age, a consistent pattern existed across all racial and ethnic populations: the smallest percentage of abortions (0.4%--0.7%) occurred among adolescents aged <15 years and the largest (29.0%--33.8%) among women aged 20--24 years. By marital status, a consistent pattern also existed across all racial and ethnic populations, with a much higher percentage of abortions occurring among women who were unmarried (68.1%--89.4%) compared with those who were married (10.6%--31.9%).

Weeks of Gestation by Age, Race, Ethnicity, and Type of Procedure

In some reporting areas, women who obtained abortions at different gestational ages also were categorized further by age, race, and ethnicity (Tables 19 and 20). In every subgroup for these three variables, the highest percentage of abortions were obtained at ≤8 weeks' gestation. However, although 42.2% of adolescents aged <15 years and 51.9% adolescents aged 15--19 years obtained an abortion by ≤8 weeks' gestation, 60.5%--69.3% of adult women aged ≥20 years obtained an abortion by this time (Figure 3; Table 19).

For women from the 39 areas for which procedure type was categorized further by week of gestation, at every stage of pregnancy, curettage (including vacuum aspiration, sharp curettage, and dilation and evacuation procedures) accounted for >80% of abortions (Table 21). The smallest percentage of procedures performed by curettage was observed at ≤8 weeks' gestation (82.6%) because of the comparatively high percentage of medical abortions performed at this time (15.9%).

Abortion Mortality

From national PMSS data (14), CDC identified nine deaths for 2005 that were potentially related to abortion. These deaths were identified either by some indication of abortion on the death certificate, by a report from a health-care provider, or from information such as a news or public health report associated with the death. Investigation of these cases indicated that seven of the nine deaths were related to legal abortion and none to illegal abortion (Table 22). Six of the legal abortion--related deaths occurred after a surgical procedure, and one occurred after a medical (nonsurgical) procedure. Two deaths ultimately were determined to be unrelated to the pregnancy and the abortion procedure and hence were not abortion-related by PMSS criteria. Possible abortion-related deaths that occurred during 2006--2008 are under investigation.

Discussion

For 2006, a total of 846,181 abortions were reported in the United States. Among the 46 areas that provided data for every year during 1996--2006, a total of 835,134 abortions were reported. These same 46 areas reported an abortion rate of 16.1 abortions per 1,000 women aged 15--44 years, and an abortion ratio of 236 abortions per 1,000 live births. Compared with 2005, this represents a 3.1% increase in the total number of abortions and a 3.2% increase in the abortion rate. Although this increase in the total number and rate of abortions was the largest observed during the previous decade (1997--2006), the number of live births in the United States and the fertility rate (live births per 1,000 women aged 15--44 years) also increased 3% in 2006, constituting the largest single-year increase in more than 15 years (9). For this reason, the increase in the total number and rate of abortions for 2006 might reflect a general increase in the number of pregnancies of all outcomes (fetal losses, induced abortions, and live births). The stable abortion ratio suggests that this might be the case, but accumulation of surveillance data in subsequent years will be needed to determine whether the 2006 increase in abortions continues without an accompanying increase in fertility.

The increase in the total number and rate of abortions also follows a slowing rate of decline in the incidence of abortion. For the 46 reporting areas that provided a continuous annual record, abortion numbers, rates, and ratios were 5.7%, 8.8%, and 14.8% lower, respectively, for 2006 compared with 1997. However, most of these declines occurred before 2001; by 2000, the rate of decline for all three measures of abortion already had plateaued, and reductions after this time were minimal. A shift over the previous decade in the incidence of abortion might reflect multiple factors, including a decline in the availability of abortion providers (15--18); the adoption of state regulations, including mandatory waiting periods and parental involvement laws (19,20); increasing acceptance of nonmarital childbearing (21,22); and the failure to sustain past reductions in unintended pregnancy associated with improvements in the use of contraception (23--29).

In addition to overall population changes, the findings in this report indicate important age differences in abortion trends. Because women aged 20--29 years had the majority of abortions (>55%) during 1997--2006, they accounted for most of the overall changes in abortion rates. Conversely, women aged ≥35 years accounted for only a small percentage of abortions, but their abortion rates increased slowly over this entire period. This slow but persistent increase suggests that unintended pregnancy might be observed increasingly among older women as they delay childbearing and continue to use reversible contraceptive methods to retain their fertility options (2,26). Finally, this report provides data on adolescent abortion trends that will be important for evaluating recent changes in adolescent pregnancy and births. Although adolescent pregnancy and birth rates declined by approximately one third during 1991--2005 (30,31), adolescent birth rates increased 5.0% during 2005--2007, with most of this change occurring during 2005--2006 (9,32). A notable finding of this report is that adolescent abortion rates also increased during 2005--2006 after several years of decline. These concurrent trends suggest that the recent increase in adolescent births can be attributed to an increase in adolescent pregnancies rather than a simple shift in the percentage of pregnancies resulting in live births. However, the findings in this report also suggest that some of the increase in adolescent births might be attributable to an increasing tendency for adolescents to continue their pregnancies. The increase in adolescent birth rates exceeded the increase in adolescent abortion rates for 2006.**** In addition, in contrast to adolescent abortion rates, adolescent abortion ratios continued to decline during 2005--2006. Ongoing surveillance is needed to evaluate these trends fully.

The findings in this report on race and ethnicity reflect disparities in abortion that have been well-documented and observed for many years (2,3,31,33,34). Comparatively high abortion rates and ratios among black women have been attributed to high unintended pregnancy rates and a high percentage of unintended pregnancies ending in abortion (23). This report indicates that abortion rates and ratios declined during 1997--2006 among women of all racial groups. However, although the decline in abortion ratios among black women continued during 2005--2006, this decline was not observed among women of other races. Data from subsequent years will be needed to assess whether this is a sustained trend.

The findings provided in this report also suggest that the percentage of abortions accounted for by Hispanic women increased during 1997--2006. However, this likely reflects the fact that Hispanic women account for a growing proportion of the United States population (35). Differences in abortion rates and ratios between Hispanic and non-Hispanic women presented in this report are difficult to interpret because the non-Hispanic category includes women from white, black, and other racial populations. Additional efforts to obtain more complete data on race and ethnicity will be attempted for future surveillance reports.

The findings presented in this report indicate that more women are obtaining abortions earlier in gestation, when the risks for complications are lowest (36). Among the areas that reported data consistently during 1997--2006, abortions obtained at ≤8 weeks' gestation increased 11.7%, accounting for 62.0% of all procedures in 2006 compared with 55.5% in 1997. A small but stable percentage of abortions (5.0%--5.7%) were performed at ≥16 weeks' gestation. Even among early-term abortions (≤8 weeks' gestation), a progressive shift to earlier stages of pregnancy occurred: although the percentage of abortions obtained at ≤6 weeks' gestation increased 66.3%, the number performed during the eighth week declined 26.8%. Nonetheless, although a general trend existed for women to obtain abortions at earlier stages of gestation, adolescents were less likely than adult women to obtain an abortion by ≤8 weeks' gestation. Adolescents might seek abortion later in pregnancy because they often take longer to suspect and confirm they are pregnant (37). Additionally, in states with parental involvement laws, adolescents might need more time to receive court approval for obtaining an abortion without parental involvement or to make arrangements to travel to another state. Adolescents approaching age 18 years also have been reported to wait until they are old enough to obtain an abortion without parental involvement (38,39).

The shift in abortion to earlier stages of gestation, although not observed equally in all age groups, reflects changes in the types of procedures being used. Curettage has remained the most common method for performing abortions. Although for many years this procedure has been performed after the initial weeks of gestation, the development of highly sensitive pregnancy tests and transvaginal ultrasonography increasingly has allowed clinicians to diagnose pregnancy and confirm its effective termination at ≤6 weeks' gestation (40--43). In addition, the increasing use of medical abortion has contributed to the rising percentage of abortions performed early in gestation. During 1997--2006, the use of medical abortion among the subset of areas that reported data every year increased from 0.4% of all abortions in 1997 to 11.1% in 2006; among all of the areas that reported procedure type by gestational age for 2006, medical abortion accounted for 15.9% of all cases performed at ≤8 weeks' gestation.

The annual number of deaths associated with known legal abortions was more than two thirds lower on average in the early 2000s than it was in the early 1970s. In 2005, seven women died from causes known to be associated with legal abortions, and none died as a result of known illegal abortions. CDC data cannot be used to calculate national case-fatality rates for 1998--2005 because certain states (four during 1998--1999 and three during 2000--2005), including California, did not report data. Because a substantial number of abortions have been documented in California (2,15), CDC data cannot be used to approximate the total number of abortions as the denominator.

Of the seven deaths associated with legal abortions that were identified in 2005, one occurred after a medical (nonsurgical) abortion procedure. This case has been described previously (44).

Limitations

The findings in this report are subject to at least four limitations. First, because reporting requirements are established by the reporting areas, variation exists in the collection of data. Not all reporting areas use CDC's standard reporting form (7), and many reporting areas do not collect all the information CDC requests on the characteristics of women obtaining abortions (e.g., age, race, and ethnicity); similarly, many reporting areas do not specifically include medical abortion as one of the potential methods for terminating a pregnancy (5,6). Although missing demographic information might reduce the extent to which the statistics in this report represent all women in the United States, three nationally representative surveys of women obtaining abortions in 1987, 1994--1995 and 2001--2002 have produced distributions of characteristics similar to the distributions reported by CDC for the relevant years (2,33,34,45). Conversely, because the number of reporting areas specifically requesting information on medical abortion increased considerably during 1997--2006 (5,6), the numbers presented in this report might not accurately represent trends in the use of this method for performing abortions.

Second, as a result of the variation in reporting requirements, the number of abortions reported annually by CDC is lower than the actual total number of abortions performed in the United States. Although most states have laws mandating the collection of abortion data, in some reporting areas, information is provided to the central health agency on a voluntary basis (5,6). Consequently, the number of abortions reported by CDC consistently has been ≥11.0% lower than the numbers obtained by the Guttmacher Institute through active survey techniques (2,46). In addition, although some areas undoubtedly are unable to count all abortions that occur in their jurisdictions, others provide no numbers at all. Because of these nonreporting areas, since 1998, the number of abortions reported to CDC has been only 65%--69% of the number counted by the Guttmacher Institute (2).

Third, abortion data are compiled and reported to CDC by the central health agency of the reporting area in which the abortion was performed rather than the area in which the woman resided. This inflates abortion statistics for areas in which a high percentage of abortions are obtained by out-of-state residents and undercounts procedures for states with limited abortion services, more stringent legal requirements for obtaining an abortion, or convenient geographic proximity to another state.

Finally, because reporting areas provide CDC with aggregate numbers rather than individual-level records, joint analysis of many points of interest (e.g., age, race, and ethnicity) is precluded; moreover, adjustments for socioeconomic status cannot be made without data on education or income.

Public Health Actions

Ongoing national surveillance of abortion is useful for multiple reasons. Ongoing abortion surveillance is needed to guide and evaluate programs aimed at preventing unintended pregnancies. Although pregnancy intentions are complex and difficult to assess (47--52), the number of abortions provides a concrete measure of the number of unwanted pregnancies. In addition, routine national surveillance of abortion is needed to assess changes in clinical practice patterns (e.g., types of procedures being used and the gestational age at which procedures are performed). Finally, statistics on the number of pregnancies ending in abortion can be used in conjunction with data on births and fetal deaths to estimate pregnancy numbers accurately and determine rates for a variety of outcomes (e.g., adolescent pregnancy rates) (31).

Since 1973, the National Survey of Family Growth (NSFG) has been a principle source of information on factors affecting patterns of sexuality, contraceptive use, and pregnancy intentions in the United States (53). According to the 2002 NSFG, the most recent source of national data on pregnancy intentions, 48% of all pregnancies in the United States are unintended (23). Moreover, calculations based on NSFG data suggest unintended pregnancy underlies nearly all abortions,†††† and one fifth of all pregnancies in the United States end in abortion (31). Providing women with the knowledge and resources necessary to make decisions about their sexual behavior and use of contraception can help women avoid unintended pregnancies and thus reduce the number of abortions performed in the United States. However, efforts to reduce unintended pregnancy have been challenging. NSFG data suggest that unintended pregnancy rates declined during 1982--1995 in conjunction with an increase in the proportion of women at risk for unintended pregnancy§§§§ who were practicing contraception (24,26,27). However, findings from the 2002 NSFG suggested that declines in unintended pregnancy reached a plateau (23). This might be attributable to multiple factors, including

  • a 40% increase during 1995--2002 in contraceptive nonuse among women at risk for unintended pregnancy (26),
  • only modest improvements in the effective use of the most widely adopted forms of reversible contraception (e.g., injectibles, oral contraceptives, and male condoms, which had a 7%, 9%, and 17% probability of pregnancy, respectively, within the first 12 months of typical use) (25), and
  • minimal use of the most effective forms of reversible contraception (e.g., contraceptive implants and intrauterine devices, which were used by <1.5% and <2.5% of all women practicing contraception, respectively) (26).

Because the total number of unintended pregnancies and abortions is similar for the comparatively small group of women who do not use contraception and the much larger group of women who use contraception incorrectly or inconsistently (23,54,55), broader and more effective use of contraception will be needed. Findings from the 2006--2008 NSFG, scheduled for release in late 2009 (56), can help to target efforts for improving contraceptive use, thereby reducing the number of unintended pregnancies and thus the number of legal induced abortions in the United States.

Acknowledgment

Kristi Seed, Division of Reproductive Health, National Center for Chronic Disease Prevention and Health Promotion, CDC, assisted with the tables.

References

  1. Smith JC. Abortion surveillance report, hospital abortions, annual summary 1969. Atlanta, GA: US Department of Health, Education, and Welfare, Public Health Service, Health Services and Mental Health Administration, National Communicable Disease Center; 1970.
  2. Henshaw SK, Kost K. Trends in the characteristics of women obtaining abortions, 1974 to 2004. New York, NY: Guttmacher Institute; 2008. Available at http://www.guttmacher.org/pubs/2008/09/23/TrendsWomenAbortions-wTables.pdf. Accessed November 10, 2009.
  3. Gamble SB, Strauss LT, Parker WY, Cook DA, Zane SB, Hamdan S. Abortion surveillance---United States, 2005. In: Surveillance Summaries, November 28, 2008. MMWR 2008;57(No. SS-13).
  4. CDC. Abortion surveillance, 1981. Atlanta, GA: US Department of Health and Human Services, CDC, Public Health Service; 1985.
  5. Guttmacher Institute. State policies in brief: abortion reporting requirements. New York, NY: Guttmacher Institute; 2009. Available at http://www.guttmacher.com/statecenter/spibs/spib_ARR.pdf. Accessed November 10, 2009.
  6. Saul R. Abortion reporting in the United States: an examination of the federal-state partnership. Fam Plann Perspect 1998;30:244--7.
  7. CDC. Handbook on the reporting of induced termination of pregnancy. Hyattsville, MD: US Department of Health and Human Services, CDC, National Center for Health Statistics; 1998. (USDHHS pub. no. PHS 98-1117).
  8. Office of Management and Budget. Provisional guidance on the implementation of the 1997 standards for federal data on race and ethnicity. Washington, DC: Office of Management and Budget; 2000. Available at http://www.ofm.wa.gov/pop/race/omb.pdf. Accessed November 10, 2009.
  9. Martin JA, Hamilton BE, Sutton PD, et al. Births: final data for 2006. Natl Vital Stat Rep 2009;57(7):1--104.
  10. US Census Bureau. Downloadable data files, state by age, sex, race, and Hispanic origin, 6 race groups. Washington, DC: US Census Bureau; 2006. Available at http://www.census.gov/popest/archives/2000s/vintage_2006. Accessed November 10, 2009.
  11. Kochanek KD. Induced terminations of pregnancy: reporting states, 1988. Monthly Vital Stat Rep 1991;39(12 suppl):1--32.
  12. CDC. Abortion surveillance, 1972. Atlanta, GA: US Department of Health, Education, and Welfare, Public Health Service; 1974.
  13. CDC. Abortion surveillance, 1977. Atlanta, GA: US Department of Health, Education, and Welfare, Public Health Service; 1979.
  14. Chang J, Elam-Evans LD, Berg CJ, et al. Pregnancy-related mortality surveillance---United States, 1991--1999. In: Surveillance Summaries, February 21, 2003. MMWR 2003;52(No. SS-12).
  15. Jones RK, Zolna MR, Henshaw SK, Finer LB. Abortion in the United States: incidence and access to services, 2005. Perspect Sex Reprod Health 2008;40:6--16.
  16. Henshaw SK. Factors hindering access to abortion services. Fam Plann Perspect 1995;27:54--9, 87.
  17. Matthews S, Ribar D, Wilhelm M. The effects of economic conditions and access to reproductive health services on state abortion rates and birthrates. Fam Plann Perspect 1997;29:52--60.
  18. Henshaw SK, Finer LB. The accessibility of abortion services in the United States, 2001. Perspect Sex Reprod Health 2003;35:16--24.
  19. Dennis A, Henshaw SK, Joyce TJ, Finer LB, Blanchard K. The impact of laws requiring parental involvement for abortion: a literature review. New York, NY: Guttmacher Institute; 2009. Available at http://www.guttmacher.org/pubs/ParentalInvolvementLaws.pdf. Accessed November 10, 2009.
  20. Joyce TJ, Henshaw SK, Dennis A, Finer LB, Blanchard K. The impact of state mandatory counseling and waiting period laws on abortion: a literature review. New York, NY: Guttmacher Institute; 2009. Available at http://www.guttmacher.org/pubs/MandatoryCounseling.pdf. Accessed November 10, 2009.
  21. Martinez GM, Chandra A, Abma JC, Jones J, Mosher WD. Fertility, contraception, and fatherhood: data on men and women from Cycle 6 (2002) of the National Survey of Family Growth. Vital Health Stat 2006;23(26):1--142.
  22. Ventura SJ. Changing patterns of nonmarital childbearing in the United States. Hyattsville, MD: US Department of Health and Human Services, CDC, National Center for Health Statistics; 2009. (NCHS data brief, no. 18).
  23. Finer LB, Henshaw SK. Disparities in rates of unintended pregnancy in the United States, 1994 and 2001. Perspect Sex Reprod Health 2006;38:90--6.
  24. Henshaw SK. Unintended pregnancy in the United States. Fam Plann Perspect 1998;30:24--9, 46.
  25. Kost K, Singh S, Vaughan B, Trussell J, Bankole A. Estimates of contraceptive failure from the 2002 National Survey of Family Growth. Contraception 2008;77:10--21.
  26. Mosher WD, Martinez GM, Chandra A, Abma JC, Willson SJ. Use of contraception and use of family planning services in the United States: 1982--2002. Advance Data from Vital Health Stat 2004; no. 350:1--46.
  27. Piccinino LJ, Mosher WD. Trends in contraceptive use in the United States: 1982--1995. Fam Plann Perspect 1998;30:4--10, 46.
  28. Santelli JS, Orr M, Lindberg LD, Diaz DC. Changing behavioral risk for pregnancy among high school students in the United States, 1991--2007. J Adolesc Health 2009;44:25--32.
  29. Santelli JS, Lindberg LD, Finer LB, Singh S. Explaining recent declines in adolescent pregnancy in the United States: the contribution of abstinence and improved contraceptive use. Am J Public Health 2007;97:150--6.
  30. Martin JA, Hamilton BE, Sutton PD, et al. Births, final data for 2005. Natl Vital Stat Rep;56(6):1--104.
  31. Ventura SJ, Abma JC, Mosher WD, Henshaw SK. Estimated pregnancy rates by outcome for the United States, 1990--2004. Natl Vital Stat Rep 2008;56(15):1--23.
  32. Hamilton BE, Martin JA, Ventura SJ. Births: preliminary data for 2007. Natl Vital Stat Rep 2009;57(12):1--22.
  33. Henshaw SK, Kost K. Abortion patients in 1994--1995: characteristics and contraceptive use. Fam Plann Perspect 1996;28:140--7, 58.
  34. Jones RK, Darroch JE, Henshaw SK. Patterns in the socioeconomic characteristics of women obtaining abortions in 2000--2001. Perspect Sex Reprod Health 2002;34:226--35.
  35. US Census Bureau. National characteristics, vintage 2008, population by sex, race, and Hispanic origin. Washington, DC: US Census Bureau; 2008. Available at http://www.census.gov/popest/national/asrh/NC-EST2008-srh.html. Accessed November 10, 2009.
  36. Bartlett LA, Berg CJ, Shulman HB, et al. Risk factors for legal induced abortion-related mortality in the United States. Obstet Gynecol 2004;103:729--37.
  37. Finer LB, Frohwirth LF, Dauphinee LA, Singh S, Moore AM. Timing of steps and reasons for delays in obtaining abortions in the United States. Contraception 2006;74:334--44.
  38. Colman S, Joyce T. Minors' behavioral responses to parental involvement laws: delaying abortion until age 18. Perspect Sex Reprod Health 2009;41:119--26.
  39. Joyce T, Kaestner R, Colman S. Changes in abortions and births and the Texas parental notification law. N Engl J Med 2006;354:1031--8.
  40. Creinin MD, Edwards J. Early abortion: surgical and medical options. Curr Probl Obstet Gynecol Fertil 1997;20:1--32.
  41. Edwards J, Carson SA. New technologies permit safe abortion at less than six weeks' gestation and provide timely detection of ectopic gestation. Am J Obstet Gynecol 1997;176:1101--6.
  42. Grimes DA. Management of abortion. In: Rock JA, Thompson JD, eds. Te Linde's operative gynecology. Philadelphia: Lippincott-Raven Publishers; 1997:477--99.
  43. Fjerstad M, Stewart F. Pregnancy testing and management of early pregnancy. In: Hatcher RA, Trussell J, Nelson AL, Cates W Jr, Stewart F, Kowal D, eds. Contraceptive technology. 19th revised ed. New York, NY: Ardent Media, Inc.; 2008:591--635.
  44. Fischer M, Bhatnagar J, Guarner J, et al. Fatal toxic shock syndrome associated with Clostridium sordellii after medical abortion. N Engl J Med 2005;353:2352--60.
  45. Henshaw SK, Silverman J. The characteristics and prior contraceptive use of U.S. abortion patients. Fam Plann Perspect 1988;20:158--68.
  46. Koonin LM, Smith JC. Legal induced abortion. In: Wilcox LS, Marks JS, eds. From data to action: CDC's public health surveillance for women, infants, and children. Washington, DC: US Department of Health and Human Services; 1994:83--92.
  47. Santelli J, Rochat R, Hatfield-Timajchy K, et al. The measurement and meaning of unintended pregnancy. Perspect Sex Reprod Health 2003;35:94--101.
  48. Lifflander A, Gaydos LM, Hogue CJ. Circumstances of pregnancy: low income women in Georgia describe the difference between planned and unplanned pregnancies. Matern Child Health J 2007;11:81--9.
  49. Sable MR, Spencer JC, Stockbauer JW, Schramm WF, Howell V, Herman AA. Pregnancy wantedness and adverse pregnancy outcomes: differences by race and Medicaid status. Fam Plann Perspect 1997;29:76--81.
  50. Sable MR, Wilkinson DS. Pregnancy intentions, pregnancy attitudes, and the use of prenatal care in Missouri. Matern Child Health J 1998;2:155--65.
  51. Klerman LV. The intendedness of pregnancy: a concept in transition. Matern Child Health J 2000;4:155--62.
  52. Dott M, Rasmussen SA, Hogue CJ, Reefhuis J. Association between pregnancy intention and reproductive-health related behaviors before and after pregnancy recognition, National Birth Defects Prevention Study, 1997--2002. Matern Child Health J 2009; epub. Available at http://www.springerlink.com/content/h116tv7022v23621. Accessed November 10, 2009.
  53. Groves R, Benson G, Mosher WD, et al. Plan and operation of Cycle 6 of the National Survey of Family Growth. Vital Health Stat 2005;1(42):1--67.
  54. Jones RK, Darroch JE, Henshaw SK. Contraceptive use among U.S. women having abortions in 2000--2001. Perspect Sex Reprod Health 2002;34:294--303.
  55. Benson Gold R, Sonfield A, Richards CL, Frost JJ. Next steps for America's family planning program: leveraging the potential of Medicaid and Title X in an evolving health care system. New York, NY: Guttmacher Institute; 2009. Available at http://www.guttmacher.org/pubs/NextSteps.pdf. Accessed November 10, 2009.
  56. CDC. About the National Survey of Family Growth. Cycle 7: a continuous survey. Bethesda, MD: US Department of Health and Human Services, CDC, National Center for Health Statistics; 2009. Available at http://www.cdc.gov/nchs/nsfg/about_nsfg.htm#cycle7. Accessed November 10, 2009.

* In a given year during 1970--1995, CDC obtained information from the central health agencies of eight to 48 reporting areas and from hospitals and other facilities performing abortions in four to 26 reporting areas. In 1996 and 1997, CDC obtained information from the central health agencies of 48 reporting areas and from hospitals and other facilities performing abortions in four reporting areas (California, Iowa, New Hampshire, and Oklahoma).

Hereafter, all abortions are considered to be legally induced unless otherwise stated to be illegally induced.

§ Data were not reported for Alaska during 1998--2002, for California during 1996--2006, for Louisiana during 2005--2006, for New Hampshire during 1998--2006, for Oklahoma during 1998--1999, and for West Virginia during 2003--2004.

Excludes three states (California, Louisiana, and New Hampshire) that did not report data and two states (Florida and Kentucky) that provided totals without residence status.

** An abortion rate was not calculated for Wyoming; because only seven abortions were reported in the state, a calculation would have been unstable.

†† An abortion ratio was not calculated for Wyoming; because only seven abortions were reported in the state, a calculation would have been unstable.

§§ Excludes Alaska, California, the District of Columbia, Florida, Illinois, Iowa, Louisiana, Maryland, Massachusetts, Mississippi, Nebraska, Nevada, New Hampshire, and Oklahoma.

¶¶ Excludes Alaska, California, Connecticut, the District of Columbia, Florida, Illinois, Iowa, Louisiana, Maryland, Massachusetts, Mississippi, Nebraska, Nevada, New Hampshire, Oklahoma, and Wisconsin.

*** Excludes Alabama, Alaska, Arizona, California, Florida, Georgia, Illinois, Iowa, Kentucky, Louisiana, New Hampshire, West Virginia, and Wisconsin.

††† Excludes Alaska, Arizona, Arkansas, California, Connecticut, the District of Columbia, Florida, Iowa, Louisiana, Nebraska, New Hampshire, New York (excluding New York City), Oklahoma, Virginia, and Washington.

§§§ Excludes Alaska, California, Connecticut, the District of Columbia, Florida, Illinois, Iowa, Kentucky, Louisiana, Maine, Massachusetts, New Hampshire, New Mexico, North Carolina, Oklahoma, and Wisconsin.

¶¶¶ Excludes Alaska, California, Connecticut, the District of Columbia, Florida, Illinois, Iowa, Kentucky, Louisiana, Maine, Massachusetts, New Hampshire, New Mexico, North Carolina, Ohio, Oklahoma, Wisconsin, and Wyoming.

**** For 2006, birthrates increased 3.5% for adolescents aged 15--19 years, 2.8% for adolescents aged 15--17 years, and 4.4% for adolescents aged 18--19 years (9). By comparison, the respective changes in abortion rates were 2.1% for adolescents aged 15--19 years, -1.2%--1.3% for adolescents aged 15--17 years, and 2.2%--2.9% for adolescents aged 18--19 years (Tables 4 and 6).

†††† Intended pregnancies are estimated to account for only 4% of all abortions (23) and presumably include those performed for maternal medical indications and fetal abnormalities.

§§§§ Women are considered at risk for unintended pregnancy if they are fertile, have had intercourse in the past 3 months, and are not intentionally pregnant or seeking pregnancy (26).

TABLE 1. Number, percentage,* rate, and ratio§ of reported abortions --- selected states, United States, 1997--2006


All areas with reported numbers

Continuously reporting areas

Year

No.

No.

(%)

Rate

Ratio

1997

910,300**

885,624

(97.3)

17.7

277

1998

884,273

870,184

(98.4)

17.3

267

1999

861,789

847,283

(98.3)

16.9

258

2000

857,475

836,360

(97.5)

16.2

249

2001

853,485

833,183

(97.6)

16.1

250

2002

854,122

835,122

(97.8)

16.2

251

2003

848,163

829,071

(97.7)

16.0

245

2004

839,226

819,353

(97.6)

15.8

241

2005

820,151

809,881

(98.7)

15.6

236

2006

846,181

835,134

(98.7)

16.1

236

* Abortions from areas that reported every year during 1997--2006 as a percentage of all abortions reported..

Number of abortions per 1,000 women aged 15--44 years.

§ Number of abortions per 1,000 live births.

Areas for which abortion data were reported every year during 1997--2006; excludes six states for which no data were available for ≥1 year: Alaska (during 1998--2002), California (during 1997--2006), Louisiana (during 2005--2006), New Hampshire (during 1998--2006), Oklahoma (during 1998--1999), and West Virginia (during 2003--2004).

** This number is lower than that reported previously for 1997 because estimated values for California have been subtracted.


TABLE 2. Number, rate,* and ratio of reported abortions, by residence and occurrence, and percentage of abortions obtained by out-of-state residents,§ by state of occurrence --- selected states, United States, 2006

Residence

Occurrence

% obtained by out-of-state residents

State/Area

No.

Rate

Ratio

No.

Rate

Ratio

Alabama

10,274

10.5

162

11,654

12.4

184

18.7

Alaska**

2,138

14.9

194

1,923

13.4

175

0.6

Arizona**

10,822

8.7

106

10,836

8.7

106

3.4

Arkansas

5,139

9.1

125

4,988

8.8

122

14.0

Colorado

11,101

11.0

157

11,048

11.0

156

0.4

Connecticut

14,351

20.4

343

14,112

20.0

337

3.0

Delaware

3,701

20.9

309

4,804

27.1

401

28.2

District of Columbia

2,150

14.7

252

2,692

18.4

316

54.3

Florida††

---

---

---

95,586

27.3

404

---

Georgia

27,766

13.6

187

30,550

15.0

206

10.7

Hawaii

3,984

15.7

210

3,990

15.7

210

0.3

Idaho

1,954

6.6

81

1,249

4.2

52

2.7

Illinois

41,249

15.4

228

46,467

17.3

257

8.7

Indiana

11,383

8.8

128

10,614

8.2

120

4.0

Iowa**

5,957

10.2

147

6,722

11.5

166

16.7

Kansas

5,895

10.6

144

11,173

20.1

273

48.2

Kentucky††

---

---

---

3,912

4.5

67

---

Maine

2,611

10.2

185

2,670

10.4

189

3.2

Maryland

10,152

8.5

131

9,530

7.9

123

14.3

Massachusetts**

23,933

17.5

308

24,246

17.7

312

4.1

Michigan

25,310

12.3

199

25,636

12.4

201

2.8

Minnesota

13,513

12.7

184

14,065

13.2

191

7.9

Mississippi

6,827

11.3

148

2,949

4.9

64

2.5

Missouri

14,615

12.2

180

7,556

6.3

93

7.5

Montana

1,971

10.9

158

2,119

11.7

169

8.9

Nebraska

2,612

7.4

98

2,927

8.3

110

12.4

Nevada

10,673

21.1

267

11,471

22.7

287

5.7

New Jersey§§

31,742

18.0

276

30,986

17.5

269

5.2

New Mexico

6,386

16.0

213

6,087

15.3

203

5.3

New York

121,993

29.7

488

127,437

31.1

510

---

City

83,220

44.7

694

90,157

48.5

752

8.5

State

38,773

17.3

298

37,280

16.6

286

5.6

North Carolina

29,676

16.0

232

35,088

18.9

274

17.4

North Dakota

887

7.0

103

1,298

10.2

151

40.1


TABLE 2. (Continued) Number, rate,* and ratio of reported abortions, by residence and occurrence, and percentage of abortions obtained by out-of-state residents,§ by state of occurrence --- selected states, United States, 2006

Residence

Occurrence

% obtained by out-of-state residents

State/Area

No.

Rate

Ratio

No.

Rate

Ratio

Ohio

31,582

13.6

210

32,936

14.2

219

6.0

Oklahoma

7,274

10.1

135

7,088

9.8

131

3.5

Oregon

10,548

14.3

217

11,732

15.9

241

12.5

Pennsylvania

38,381

15.7

257

36,731

15.0

246

4.2

Rhode Island

3,810

17.0

308

4,828

21.5

390

23.6

South Carolina

12,683

14.2

204

7,005

7.8

113

4.2

South Dakota

868

5.7

73

748

4.9

63

15.4

Tennessee

14,933

11.9

177

17,883

14.2

212

22.2

Texas

79,266

15.8

198

81,883

16.3

205

3.6

Utah

3,595

6.3

67

3,753

6.5

70

8.2

Vermont

1,478

111.9

227

1,610

13.0

247

9.6

Virginia

28,418

17.5

264

27,349

16.8

254

5.3

Washington

24,798

18.7

285

24,627

18.6

283

4.8

West Virginia

2,493

7.1

119

2,036

5.8

97

10.3

Wisconsin

10,815

9.6

150

9,580

8.5

132

2.4

Wyoming

275

2.7

36

7

0.1

1

0.0

Other residence¶¶

2,739

---

---

NA***

NA

NA

NA

Total known

738,908

846,181

15.9

233

8.4

Total unknown residence†††

7,775

Total not reported by residence§§§

99,498

Total

846,181

15.9

233

* Number of abortions per 1,000 women aged 15--44 years.

Number of abortions per 1,000 live births.

§ Based on number of abortions for which residence residence status was known.

Excludes three states (California, Louisiana, and New Hampshire) that did not report data for 2006.

** State reported numbers of abortions for both in-state and out-of-state residents; however, for out-of-state residents, only the total number was provided and not the individual state or area of residence.

†† State reported abortions by occurrence only.

§§ Numbers do not include private physicians' procedures.

¶¶ Women known to reside out of state whose residence was listed as Canada, Mexico, or "other."

*** Not applicable.

††† Reported as unknown residence by areas otherwise providing information on residence status.

§§§ Total for selected states that did not report abortions by residence.


TABLE 3. Reported abortions, by age group of women who obtained an abortion and state of occurrence --- selected states, United States, 2006*

Age group (yrs)

<15

15--19

20--24

25--29

30--34

35--39

≥40

Unknown

Total

State/Area

No.

(%)

No.

(%)

No.

(%)

No.

(%)

No.

(%)

No.

(%)

No.

(%)

No.

(%)

No.

(%)

Alabama

98

(0.8)

2,082

(17.9)

4,078

(35.0)

2,799

(24.0)

1,511

(13.0)

819

(7.0)

267

(2.3)

0

(0)

11,654

(100.0)

Alaska

7

(0.4)

362

(18.8)

667

(34.7)

447

(23.2)

224

(11.6)

147

(7.6)

54

(2.8)

15

(0.8)

1,923

(100.0)

Arizona

71

(0.7)

1,896

(17.5)

3,621

(33.4)

2,335

(21.5)

1,422

(13.1)

910

(8.4)

431

(4.0)

150

(1.4)

10,836

(100.0)

Arkansas

46

(0.9)

910

(18.2)

1,592

(31.9)

1,182

(23.7)

665

(13.3)

442

(8.9)

---§

---

---

---

4,988

(100.0)

Colorado

61

(0.6)

1,933

(17.5)

3,702

(33.5)

2,417

(21.9)

1,491

(13.5)

1,042

(9.4)

362

(3.3)

40

(0.4)

11,048

(100.0)

Connecticut

85

(0.6)

2,648

(18.8)

4,562

(32.3)

3,129

(22.2)

1,783

(12.6)

1,196

(8.5)

395

(2.8)

314

(2.2)

14,112

(100.0)

Delaware

28

(0.8)

604

(17.5)

1,154

(33.4)

833

(24.1)

445

(12.9)

272

(7.9)

92

(2.7)

23

(0.7)

3,451

(100.0)

Dist. of Columbia

20

(0.7)

474

(17.6)

803

(29.8)

686

(25.5)

392

(14.6)

235

(8.7)

82

(3.0)

0

(0)

2,692

(100.0)

Georgia

174

(0.6)

4,346

(14.2)

9,605

(31.4)

7,912

(25.9)

4,812

(15.8)

2,858

(9.4)

843

(2.8)

0

(0)

30,550

(100.0)

Hawaii

25

(0.6)

799

(20.0)

1,343

(33.7)

843

(21.1)

514

(12.9)

321

(8.0)

139

(3.5)

6

(0.2)

3,990

(100.0)

Idaho

8

(0.6)

257

(20.6)

398

(31.9)

268

(21.5)

162

(13.0)

112

(9.0)

43

(3.4)

1

(0.1)

1,249

(100.0)

Illinois¶,**

282

(0.7)

6,834

(17.0)

12,376

(30.9)

9,771

(24.4)

5,946

(14.8)

3,678

(9.2)

1,207

(3.0)

0

(0)

40,094

(100.0)

Indiana

63

(0.6)

1,637

(15.4)

3,597

(33.9)

2,449

(23.1)

1,478

(13.9)

937

(8.8)

306

(2.9)

147

(1.4)

10,614

(100.0)

Iowa

35

(0.5)

1,187

(17.7)

2,354

(35.0)

1,504

(22.4)

852

(12.7)

567

(8.4)

204

(3.0)

19

(0.3)

6,722

(100.0)

Kansas

67

(0.6)

1,883

(16.9)

3,758

(33.6)

2,696

(24.1)

1,533

(13.7)

958

(8.6)

278

(2.5)

0

(0)

11,173

(100.0)

Kentucky

27

(0.7)

635

(16.2)

1,247

(31.9)

937

(24.0)

556

(14.2)

365

(9.3)

109

(2.8)

36

(0.9)

3,912

(100.0)

Maine

11

(0.4)

472

(17.7)

964

(36.1)

561

(21.0)

330

(12.4)

209

(7.8)

77

(2.9)

46

(1.7)

2,670

(100.0)

Maryland

31

(0.4)

1,175

(14.4)

2,518

(30.9)

2,067

(25.4)

1,313

(16.1)

795

(9.8)

240

(2.9)

0

(0)

8,139

(100.0)

Massachusetts

72

(0.3)

3,947

(16.3)

7,725

(31.9)

5,682

(23.4)

3,375

(13.9)

2,421

(10.0)

985

(4.1)

39

(0.2)

24,246

(100.0)

Michigan

147

(0.6)

4,547

(17.7)

8,259

(32.2)

5,913

(23.1)

3,701

(14.4)

2,306

(9.0)

745

(2.9)

18

(0.1)

25,636

(100.0)

Minnesota

63

(0.4)

2,078

(14.8)

4,789

(34.0)

3,465

(24.6)

1,964

(14.0)

1,267

(9.0)

439

(3.1)

0

(0)

14,065

(100.0)

Mississippi

17

(0.6)

450

(15.3)

1,115

(37.8)

735

(24.9)

381

(12.9)

192

(6.5)

57

(1.9)

2

(0.1)

2,949

(100.0)

Missouri

50

(0.7)

1,228

(16.3)

2,594

(34.3)

1,761

(23.3)

1,043

(13.8)

627

(8.3)

253

(3.3)

0

(0)

7,556

(100.0)

Montana

13

(0.6)

400

(18.9)

773

(36.5)

453

(21.4)

234

(11.0)

158

(7.5)

87

(4.1)

1

(0)

2,119

(100.0)

Nebraska

12

(0.4)

448

(15.3)

991

(33.9)

716

(24.5)

423

(14.5)

241

(8.2)

96

(3.3)

0

(0)

2,927

(100.0)

Nevada

48

(0.4)

1,785

(15.6)

3,388

(29.5)

2,561

(22.3)

1,716

(15.0)

1,090

(9.5)

393

(3.4)

490

(4.3)

11,471

(100.0)

New Jersey††

139

(0.4)

5,453

(17.6)

9,467

(30.6)

7,679

(24.8)

4,438

(14.3)

2,691

(8.7)

1,119

(3.6)

0

(0)

30,986

(100.0)

New Mexico

22

(0.4)

1,186

(19.5)

2,170

(35.6)

1,346

(22.1)

705

(11.6)

393

(6.5)

173

(2.8)

92

(1.5)

6,087

(100.0)

New York

687

(0.5)

22,599

(17.7)

38,612

(30.3)

30,231

(23.7)

18,778

(14.7)

11,681

(9.2)

4,309

(3.4)

540

(0.4)

127,437

(100.0)

City

472

(0.5)

15,058

(16.7)

26,105

(29.0)

22,303

(24.7)

14,183

(15.7)

8,538

(9.5)

3,119

(3.5)

379

(0.4)

90,157

(100.0)

State

215

(0.6)

7,541

(20.2)

12,507

(33.5)

7,928

(21.3)

4,595

(12.3)

3,143

(8.4)

1,190

(3.2)

161

(0.4)

37,280

(100.0)

North Carolina

179

(0.5)

5,251

(15.0)

11,548

(32.9)

8,230

(23.5)

4,864

(13.9)

2,749

(7.8)

892

(2.5)

1,375

(3.9)

35,088

(100.0)

North Dakota

5

(0.4)

224

(17.3)

497

(38.3)

303

(23.3)

139

(10.7)

101

(7.8)

29

(2.2)

0

(0)

1,298

(100.0)

Ohio

292

(0.9)

5,603

(17.0)

11,123

(33.8)

7,720

(23.4)

4,333

(13.2)

2,741

(8.3)

898

(2.7)

226

(0.7)

32,936

(100.0)

Oklahoma

39

(0.6)

1,109

(15.6)

2,550

(36.0)

1,603

(22.6)

937

(13.2)

587

(8.3)

201

(2.8)

62

(0.9)

7,088

(100.0)

Oregon

59

(0.5)

1,998

(17.0)

3,805

(32.4)

2,760

(23.5)

1,624

(13.8)

1,048

(8.9)

396

(3.4)

42

(0.4)

11,732

(100.0)

Pennsylvania

207

(0.6)

6,208

(16.9)

12,454

(33.9)

8,401

(22.9)

5,052

(13.8)

3,205

(8.7)

1,196

(3.3)

8

(0)

36,731

(100.0)

Rhode Island

15

(0.3)

850

(17.6)

1,662

(34.4)

1,134

(23.5)

555

(11.5)

406

(8.4)

164

(3.4)

42

(0.9)

4,828

(100.0)

South Carolina

39

(0.6)

1,255

(17.9)

2,284

(32.6)

1,651

(23.6)

979

(14.0)

590

(8.4)

205

(2.9)

2

(0)

7,005

(100.0)

South Dakota

2

(0.3)

122

(16.3)

290

(38.8)

157

(21.0)

94

(12.6)

60

(8.0)

23

(3.1)

0

(0)

748

(100.0)

Tennessee

100

(0.6)

2,781

(15.6)

4,769

(26.7)

4,379

(24.5)

2,042

(11.4)

1,462

(8.2)

305

(1.7)

2,045

(11.4)

17,883

(100.0)

Texas

229

(0.3)

10,301

(12.6)

28,039

(34.2)

21,001

(25.6)

12,358

(15.1)

7,227

(8.8)

2,715

(3.3)

13

(0)

81,883

(100.0)

Utah

12

(0.3)

616

(16.4)

1,238

(33.0)

909

(24.2)

503

(13.4)

311

(8.3)

109

(2.9)

55

(1.5)

3,753

(100.0)

Vermont

5

(0.3)

295

(18.3)

593

(36.8)

329

(20.4)

184

(11.4)

144

(8.9)

60

(3.7)

0

(0)

1,610

(100.0)

Virginia

124

(0.5)

3,857

(14.1)

9,200

(33.6)

6,775

(24.8)

3,926

(14.4)

2,426

(8.9)

859

(3.1)

182

(0.7)

27,349

(100.0)

Washington

91

(0.4)

4,424

(18.0)

8,175

(33.2)

5,688

(23.1)

3,152

(12.8)

2,230

(9.1)

840

(3.4)

27

(0.1)

24,627

(100.0)

West Virginia

11

(0.5)

309

(15.2)

655

(32.2)

526

(25.8)

312

(15.3)

165

(8.1)

53

(2.6)

5

(0.2)

2,036

(100.0)

Wisconsin

47

(0.5)

1,615

(17.3)

3,162

(33.8)

2,187

(23.4)

1,288

(13.8)

763

(8.2)

290

(3.1)

0

(0)

9,352

(100.0)

Wyoming

---

---

---

---

---

---

---

---

---

---

---

---

---

---

---

---

7

(100.0)

Total§§

3,865

(0.5)

121,073

(16.3)

240,266

(32.4)

177,131

(23.9)

104,529

(14.1)

65,145

(8.8)

23,020

(3.1)

6,063

(0.8)

741,250

(100.0)

Percentage of known values

(0.5)

(16.5)

(32.7)

(24.1)

(14.2)

(8.9)

(3.2)

Abortion rate¶¶

1.2

14.8

29.9

22.2

13.6

7.8

2.6

14.0

Abortion ratio***

754

351

280

188

140

170

276

219


TABLE 3. (Continued) Reported abortions, by age group of women who obtained an abortion and state of occurrence --- selected states, United States, 2006*

* Data from 48 reporting areas; excludes three states (California, Louisiana, and New Hampshire) that did not report data and one state (Florida) that did not report data by age.

Percentages for the individual component categories might not add up to 100.0% because of rounding.

§ Cell details not displayed because of small numbers (N<5).

Includes residents only.

** Number of procedures for women aged ≥45 years are included in the unknown age group because age was not specified for women aged ≥45 years (women aged ≥45 years accounted for <0.2% of abortions in previous years). Because of how these numbers were distributed, for Illinois, the category "aged ≥40 years" represents women aged 40--44 years.

†† Numbers do not include private physicians' procedures.

§§ Small numbers (N<5) that have been removed from individual cells have been subtracted from the total.

¶¶ Calculated as the number of abortions obtained by women in a given age group per 1,000 women in that same age group. Adolescents aged 13--14 years were used as the denominator for the group of adolescents aged <15 years, and women aged 40--44 years were used as the denominator for the group of women aged ≥40 years. Women aged 15--44 years were used as the denominator for the overall rate. For each state, data for women of unknown age were distributed according to the distribution of abortions among women of known age for that state.

*** Calculated as the number of abortions obtained by women in a given age group per 1,000 live births to women in that same age group. Births to adolescents aged 13--14 years were used as the denominator for the group of adolescents aged <15 years, and births to women aged 40--44 years were used as the denominator for the group of women aged ≥40 years. Births to women aged 15--44 years were used as the denominator for the overall ratio. For each state, abortions for women of unknown age were distributed according to the distribution of abortions among women of known age for that state.


TABLE 4. Reported abortions, by age group* and year --- selected states, United States, 1997--2006

% change during

Characteristic

1997

1998

1999

2000

2001

2002

2003

2004

2005

2006

2005--2006

1997--2006

Age group (yrs)

% of abortions

<15

0.7

0.7

0.7

0.6

0.6

0.6

0.6

0.6

0.6

0.5

-16.7

-28.6

15--19

19.3

19.1

18.5

18.1

17.5

16.9

16.7

16.6

16.5

16.5

0.0

-14.5

20--24

31.6

31.7

32.1

32.7

33.3

33.3

33.4

33.1

32.8

32.6

-0.6

3.2

25--29

23.5

23.5

23.3

22.9

22.5

22.7

22.7

23.1

23.6

24.1

2.1

2.6

30--34

14.0

14.0

14.0

14.3

14.7

15.0

14.9

14.8

14.6

14.2

-2.7

1.4

35--39

8.2

8.3

8.5

8.4

8.4

8.5

8.4

8.5

8.8

8.9

1.1

8.5

≥40

2.6

2.7

2.8

2.9

3.0

3.2

3.2

3.2

3.2

3.2

0.0

23.1

Abortion rate§

<15

2.0

1.9

1.7

1.6

1.5

1.4

1.4

1.3

1.3

1.2

-4.4

-39.5

15--19

21.1

20.1

18.8

17.6

17.0

16.3

16.0

15.3

14.7

15.0

2.1

-29.0

20--24

37.5

36.8

35.5

33.6

32.8

32.0

31.4

30.2

29.4

30.3

3.0

-19.4

25--29

25.5

25.5

24.9

22.9

23.1

23.4

23.0

22.4

21.9

22.5

2.5

-11.8

30--34

13.8

13.9

13.8

13.4

13.7

13.9

13.8

13.6

13.5

13.8

2.8

0.4

35--39

7.4

7.4

7.3

7.1

7.2

7.4

7.5

7.5

7.7

7.9

3.3

7.3

≥40

2.4

2.5

2.4

2.4

2.5

2.6

2.6

2.6

2.6

2.6

2.1

7.4

Abortion ratio

<15

738

764

720

726

761

775

844

784

774

759

-2.0

2.8

15--19

416

400

383

372

378

381

385

373

365

357

-2.0

-14.2

20--24

351

336

322

309

313

313

308

299

289

285

-1.4

-18.6

25--29

227

220

211

202

204

205

199

194

190

192

0.8

-15.4

30--34

162

159

154

147

149

150

145

143

141

141

0.3

-12.9

35--39

210

201

194

182

182

181

174

170

169

171

0.9

-18.7

≥40

353

340

331

303

306

312

294

285

279

277

-0.6

-21.3

Total no. of abortions

793,367

781,276

755,101

739,278

739,469

737,557

731,461

715,035

703,264

723,481

* Excludes women for whom age was reported as unknown.

Data from 44 reporting areas; by year, these reporting areas represent 88%--90% of the abortions reported by the 46 reporting areas that provided data every year during 1997--2006. Excludes three states (California, Louisiana, and New Hampshire) that did not report data and five states (Alaska, Florida, Iowa, Oklahoma, and West Virginia) that did not provide numbers by age meeting reporting standards for ≥1 year.

§ Calculated as the number of abortions obtained by women in a given age group per 1,000 women in that same age group. Adolescents aged 13--14 years were used as the denominator for the group of adolescents aged <15 years, and women aged 40--44 years were used as the denominator for the group of women aged ≥40 years. Women aged 15--44 years were used as the denominator for the overall rate. For each state, abortions for women of unknown age were distributed according to the distribution of abortions among women of known age for that state.

Calculated as the number of abortions obtained by women in a given age group per 1,000 live births to women in that same age group. Births to adolescents aged 13--14 years were used as the denominator for the group of adolescents aged <15 years, and births to women aged 40--44 years were used as the denominator for the group of women aged ≥40 years. Births to women aged 15--44 years were used as the denominator for the overall ratio. For each state, abortions for women of unknown age were distributed according to the distribution of abortions among women of known age for that state.


TABLE 5. Reported abortions obtained by adolescents, by known age and state of occurrence --- selected states, United States, 2006*

Age (yrs)

<15

15

16

17

18

19

Total

State/Area

No

(%)

No

(%)

No

(%)

No

(%)

No

(%)

No

(%)

No

(%)

Alabama

98

(4.5)

142

(6.5)

266

(12.2)

336

(15.4)

621

(28.5)

717

(32.9)

2,180

(100.0)

Alaska

7

(1.9)

20

(5.4)

47

(12.7)

54

(14.6)

117

(31.7)

124

(33.6)

369

(100.0)

Arizona

71

(3.6)

100

(5.1)

219

(11.1)

315

(16.0)

557

(28.3)

705

(35.8)

1,967

(100.0)

Arkansas

46

(4.8)

53

(5.5)

118

(12.3)

184

(19.2)

260

(27.2)

295

(30.9)

956

(100.0)

Colorado

61

(3.1)

126

(6.3)

188

(9.4)

326

(16.3)

603

(30.2)

690

(34.9)

1,994

(100.0)

Connecticut

85

(3.1)

155

(5.7)

372

(13.6)

535

(19.6)

752

(27.5)

834

(30.5)

2,733

(100.0)

Delaware§

28

(4.4)

40

(6.3)

64

(10.1)

132

(20.9)

196

(31.0)

172

(27.2)

632

(100.0)

District of Columbia

20

(4.0)

31

(6.3)

75

(15.2)

115

(23.3)

112

(22.7)

141

(28.5)

494

(100.0)

Georgia

174

(3.8)

333

(7.4)

488

(10.8)

692

(15.3)

1,268

(28.1)

1,565

(34.6)

4,520

(100.0)

Hawaii

25

(3.0)

47

(5.7)

131

(15.9)

183

(22.2)

193

(23.4)

245

(29.7)

824

(100.0)

Idaho

8

(3.0)

19

(7.2)

35

(13.2)

59

(22.3)

70

(26.4)

74

(27.9)

265

(100.0)

Indiana

63

(3.7)

118

(6.9)

175

(10.3)

239

(14.1)

491

(28.9)

614

(36.1)

1,700

(100.0)

Iowa

35

(2.9)

72

(5.9)

151

(12.4)

205

(16.8)

338

(27.7)

421

(34.5)

1,222

(100.0)

Kansas

67

(3.4)

136

(7.0)

239

(12.3)

316

(16.2)

529

(27.1)

663

(34.0)

1,950

(100.0)

Kentucky

27

(4.1)

45

(6.8)

84

(12.7)

99

(15.0)

195

(29.5)

212

(32.0)

662

(100.0)

Maine

11

(2.3)

26

(5.4)

60

(12.4)

92

(19.0)

140

(29.0)

154

(31.9)

483

(100.0)

Massachusetts

72

(1.8)

214

(5.3)

427

(10.6)

659

(16.4)

1,196

(29.8)

1,451

(36.1)

4,019

(100.0)

Michigan

147

(3.1)

268

(5.7)

572

(12.2)

785

(16.7)

1,379

(29.4)

1,543

(32.9)

4,694

(100.0)

Minnesota

63

(2.9)

122

(5.7)

258

(12.1)

350

(16.3)

609

(28.4)

739

(34.5)

2,141

(100.0)

Mississippi

17

(3.6)

32

(6.9)

45

(9.6)

64

(13.7)

152

(32.5)

157

(33.6)

467

(100.0)

Missouri

50

(3.9)

76

(5.9)

143

(11.2)

179

(14.0)

361

(28.2)

469

(36.7)

1,278

(100.0)

Montana

13

(3.1)

26

(6.3)

58

(14.0)

64

(15.5)

123

(29.8)

129

(31.2)

413

(100.0)

Nebraska

12

(2.6)

27

(5.9)

58

(12.6)

65

(14.1)

127

(27.6)

171

(37.2)

460

(100.0)

Nevada

48

(2.6)

94

(5.1)

221

(12.1)

385

(21.0)

509

(27.8)

576

(31.4)

1,833

(100.0)

New Jersey

139

(2.5)

321

(5.7)

682

(12.2)

1,056

(18.9)

1,497

(26.8)

1,897

(33.9)

5,592

(100.0)

New Mexico

22

(1.8)

94

(7.8)

168

(13.9)

218

(18.0)

317

(26.2)

389

(32.2)

1,208

(100.0)

New York

687

(3.0)

1,525

(6.5)

2,986

(12.8)

4,755

(20.4)

6,250

(26.8)

7,083

(30.4)

23,286

(100.0)

City

472

(3.0)

1,022

(6.6)

2,009

(12.9)

3,169

(20.4)

4,160

(26.8)

4,698

(30.3)

15,530

(100.0)

State

215

(2.8)

503

(6.5)

977

(12.6)

1,586

(20.4)

2,090

(26.9)

2,385

(30.8)

7,756

(100.0)

North Carolina

179

(3.3)

334

(6.2)

601

(11.1)

855

(15.7)

1,534

(28.3)

1,927

(35.5)

5,430

(100.0)

North Dakota

5

(2.2)

14

(6.1)

15

(6.6)

30

(13.1)

66

(28.8)

99

(43.2)

229

(100.0)

Ohio

292

(5.0)

419

(7.1)

725

(12.3)

944

(16.0)

1,629

(27.6)

1,886

(32.0)

5,895

(100.0)

Oklahoma

39

(3.4)

64

(5.6)

123

(10.7)

174

(15.2)

359

(31.3)

389

(33.9)

1,148

(100.0)

Oregon

59

(2.9)

121

(5.9)

255

(12.4)

394

(19.2)

537

(26.2)

687

(33.5)

2,053

(100.0)

Pennsylvania

207

(3.2)

399

(6.2)

719

(11.2)

953

(14.9)

1,907

(29.7)

2,230

(34.8)

6,415

(100.0)

Rhode Island

15

(1.7)

49

(5.7)

86

(9.9)

111

(12.8)

249

(28.8)

355

(41.0)

865

(100.0)

South Carolina

39

(3.0)

74

(5.7)

142

(11.0)

294

(22.7)

338

(26.1)

407

(31.5)

1,294

(100.0)

South Dakota

---**

---

---

---

19

(15.3)

18

(14.5)

41

(33.1)

39

(31.5)

124

(100.0)

Tennessee

100

(3.5)

199

(6.9)

291

(10.1)

412

(14.3)

852

(29.6)

1,027

(35.6)

2,881

(100.0)

Texas

229

(2.2)

514

(4.9)

1,028

(9.8)

1,663

(15.8)

2,759

(26.2)

4,337

(41.2)

10,530

(100.0)

Utah

12

(1.9)

38

(6.1)

70

(11.1)

77

(12.3)

218

(34.7)

213

(33.9)

628

(100.0)

Vermont

5

(1.7)

16

(5.3)

24

(8.0)

58

(19.3)

90

(30.0)

107

(35.7)

300

(100.0)

Virginia

124

(3.1)

205

(5.1)

365

(9.2)

555

(13.9)

1,238

(31.1)

1,494

(37.5)

3,981

(100.0)

Washington

91

(2.0)

230

(5.1)

571

(12.6)

824

(18.3)

1,285

(28.5)

1,514

(33.5)

4,515

(100.0)

West Virginia

11

(3.4)

17

(5.3)

27

(8.4)

53

(16.6)

88

(27.5)

124

(38.8)

320

(100.0)

Wisconsin§

47

(2.8)

115

(6.9)

180

(10.8)

254

(15.3)

477

(28.7)

589

(35.4)

1,662

(100.0)

Wyoming

---

---

---

---

---

---

---

---

---

---

---

---

1

(100.0)

Total††

3,550

(3.0)

7,070

(6.1)

13,571

(11.6)

20,131

(17.3)

32,629

(28.0)

39,654

(34.0)

116,613

(100.0)

Abortion rate§§

1.2

4.6

8.7

13.3

22.1

26.8

11.0

Abortion ratio¶¶

749

529

432

354

358

310

358

* Data from 46 reporting areas; excludes three states (California, Louisiana, and New Hampshire) that did not report data and three states (Florida, Illinois, and Maryland) that did not report age among adolescents by individual year.

Percentages for the individual component categories might not add up to 100.0 because of rounding.

§ Includes residents only.

Numbers do not include private physicians' procedures.

** Cell details not displayed because of small numbers (N<5).

†† Small numbers (N<5) that have been removed from individual cells have been subtracted from the total.

§§ Calculated as the number of abortions obtained by adolescents in a given age group per 1,000 adolescents in that same age group. Adolescents aged 13--14 years were used as the denominator for adolescents aged <15 years.

¶¶ Calculated as the number of abortions obtained by adolescents in a given age group per 1,000 live births to adolescents in that same age group. Births to adolescents aged 13--14 years were used as the denominator for adolescents aged <15 years.


TABLE 6. Reported abortions among adolescents, by age and year --- selected states, United States, 1997--2006*

% change during

1997

1998

1999

2000

2001

2002

2003

2004

2005

2006

2005--2006

1997--2006

Age (yrs)

% of abortions

<15

3.6

3.5

3.4

3.4

3.4

3.4

3.4

3.3

3.3

3.0

-9.2

-15.2

15

6.7

6.6

6.2

6.3

6.2

6.2

6.3

6.1

6.4

6.1

-5.0

-9.9

16

12.4

12.1

11.6

11.4

11.3

11.6

11.6

11.5

11.4

11.6

2.3

-6.1

17

18.1

18.1

17.7

17.2

17.1

17.3

17.3

17.0

17.2

17.3

0.6

-4.1

18

27.8

28.2

28.0

28.2

27.9

27.6

28.1

28.2

27.7

27.9

0.7

0.3

19

31.4

31.5

33.1

33.6

34.2

33.9

33.3

33.9

33.9

34.0

0.2

8.3

Abortion rate

<15

2.0

1.9

1.7

1.6

1.5

1.4

1.4

1.3

1.3

1.2

-5.8

-39.3

15

7.3

6.9

6.2

5.8

5.5

5.3

5.3

4.9

4.8

4.7

-1.2

-35.4

16

13.7

12.7

11.5

10.7

10.0

9.9

9.8

9.3

8.9

8.9

0.7

-35.0

17

19.4

19.1

17.2

15.9

15.3

14.8

14.6

13.9

13.6

13.8

1.3

-29.3

18

31.7

29.7

28.0

25.7

25.0

23.8

23.8

22.9

22.2

22.7

2.2

-28.4

19

34.6

32.8

31.1

29.8

30.0

29.1

28.4

27.5

26.8

27.6

2.9

-20.4

Abortion ratio§

<15

748

765

721

730

757

782

854

790

795

761

-4.3

1.8

15

549

545

519

524

534

567

572

544

558

546

-2.2

-0.6

16

463

452

435

429

436

454

474

450

447

446

-0.3

-3.6

17

393

396

378

360

376

379

387

375

373

367

-1.5

-6.5

18

434

414

398

386

389

394

402

395

380

372

-2.2

-14.4

19

392

366

353

342

345

343

345

338

329

323

-1.9

-17.6

Total no. of abortions

143,578

138,516

131,094

125,162

120,936

116,528

116,084

112,792

110,513

112,892

* Data from 41 reporting areas; by year, these reporting areas represent 82%--84% of the abortions reported by the 46 reporting areas that provided data every year during 1997--2006. Excludes three states (California, Louisiana, and New Hampshire) that did not report data and eight states (Alaska, Florida, Indiana, Iowa, Kentucky, Maryland, Oklahoma, and Washington) that did not provide numbers among adolescents by age meeting reporting standards for ≥1 year.

Calculated as the number of abortions obtained by adolescents in a given age group per 1,000 adolescents in that same age group. Adolescents aged 13--14 years were used as the denominator for adolescents aged <15 years.

§ Calculated as the number of abortions obtained by adolescents in a given age group per 1,000 live births to adolescents in that same age group. Births to adolescents aged 13--14 years were used as the denominator for adolescents aged <15 years.


TABLE 7. Reported abortions, by weeks of gestation and state of occurrence --- selected states, United States, 2006*

Weeks

≤8

9--10

11--12

13--15

16--20

≥21

Unknown

Total

State/Area

No.

(%)

No.

(%)

No.

(%)

No.

(%)

No.

(%)

No.

(%)

No.

(%)

No.

(%)

Alabama§

6,914

(59.3)

2,016

(17.3)

1,208

(10.4)

937

(8.0)

525

(4.5)

26

(0.2)

28

(0.2)

11,654

(100.0)

Alaska

1,153

(60.0)

432

(22.5)

223

(11.6)

87

(4.5)

0

(0)

15

(0.8)

13

(0.7)

1,923

(100.0)

Arizona§

6,937

(64.0)

1,954

(18.0)

875

(8.1)

520

(4.8)

357

(3.3)

95

(0.9)

98

(0.9)

10,836

(100.0)

Arkansas

2,885

(57.8)

915

(18.3)

464

(9.3)

397

(8.0)

325

(6.5)

---**

---

---

---

4,988

(100.0)

Colorado§

7,293

(66.0)

1,620

(14.7)

838

(7.6)

657

(5.9)

355

(3.2)

258

(2.3)

27

(0.2)

11,048

(100.0)

Connecticut††

8,632

(61.2)

2,343

(16.6)

1,357

(9.6)

914

(6.5)

375

(2.7)

17

(0.1)

474

(3.4)

14,112

(100.0)

Delaware§,§§

2,144

(62.1)

623

(18.1)

342

(9.9)

208

(6.0)

112

(3.2)

15

(0.4)

7

(0.2)

3,451

(100.0)

District of Columbia

1,783

(66.2)

294

(10.9)

165

(6.1)

226

(8.4)

214

(7.9)

0

(0)

10

(0.4)

2,692

(100.0)

Georgia

17,126

(56.1)

6,107

(20.0)

3,140

(10.3)

1,852

(6.1)

1,425

(4.7)

900

(2.9)

0

(0)

30,550

(100.0)

Hawaii§

2,198

(55.1)

757

(19.0)

474

(11.9)

265

(6.6)

245

(6.1)

28

(0.7)

23

(0.6)

3,990

(100.0)

Idaho§

804

(64.4)

258

(20.7)

135

(10.8)

37

(3.0)

8

(0.6)

---

---

---

---

1,249

(100.0)

Indiana§

6,042

(56.9)

1,918

(18.1)

1,007

(9.5)

297

(2.8)

116

(1.1)

0

(0)

1,234

(11.6)

10,614

(100.0)

Iowa

4,840

(72.0)

873

(13.0)

567

(8.4)

272

(4.0)

145

(2.2)

9

(0.1)

16

(0.2)

6,722

(100.0)

Kansas

7,054

(63.1)

1,600

(14.3)

930

(8.3)

685

(6.1)

486

(4.3)

418

(3.7)

0

(0)

11,173

(100.0)

Kentucky

2,256

(57.7)

598

(15.3)

394

(10.1)

266

(6.8)

259

(6.6)

51

(1.3)

88

(2.2)

3,912

(100.0)

Maine¶¶

1,778

(66.6)

490

(18.4)

279

(10.4)

98

(3.7)

16

(0.6)

9

(0.3)

0

(0)

2,670

(100.0)

Michigan

16,582

(64.7)

4,272

(16.7)

2,201

(8.6)

1,799

(7.0)

681

(2.7)

88

(0.3)

13

(0.1)

25,636

(100.0)

Minnesota§

8,913

(63.4)

2,281

(16.2)

1,268

(9.0)

817

(5.8)

733

(5.2)

53

(0.4)

0

(0)

14,065

(100.0)

Missouri

4,505

(59.6)

1,408

(18.6)

925

(12.2)

378

(5.0)

244

(3.2)

46

(0.6)

50

(0.7)

7,556

(100.0)

Montana§

1,167

(55.1)

435

(20.5)

253

(11.9)

169

(8.0)

92

(4.3)

---

---

---

---

2,119

(100.0)

Nevada§

5,938

(51.8)

2,020

(17.6)

1,118

(9.7)

653

(5.7)

365

(3.2)

48

(0.4)

1,329

(11.6)

11,471

(100.0)

New Jersey§,***

17,784

(57.4)

4,930

(15.9)

1,788

(5.8)

3,158

(10.2)

2,395

(7.7)

931

(3.0)

0

(0)

30,986

(100.0)

New Mexico

3,686

(60.6)

928

(15.2)

548

(9.0)

415

(6.8)

322

(5.3)

114

(1.9)

74

(1.2)

6,087

(100.0)

New York

71,729

(56.3)

22,123

(17.4)

11,801

(9.3)

8,069

(6.3)

6,005

(4.7)

2,974

(2.3)

4,736

(3.7)

127,437

(100.0)

City

57,716

(64.0)

13,035

(14.5)

6,677

(7.4)

5,000

(5.5)

4,626

(5.1)

2,226

(2.5)

877

(1.0)

90,157

(100.0)

State

14,013

(37.6)

9,088

(24.4)

5,124

(13.7)

3,069

(8.2)

1,379

(3.7)

748

(2.0)

3,859

(10.4)

37,280

(100.0)

North Carolina§

19,662

(56.0)

4,884

(13.9)

2,871

(8.2)

2,255

(6.4)

---

---

---

---

4,230

(12.1)

35,088

(100.0)

North Dakota§

718

(55.3)

305

(23.5)

192

(14.8)

79

(6.1)

---

---

---

---

0

(0)

1,298

(100.0)

Ohio§

17,955

(54.5)

6,329

(19.2)

3,533

(10.7)

2,602

(7.9)

1,545

(4.7)

510

(1.5)

462

(1.4)

32,936

(100.0)

Oklahoma§

4,366

(61.6)

1,343

(18.9)

648

(9.1)

454

(6.4)

262

(3.7)

---

---

---

---

7,088

(100.0)

Oregon§

7,337

(62.5)

1,778

(15.2)

1,087

(9.3)

633

(5.4)

541

(4.6)

230

(2.0)

126

(1.1)

11,732

(100.0)

Pennsylvania

21,396

(58.3)

7,238

(19.7)

3,712

(10.1)

2,722

(7.4)

1,416

(3.9)

247

(0.7)

0

(0)

36,731

(100.0)

Rhode Island

3,011

(62.4)

661

(13.7)

397

(8.2)

332

(6.9)

---

---

---

---

309

(6.4)

4,828

(100.0)

South Carolina§

5,240

(74.8)

1,033

(14.7)

633

(9.0)

75

(1.1)

11

(0.2)

13

(0.2)

0

(0)

7,005

(100.0)

South Dakota§

405

(54.1)

185

(24.7)

115

(15.4)

30

(4.0)

6

(0.8)

7

(0.9)

0

(0)

748

(100.0)

Tennessee

11,493

(64.3)

2,958

(16.5)

2,453

(13.7)

601

(3.4)

55

(0.3)

15

(0.1)

308

(1.7)

17,883

(100.0)

Texas§

58,037

(70.9)

11,263

(13.8)

5,732

(7.0)

5,335

(6.5)

965

(1.2)

551

(0.7)

0

(0)

81,883

(100.0)

Utah§

2,433

(64.8)

548

(14.6)

238

(6.3)

268

(7.1)

198

(5.3)

13

(0.3)

55

(1.5)

3,753

(100.0)

Vermont

1,083

(67.3)

283

(17.6)

145

(9.0)

81

(5.0)

13

(0.8)

5

(0.3)

0

(0)

1,610

(100.0)

Virginia§

18,486

(67.6)

4,818

(17.6)

2,773

(10.1)

848

(3.1)

218

(0.8)

45

(0.2)

161

(0.6)

27,349

(100.0)

Washington§

14,888

(60.5)

4,193

(17.0)

2,387

(9.7)

1,402

(5.7)

1,277

(5.2)

431

(1.8)

49

(0.2)

24,627

(100.0)

West Virginia

1,129

(55.5)

423

(20.8)

241

(11.8)

147

(7.2)

77

(3.8)

6

(0.3)

13

(0.6)

2,036

(100.0)

Wisconsin¶,§§

4,836

(51.7)

1,840

(19.7)

1,145

(12.2)

819

(8.8)

520

(5.6)

192

(2.1)

0

(0)

9,352

(100.0)

Wyoming

---

---

---

---

---

---

---

---

---

---

---

---

---

---

7

(100.0)

Total†††

402,618

(60.7)

111,277

(16.8)

60,602

(9.1)

41,859

(6.3)

22,904

(3.7)

8,360

(1.3)

13,933

(2.1)

662,895

(100.0)

Percentage of known values

(62.0)

(17.1)

(9.3)

(6.5)

(3.7)

(1.3)

* Data from 43 reporting areas; excludes three states (California, Louisiana, and New Hampshire) that did not report data and six states (Florida, Illinois, Maryland, Massachusetts, Mississippi and Nebraska) for which gestational age either was not reported or was reported as unknown for >15% of women.

Percentages for the individual component categories might not add up to 100.0 because of rounding.

§ Weeks of gestation based on physicians' estimates.

Weeks of gestation based on date of last menstrual period.

** Cells detail not displayed because of small numbers (N<5).

†† Numbers obtained at ≤12 weeks of gestation were redistributed according to the distribution among the remaining reporting areas.

§§ Includes residents only.

¶¶ Weeks of gestation based on date of last menstrual period only if physicians' estimates were unavailable.

*** Numbers do not include private physicians' procedures.

††† Small numbers (N<5) that have been removed from individual cells have been subtracted from the total.


TABLE 8. Reported abortions obtained at ≤8 weeks of gestation, by known weeks of gestation and state of occurrence --- selected states, United States, 2006*

Weeks

≤6

7

8

Total

State/Area

No.

(%)

No.

(%)

No.

(%)

No.

(%)

Alabama§

3,198

(27.4)

2,187

(18.8)

1,529

(13.1)

6,914

(59.3)

Alaska

482

(25.1)

355

(18.5)

316

(16.4)

1,153

(60.0)

Arizona§

2,903

(26.8)

2,330

(21.5)

1,704

(15.7)

6,937

(64.0)

Arkansas

1,576

(31.6)

675

(13.5)

634

(12.7)

2,885

(57.8)

Colorado§

3,938

(35.6)

1,795

(16.2)

1,560

(14.1)

7,293

(66.0)

Delaware§,**

1,071

(31.0)

584

(16.9)

489

(14.2)

2,144

(62.1)

District of Columbia

1,045

(38.8)

473

(17.6)

265

(9.8)

1,783

(66.2)

Georgia

6,557

(21.5)

5,909

(19.3)

4,660

(15.3)

17,126

(56.1)

Hawaii§

786

(19.7)

798

(20.0)

614

(15.4)

2,198

(55.1)

Idaho§

306

(24.5)

256

(20.5)

242

(19.4)

804

(64.4)

Indiana§

2,785

(26.2)

1,803

(17.0)

1,454

(13.7)

6,042

(56.9)

Iowa

3,085

(45.9)

1,085

(16.1)

670

(10.0)

4,840

(72.0)

Kansas

3,746

(33.5)

2,037

(18.2)

1,271

(11.4)

7,054

(63.1)

Kentucky

995

(25.4)

742

(19.0)

519

(13.3)

2,256

(57.7)

Maine††

852

(31.9)

533

(20.0)

393

(14.7)

1,778

(66.6)

Michigan

7,657

(29.9)

5,102

(19.9)

3,823

(14.9)

16,582

(64.7)

Minnesota§

3,861

(27.5)

2,995

(21.3)

2,057

(14.6)

8,913

(63.4)

Missouri

1,910

(25.3)

1,505

(19.9)

1,090

(14.4)

4,505

(59.6)

Montana§

517

(24.4)

350

(16.5)

300

(14.2)

1,167

(55.1)

Nevada§

2,962

(25.8)

1,385

(12.1)

1,591

(13.9)

5,938

(51.8)

New Jersey§, §§

8,131

(26.2)

5,251

(16.9)

4,402

(14.2)

17,784

(57.4)

New Mexico

1,919

(31.5)

913

(15.0)

854

(14.0)

3,686

(60.6)

New York

32,718

(25.7)

21,270

(16.7)

17,741

(13.9)

71,729

(56.3)

City

30,036

(33.3)

15,884

(17.6)

11,796

(13.1)

57,716

(64.0)

State

2,682

(7.2)

5,386

(14.4)

5,945

(15.9)

14,013

(37.6)

North Carolina§

8,959

(25.5)

6,235

(17.8)

4,468

(12.7)

19,662

(56.0)

North Dakota§

128

(9.9)

298

(23.0)

292

(22.5)

718

(55.3)

Ohio§

7,911

(24.0)

5,340

(16.2)

4,704

(14.3)

17,955

(54.5)

Oklahoma§

2,371

(33.5)

1,127

(15.9)

868

(12.2)

4,366

(61.6)

Oregon§

3,670

(31.3)

2,094

(17.8)

1,573

(13.4)

7,337

(62.5)

Pennsylvania

8,711

(23.7)

6,587

(17.9)

6,098

(16.6)

21,396

(58.3)

Rhode Island

1,598

(33.1)

850

(17.6)

563

(11.7)

3,011

(62.4)

South Carolina§

3,045

(43.5)

1,307

(18.7)

888

(12.7)

5,240

(74.8)

South Dakota§

107

(14.3)

157

(21.0)

141

(18.9)

405

(54.1)

Tennessee

5,205

(29.1)

3,918

(21.9)

2,370

(13.3)

11,493

(64.3)

Texas§

33,878

(41.4)

13,640

(16.7)

10,519

(12.8)

58,037

(70.9)

Utah§

1,084

(28.9)

868

(23.1)

481

(12.8)

2,433

(64.8)

Vermont

490

(30.4)

328

(20.4)

265

(16.5)

1,083

(67.3)

Virginia§

8,554

(31.3)

5,507

(20.1)

4,425

(16.2)

18,486

(67.6)

Washington§

6,387

(25.9)

5,074

(20.6)

3,427

(13.9)

14,888

(60.5)

West Virginia

365

(17.9)

413

(20.3)

351

(17.2)

1,129

(55.5)

Wyoming

---¶¶

---

---

---

---

---

---

---

Total***

185,463

(29.0)

114,076

(17.8)

89,611

(14.0)

389,150

(60.9)

Percentage of known values

(29.6)

(18.2)

(14.3)

(62.2)

* Data from 41 reporting areas; excludes three states (California, Louisiana, and New Hampshire) that did not report data, two states (Connecticut and Wisconsin) that did not provide component weeks of gestation for abortions obtained at ≤8 weeks gestation; and six states (Florida, Illinois, Maryland, Massachusetts, Mississippi, and Nebraska) for which gestational age either was not reported or was reported as unknown for >15% of women.

Percentages might not add up to the total percentage obtained at ≤8 weeks because of rounding.

§ Weeks of gestation based on physicians' estimates.

Weeks of gestation based on date of last menstrual period.

** Includes residents only.

†† Weeks of gestation based on date of last menstrual period only if physicians' estimates were unavailable.

§§ Numbers do not include private physicians' procedures.

¶¶ Cell detail not displayed because of small numbers (N<5).

*** Small numbers (N<5) that have been removed from individual cells have been subtracted from the total.


TABLE 9. Reported abortions, by type of procedure and state of occurrence --- selected states, United States, 2006*

Procedure

Curettage

Intrauterine
instillation

Medical

Other

Unknown

Total

State/Area

No.

(%)

No.

(%)

No.

(%)

No.

(%)

No.

(%)

No.

(%)§

Alabama

10,328

(88.6)

6

(0.1)

NA**

NA

1,309

(11.2)

11

(0.1)

11,654

(100.0)

Alaska

1,491

(77.5)

0

(0)

422

(21.9)

10

(0.5)

0

(0)

1,923

(100.0)

Arizona

7,470

(68.9)

---††

---

3,158

(29.1)

---

---

206

(1.9)

10,836

(100.0)

Arkansas

4,982

(99.9)

---

---

5

(0.1)

---

---

0

(0)

4,988

(100.0)

Colorado

8,409

(76.1)

---

---

2,365

(21.4)

273

(2.5)

---

---

11,048

(100.0)

Connecticut

11,832

(83.8)

---

---

2,277

(16.1)

---

---

0

(0)

14,112

(100.0)

Delaware§§

2,845

(82.4)

6

(0.2)

596

(17.3)

---

---

---

---

3,451

(100.0)

District of Columbia

2,237

(83.1)

0

(0)

445

(16.5)

10

(0.4)

0

(0)

2,692

(100.0)

Georgia

27,979

(91.6)

0

(0)

0

(0)

0

(0)

2,571

(8.4)

30,550

(100.0)

Hawaii

3,977

(99.7)

---

---

---

---

0

(0)

11

(0.3)

3,990

(100.0)

Idaho

1,045

(83.7)

---

---

198

(15.9)

---

---

0

(0)

1,249

(100.0)

Indiana

9,133

(86.0)

0

(0)

1,091

(10.3)

139

(1.3)

251

(2.4)

10,614

(100.0)

Iowa

4,680

(69.6)

---

---

1,916

(28.5)

125

(1.9)

---

---

6,722

(100.0)

Kansas

9,634

(86.2)

---

---

1,166

(10.4)

372

(3.3)

---

---

11,173

(100.0)

Maine

2,395

(89.7)

0

(0)

275

(10.3)

0

(0)

0

(0)

2,670

(100.0)

Maryland¶, §§

6,959

(85.5)

0

(0)

NA

NA

696

(8.6)

484

(5.9)

8,139

(100.0)

Massachusetts

16,376

(67.5)

2,482

(10.2)

3,701

(15.3)

1,687

(7.0)

0

(0)

24,246

(100.0)

Michigan

23,000

(89.7)

25

(0.1)

2,597

(10.1)

9

(0)

5

(0)

25,636

(100.0)

Minnesota

12,390

(88.1)

9

(0.1)

1,642

(11.7)

24

(0.2)

0

(0)

14,065

(100.0)

Mississippi

2,949

(100.0)

0

(0)

0

(0)

0

(0)

0

(0)

2,949

(100.0)

Missouri

6,216

(82.3)

---

---

1,318

(17.4)

20

(0.3)

---

---

7,556

(100.0)

Montana

1,887

(89.1)

0

(0)

0

(0)

232

(10.9)

0

(0)

2,119

(100.0)

Nebraska

2,828

(96.6)

0

(0)

99

(3.4)

0

(0)

0

(0)

2,927

(100.0)

Nevada

11,048

(96.3)

---

---

0

(0)

---

---

421

(3.7)

11,471

(100.0)

New Jersey¶¶

30,230

(97.6)

8

(0)

532

(1.7)

216

(0.7)

0

(0)

30,986

(100.0)

New Mexico

5,080

(83.5)

---

---

646

(10.6)

---

---

357

(5.9)

6,087

(100.0)

New York

116,134

(90.5)

65

(0)

11,169

(8.7)

457

(0.4)

490

(0.4)

128,315***

(100.0)

City

82,529

(91.5)

21

(0)

7,006

(7.8)

111

(0.1)

490

(0.5)

90,157

(100.0)

State

33,605

(88.1)

44

(0.1)

4,163

(10.9)

346

(0.9)

0

(0)

38,158***

(100.0)

North Carolina

30,087

(85.7)

249

(0.7)

3,214

(9.2)

29

(0.1)

1,509

(4.3)

35,088

(100.0)

North Dakota

1,298

(100.0)

0

(0)

0

(0)

0

(0)

0

(0)

1,298

(100.0)

Ohio

27,197

(82.4)

318

(1.0)

4,673

(14.1)

549

(1.7)

288

(0.9)

33,025***

(100.0)

Oklahoma

5,919

(83.5)

0

(0)

785

(11.1)

384

(5.4)

0

(0)

7,088

(100.0)

Oregon

9,741

(83.0)

7

(0.1)

1,966

(16.8)

6

(0.1)

12

(0.1)

11,732

(100.0)

Pennsylvania

32,516

(88.5)

5

(0)

4,181

(11.4)

29

(0.1)

0

(0)

36,731

(100.0)

Rhode Island

4,574

(94.7)

0

(0)

204

(4.2)

6

(0)

44

(0.9)

4,828

(100.0)

South Carolina

5,144

(73.4)

---

---

1,855

(26.5)

5

(0.1)

---

---

7,005

(100.0)

South Dakota

644

(86.1)

0

(0)

104

(13.9)

0

(0)

0

(0)

748

(100.0)

Tennessee

15,429

(86.3)

44

(0.2)

0

(0)

2,277

(12.7)

133

(0.7)

17,883

(100.0)

Texas

68,401

(83.5)

11

(0)

13,464

(16.4)

7

(0)

0

(0)

81,883

(100.0)

Utah

2,685

(71.5)

0

(0)

1,063

(28.3)

---

---

---

---

3,753

(100.0)

Vermont

1,343

(83.4)

0

(0)

265

(16.5)

---

---

---

---

1,610

(100.0)

Virginia

25,580

(93.5)

7

(0)

1,591

(5.8)

149

(0.5)

22

(0.1)

27,349

(100.0)

Washington

21,235

(86.2)

25

(0.1)

3,360

(13.6)

7

(0)

0

(0)

24,627

(100.0)

West Virginia

1,882

(92.4)

---

---

60

(2.9)

---

---

93

(4.6)

2,036

(100.0)

Wyoming

7

(100.0)

0

(0)

0

(0)

0

(0)

0

(0)

7

(100.0)

Total†††

597,216

(86.7)

3,264

(0.5)

72,403

(10.5)

9,027

(1.3)

6,908

(1.0)

688,859

(100.0)

Percentage of known values

(87.6)

(0.5)

(10.6)

(1.3)

(1.0)

* Data from 45 reporting areas; excludes three states (California, Louisiana, and New Hampshire) that did not report data and four states (Florida, Illinois, Kentucky, and Wisconsin) for which procedure type either was not reported or was reported as unknown for >15% of women.

Includes hysterotomy/hysterectomy and procedures reported as "other."

§ Percentages for the individual component categories might not add up to 100.0% because of rounding.

¶ Medical abortion not reported separately.

** Not available.

†† Cells detail not displayed because of small numbers (N<5).

§§ Includes residents only.

¶¶ Numbers do not include private physicians' procedures.

***Exceeds the total number of abortions reported for other variables because of some reported combination procedures.

††† Small numbers (N<5) that have been removed from individual cells have been subtracted from the total.


TABLE 10. Reported abortions, by race of women who obtained an abortion and state of occurrence --- selected states, United States, 2006*

Race

White

Black

Other

Unknown

Total

State/Area

No.

(%)

No.

(%)

No.

(%)

No.

(%)

No.

(%)

Alabama

4,930

(42.3)

6,523

(56.0)

196

(1.7)

5

(0)

11,654

(100.0)

Alaska

1,112

(57.8)

141

(7.3)

557

(29.0)

113

(5.9)

1,923

(100.0)

Arkansas

3,079

(61.7)

1,527

(30.6)

374

(7.5)

8

(0.2)

4,988

(100.0)

Colorado

7,427

(67.2)

690

(6.2)

2,373

(21.5)

558

(5.1)

11,048

(100.0)

Delaware§

1,857

(53.8)

1,433

(41.5)

144

(4.2)

17

(0.5)

3,451

(100.0)

District of Columbia

565

(21.0)

1,413

(52.5)

703

(26.1)

11

(0.4)

2,692

(100.0)

Georgia

11,573

(37.9)

17,544

(57.4)

1,433

(4.7)

0

(0)

30,550

(100.0)

Hawaii

960

(24.1)

142

(3.6)

2,442

(61.2)

446

(11.2)

3,990

(100.0)

Idaho

1,133

(90.7)

14

(1.1)

66

(5.3)

36

(2.9)

1,249

(100.0)

Indiana

6,805

(64.1)

3,045

(28.7)

315

(3.0)

449

(4.2)

10,614

(100.0)

Iowa

5,332

(79.3)

666

(9.9)

194

(2.9)

530

(7.9)

6,722

(100.0)

Kansas

7,617

(68.2)

2,398

(21.5)

1,150

(10.3)

8

(0.1)

11,173

(100.0)

Kentucky

2,606

(66.6)

848

(21.7)

289

(7.4)

169

(4.3)

3,912

(100.0)

Maine

2,403

(90.0)

51

(1.9)

192

(7.2)

24

(0.9)

2,670

(100.0)

Maryland§

1,665

(20.5)

5,482

(67.4)

948

(11.6)

44

(0.5)

8,139

(100.0)

Massachusetts

12,136

(50.1)

4,653

(19.2)

3,956

(16.3)

3,501

(14.4)

24,246

(100.0)

Michigan

13,710

(53.5)

10,134

(39.5)

1,012

(3.9)

780

(3.0)

25,636

(100.0)

Minnesota

8,847

(62.9)

3,059

(21.7)

1,883

(13.4)

276

(2.0)

14,065

(100.0)

Mississippi

665

(22.6)

2,250

(76.3)

28

(0.9)

6

(0.2)

2,949

(100.0)

Missouri

4,140

(54.8)

3,032

(40.1)

367

(4.9)

17

(0.2)

7,556

(100.0)

Montana

1,699

(80.2)

14

(0.7)

194

(9.2)

212

(10.0)

2,119

(100.0)

New Jersey

9,851

(31.8)

13,811

(44.6)

7,253

(23.4)

71

(0.2)

30,986

(100.0)

New York

59,897

(47.0)

52,121

(40.9)

7,164

(5.6)

8,255

(6.5)

127,437

(100.0)

City

37,903

(42.0)

43,125

(47.8)

5,765

(6.4)

3,364

(3.7)

90,157

(100.0)

State

21,994

(59.0)

8,996

(24.1)

1,399

(3.8)

4,891

(13.1)

37,280

(100.0)

North Carolina

14,412

(41.1)

15,917

(45.4)

1,233

(3.5)

3,526

(10.0)

35,088

(100.0)

North Dakota

1,061

(81.7)

48

(3.7)

181

(13.9)

8

(0.6)

1,298

(100.0)

Ohio

18,724

(56.8)

11,683

(35.5)

774

(2.4)

1,755

(5.3)

32,936

(100.0)

Oklahoma

5,105

(72.0)

1,329

(18.8)

654

(9.2)

0

(0)

7,088

(100.0)

Oregon

9,864

(84.2)

665

(5.7)

1,030

(8.8)

158

(1.3)

11,717

(100.0)

Pennsylvania

20,522

(55.9)

14,303

(38.9)

1,894

(5.2)

12

(0)

36,731

(100.0)

Rhode Island

3,117

(64.6)

732

(15.2)

269

(5.6)

710

(14.7)

4,828

(100.0)

South Carolina

4,126

(58.9)

2,696

(38.5)

---**

---

---

---

7,005

(100.0)

South Dakota

628

(84.0)

---

---

89

(11.9)

---

---

748

(100.0)

Tennessee

8,760

(49.0)

8,226

(46.0)

459

(2.6)

438

(2.4)

17,883

(100.0)

Texas

57,777

(70.6)

19,026

(23.2)

4,689

(5.7)

391

(0.5)

81,883

(100.0)

Vermont

1,525

(94.7)

36

(2.2)

41

(2.5)

8

(0.5)

1,610

(100.0)

Virginia

12,166

(44.5)

11,442

(41.8)

2,130

(7.8)

1,611

(5.9)

27,349

(100.0)

West Virginia

1,733

(85.1)

229

(11.2)

74

(3.6)

0

(0)

2,036

(100.0)

Wisconsin§

6,460

(69.1)

2,275

(24.3)

NA††

NA

617

(6.6)

9,352

(100.0)

Total§§

335,989

(53.6)

219,598

(35.0)

46,750

(7.5)

24,770

(3.9)

627,321

(100.0)

Percentage of known values

(55.8)

(36.4)

(7.8)

Abortion rate¶¶

10.8

33.9

18.3

15.0

Abortion ratio***

162

459

310

223

* Data from 39 reporting areas; excludes three states (California, Louisiana, and New Hampshire) that did not report data and ten states (Arizona, Connecticut, Florida, Illinois, Nebraska, Nevada, New Mexico, Utah, Washington, and Wyoming) for which race either was not reported or was reported as unknown for >15% of women.

Percentages for the individual component categories might not add up to 100.0 because of rounding.

§ Includes residents only.

Numbers do not include private physicians' procedures.

** Cell details not displayed because of small numbers (N<5).

†† Data not available because women of "other" races were combined in the same category as women of unknown race.

§§ Small numbers (N<5) that have been removed from individual cells have been subtracted from the total.

¶¶ Calculated as the number of abortions obtained by women in a given racial group per 1,000 women in that same group. For each state, abortions for women of unknown race were distributed according to the distribution of abortions among women of known race for that state.

*** Calculated as the number of abortions obtained by women in a given racial group per 1,000 live births to women in that same racial group. For each state, abortions for women of unknown race were distributed according to the distribution of abortions among women of known race for that state.


TABLE 11. Reported abortions, by race of women who obtained an abortion* --- selected states, United States, 1997--2006

% change during

Race

1997

1998

1999

2000

2001

2002

2003

2004

2005

2006

2005--2006

1997--2006

% of abortions

White

56.7

56.2

55.2

54.4

54.2

54.5

54.7

54.3

53.9

53.8

-0.3

-5.3

Black

37.4

37.8

38.4

38.9

38.4

38.3

38.0

38.3

38.7

38.5

-0.4

2.9

Other

5.8

6.1

6.5

6.7

7.4

7.2

7.3

7.4

7.4

7.7

4.1

32.7

Abortion rate§

White

12.4

12.2

11.7

11.0

11.0

11.0

11.0

10.7

10.5

10.8

2.7

-12.4

Black

37.5

36.9

36.5

35.1

34.8

34.4

34.2

33.4

33.1

33.4

0.8

-10.9

Other

25.6

25.8

26.2

22.5

20.3

19.2

19.2

18.5

17.7

18.8

5.9

-26.8

Abortion ratio

White

199

192

182

170

169

168

166

161

158

158

-0.2

-20.9

Black

546

532

530

505

510

515

507

489

469

450

-4.2

-17.7

Other

384

382

381

347

375

345

337

319

311

315

1.1

-18.1

Total no. abortions

563,367

558,943

544,840

527,574

524,192

519,625

520,357

508,565

501,944

514,144

* Excludes women for whom race was reported as unknown.

Data from 29 reporting areas; by year, these areas represent 62%--65% of the abortions reported by the 46 reporting areas that provided data every year during 1997--2006. Excludes three states (California, Louisiana, and New Hampshire) that did not report data and 20 states (Alaska, Arizona, Connecticut, Florida, Illinois, Iowa, Maine, Massachusetts, Michigan, Nebraska, Nevada, New Mexico, New York (excluding New York City), Oklahoma, Rhode Island, South Dakota, Utah, Washington, West Virginia, and Wyoming) that did not provide numbers by race meeting reporting standards for ≥1 year.

§ Calculated as the number of abortions obtained by women in a given racial group per 1,000 women in that same group. For each state, abortions for women of unknown race were distributed according to the distribution of abortions among women of known race for that state.

Calculated as the number of abortions obtained by women in a given racial group per 1,000 live births to women in that same racial group. For each state, abortions for women of unknown race were distributed according to the distribution of abortions among women of known race for that state.


TABLE 12. Reported abortions, by ethnicity of women who obtained an abortion and state of occurrence --- selected states, United States, 2006*

Ethnicity

Hispanic

Non-Hispanic

Unknown

Total

State/Area

No.

(%)

No.

(%)

No.

(%)

No.

(%)

Alabama

---§

---

11,261

(96.6)

---

---

11,654

(100.0)

Arizona

4,112

(37.9)

6,714

(62.0)

10

(0.1)

10,836

(100.0)

Arkansas

248

(5.0)

4,728

(94.8)

12

(0.2)

4,988

(100.0)

Colorado

2,467

(22.3)

7,367

(66.7)

1,214

(11.0)

11,048

(100.0)

Delaware

385

(11.2)

3,032

(87.9)

34

(1.0)

3,451

(100.0)

District of Columbia

370

(13.7)

2,314

(86.0)

8

(0.3)

2,692

(100.0)

Georgia

1,729

(5.7)

25,006

(81.9)

3,815

(12.5)

30,550

(100.0)

Hawaii

265

(6.6)

3,418

(85.7)

307

(7.7)

3,990

(100.0)

Idaho

136

(10.9)

1,104

(88.4)

9

(0.7)

1,249

(100.0)

Indiana

798

(7.5)

8,398

(79.1)

1,418

(13.4)

10,614

(100.0)

Kansas

1,178

(10.5)

9,926

(88.8)

69

(0.6)

11,173

(100.0)

Maine

61

(2.3)

2,254

(84.4)

355

(13.3)

2,670

(100.0)

Minnesota

796

(5.7)

13,163

(93.6)

106

(0.8)

14,065

(100.0)

Mississippi

35

(1.2)

2,914

(98.8)

0

(0)

2,949

(100.0)

Missouri

233

(3.1)

7,285

(96.4)

38

(0.5)

7,556

(100.0)

New Jersey

8,348

(26.9)

22,586

(72.9)

52

(0.2)

30,986

(100.0)

New Mexico

3,097

(50.9)

2,522

(41.4)

468

(7.7)

6,087

(100.0)

New York

34,502

(27.1)

85,254

(66.9)

7,681

(6.0)

127,437

(100.0)

City

29,678

(32.9)

57,664

(64.0)

2,815

(3.1)

90,157

(100.0)

State

4,824

(12.9)

27,590

(74.0)

4,866

(13.1)

37,280

(100.0)

Ohio

1,186

(3.6)

31,281

(95.0)

469

(1.4)

32,936

(100.0)

Oregon

1,339

(11.4)

10,331

(88.2)

47

(0.4)

11,717

(100.0)

Pennsylvania

2,210

(6.0)

34,509

(94.0)

12

(0)

36,731

(100.0)

South Carolina

---

---

6,630

(94.6)

---

---

7,005

(100.0)

South Dakota

39

(5.2)

709

(94.8)

0

(0)

748

(100.0)

Tennessee

774

(4.3)

16,968

(94.9)

141

(0.8)

17,883

(100.0)

Texas

30,019

(36.7)

51,473

(62.9)

391

(0.5)

81,883

(100.0)

Utah

901

(24.0)

2,530

(67.4)

322

(8.6)

3,753

(100.0)

Vermont

35

(2.2)

1,565

(97.2)

10

(0.6)

1,610

(100.0)

West Virginia

---

---

2,023

(99.4)

---

---

2,036

(100.0)

Wisconsin

853

(9.1)

8,499

(90.9)

0

(0)

9,352

(100.0)

Wyoming

---

---

---

---

---

---

7

(100.0)

Total**

96,116

(19.4)

385,764

(77.2)

16,988

(3.4)

499,656

(100.0)

Percentage of known values

(20.1)

(79.9)

Abortion rate††

21.1

14.1

15.1

Abortion ratio§§

200

224

218

* Data from 31 reporting areas; excludes three states (California, Louisiana, and New Hampshire) that did not report data and 18 states (Alaska, Connecticut, Florida, Illinois, Iowa, Kentucky, Maryland, Massachusetts, Michigan, Montana, Nebraska, Nevada, North Carolina, North Dakota, Oklahoma, Rhode Island, Virginia, and Washington) for which ethnicity either was not reported or was reported as unknown for >15% of women.

Percentages for the individual component categories might not add up to 100.0% because of rounding.

§ Cell detail not displayed because of small numbers (N<5).

Numbers do not include private physicians' procedures.

** Small numbers (N<5) that have been removed from individual cells have been subtracted from the total.

†† Calculated as the number of abortions obtained by women in a given ethnic group per 1,000 women in that same group. For each state, abortions for women of unknown ethnicity were distributed according to the distribution of abortions among women of known ethnicity for that state.

§§ Calculated as the number of abortions obtained by women in a given ethnic group per 1,000 live births to women in that same ethnic group. For each state, abortions for women of unknown ethnicity were distributed according to the distribution of abortions among women of known ethnicity for that state.


TABLE 13. Reported abortions, by ethnicity of women who obtained an abortion* --- selected states, United States, 1997--2006† 

% change during

Ethnicity

1997

1998

1999

2000

2001

2002

2003

2004

2005

2006

2005--2006

1997--2006

% of abortions

Hispanic

17.0

17.6

18.6

18.6

19.3

20.2

20.3

20.3

20.2

21.0

4.0

23.6

Non-Hispanic

83.0

82.4

81.4

81.4

80.7

79.8

79.7

79.7

79.8

79.0

-1.0

-4.8

Abortion rate§

Hispanic

28.7

29.2

29.1

25.0

24.9

25.0

24.4

23.2

22.2

23.2

4.7

-19.1

Non-Hispanic

16.7

16.6

16.0

15.5

15.4

15.1

15.0

14.7

14.6

15.0

2.5

-10.3

Abortion ratio

Hispanic

292

293

287

261

258

256

246

234

221

223

0.9

-23.5

Non-Hispanic

279

273

263

251

254

250

245

240

237

235

-0.7

-15.6

Total no. abortions

416,870

417,448

406,311

394,234

393,610

388,098

385,579

375,865

370,382

381,098

* Excludes women for whom ethnicity was reported as unknown.

Data from 19 reporting areas; by year, these reporting areas represent 46%--48% of the abortions reported by the 46 reporting areas that provided data every year during 1997--2006. Excludes three states (California, Louisiana, and New Hampshire) that did not report data and 30 reporting areas (Alaska, Arizona, Colorado, Connecticut, the District of Columbia, Florida, Georgia, Hawaii, Illinois, Indiana, Iowa, Kentucky, Maine, Maryland, Massachusetts, Michigan, Montana, Nebraska, Nevada, New Mexico, New York [excluding New York City], North Carolina, North Dakota, Oklahoma, Rhode Island, South Dakota, Virginia, Washington, West Virginia, and Wyoming) that did not provide numbers by ethnicity meeting reporting standards for ≥1 year.

§ Calculated as the number of abortions obtained by women in a given ethnic group per 1,000 live births to women in that same ethnic group. For each state, abortions for women of unknown ethnicity were distributed according to the distribution of abortions among women of known ethnicity for that state.

Calculated as the number of abortions obtained by women in a given ethnic group per 1,000 women in that same group. For each state, abortions for women of unknown ethnicity were distributed according to the distribution of abortions among women of known ethnicity for that state.


TABLE 14. Reported abortions, by marital status of women who obtained an abortion and state of occurrence --- selected states, United States, 2006*

Marital status

Married

Unmarried

Unknown

Total

State/Area

No.

(%)

No.

(%)

No.

(%)

No.

(%)

Alabama

1,351

(11.6)

10,234

(87.8)

69

(0.6)

11,654

(100.0)

Alaska

338

(17.6)

1,532

(79.7)

53

(2.8)

1,923

(100.0)

Arizona

1,831

(16.9)

9,005

(83.1)

0

(0)

10,836

(100.0)

Colorado

1,954

(17.7)

8,736

(79.1)

358

(3.2)

11,048

(100.0)

Delaware§

393

(11.4)

2,987

(86.6)

71

(2.1)

3,451

(100.0)

District of Columbia

268

(10.0)

2,412

(89.6)

12

(0.4)

2,692

(100.0)

Georgia

5,197

(17.0)

23,650

(77.4)

1,703

(5.6)

30,550

(100.0)

Hawaii

548

(13.7)

3,431

(86.0)

11

(0.3)

3,990

(100.0)

Idaho

256

(20.5)

993

(79.5)

0

(0)

1,249

(100.0)

Illinois§

6,189

(15.3)

33,473

(82.8)

750

(1.9)

40,412

(100.0)

Indiana

1,705

(16.1)

8,670

(81.7)

239

(2.3)

10,614

(100.0)

Iowa

1,139

(16.9)

5,561

(82.7)

22

(0.3)

6,722

(100.0)

Kansas

---

---

9,226

(82.6)

---

---

11,173

(100.0)

Kentucky

589

(15.1)

3,323

(84.9)

0

(0)

3,912

(100.0)

Maine

386

(14.5)

2,186

(81.9)

98

(3.7)

2,670

(100.0)

Maryland§

1,460

(17.9)

6,437

(79.1)

242

(3.0)

8,139

(100.0)

Massachusetts

3,344

(13.8)

18,846

(77.7)

2,056

(8.5)

24,246

(100.0)

Michigan

3,224

(12.6)

22,233

(86.7)

179

(0.7)

25,636

(100.0)

Minnesota

2,300

(16.4)

11,639

(82.8)

126

(0.9)

14,065

(100.0)

Mississippi

---

---

2,714

(92.0)

---

---

2,949

(100.0)

Missouri

1,345

(17.8)

6,100

(80.7)

111

(1.5)

7,556

(100.0)

Montana

313

(14.8)

1,561

(73.7)

245

(11.6)

2,119

(100.0)

Nevada

2,252

(19.6)

8,548

(74.5)

671

(5.8)

11,471

(100.0)

New Jersey**

4,200

(13.6)

26,764

(86.4)

22

(0.1)

30,986

(100.0)

New Mexico

876

(14.4)

5,065

(83.2)

146

(2.4)

6,087

(100.0)

New York City

12,753

(14.1)

75,381

(83.6)

2,023

(2.2)

90,157

(100.0)

North Carolina

7,106

(20.3)

26,110

(74.4)

1,872

(5.3)

35,088

(100.0)

North Dakota

176

(13.6)

1,116

(86.0)

6

(0.5)

1,298

(100.0)

Ohio

4,926

(15.0)

26,817

(81.4)

1,193

(3.6)

32,936

(100.0)

Oklahoma

1,473

(20.8)

5,615

(79.2)

0

(0)

7,088

(100.0)

Oregon

2,277

(19.4)

9,060

(77.3)

380

(3.2)

11,717

(100.0)

Pennsylvania

5,370

(14.6)

31,355

(85.4)

6

(0)

36,731

(100.0)

Rhode Island

815

(16.9)

3,839

(79.5)

174

(3.6)

4,828

(100.0)

South Carolina

1,129

(16.1)

5,865

(83.7)

11

(0.2)

7,005

(100.0)

South Dakota

114

(15.2)

634

(84.8)

0

(0)

748

(100.0)

Tennessee

2,776

(15.5)

14,549

(81.4)

558

(3.1)

17,883

(100.0)

Texas

15,053

(18.4)

66,019

(80.6)

811

(1.0)

81,883

(100.0)

Utah

893

(23.8)

2,406

(64.1)

454

(12.1)

3,753

(100.0)

Vermont

277

(17.2)

1,297

(80.6)

36

(2.2)

1,610

(100.0)

Virginia

4,918

(18.0)

19,567

(71.5)

2,864

(10.5)

27,349

(100.0)

West Virginia

358

(17.6)

1,649

(81.0)

29

(1.4)

2,036

(100.0)

Wisconsin§

1,342

(14.3)

7,998

(85.5)

12

(0.1)

9,352

(100.0)

Wyoming

---

---

---

---

---

---

7

(100.0)

Total††

103,214

(16.0)

534,603

(81.3)

17,613

(2.7)

657,619

(100.0)

Percentage of known values

(16.5)

(83.5)

* Data from 43 reporting areas; excludes three states (California, Louisiana, and New Hampshire) that did not report data and six states (Arkansas, Connecticut, Florida, Nebraska, New York [excluding New York City], and Washington) for which marital status either was not reported or was reported as unknown for >15% of women.

Percentages for the individual component categories may not add up to 100.0 because of rounding.

§ Includes residents only.

Cell details not displayed because of small numbers (N<5).

** Numbers do not include private physicians' procedures.

†† Small numbers (N<5) that have been removed from individual cells have been subtracted from the total.


TABLE 15. Reported abortions, by number of previous live births and state of occurrence --- selected states, United States, 2006*

No. of previous live births

0

1

2

3

≥4

Unknown

Total

State/Area

No.

(%)

No.

(%)

No.

(%)

No.

(%)

No.

(%)

No.

(%)

No.

(%)

Alabama

4,608

(39.5)

3,455

(29.6)

2,360

(20.3)

851

(7.3)

363

(3.1)

17

(0.1)

11,654

(100.0)

Alaska

845

(43.9)

457

(23.8)

340

(17.7)

156

(8.1)

109

(5.7)

16

(0.8)

1,923

(100.0)

Arizona

4,959

(45.8)

2,428

(22.4)

1,938

(17.9)

918

(8.5)

574

(5.3)

19

(0.2)

10,836

(100.0)

Arkansas

1,940

(38.9)

1,439

(28.8)

1,035

(20.7)

407

(8.2)

---§

---

---

---

4,988

(100.0)

Colorado

5,550

(50.2)

2,383

(21.6)

1,792

(16.2)

765

(6.9)

355

(3.2)

203

(1.8)

11,048

(100.0)

Delaware

1,396

(40.5)

978

(28.3)

635

(18.4)

285

(8.3)

---

---

---

---

3,451

(100.0)

Georgia

11,841

(38.8)

8,497

(27.8)

6,170

(20.2)

2,568

(8.4)

1,454

(4.8)

20

(0.1)

30,550

(100.0)

Hawaii

1,894

(47.5)

870

(21.8)

649

(16.3)

317

(7.9)

193

(4.8)

67

(1.7)

3,990

(100.0)

Idaho

629

(50.4)

254

(20.3)

195

(15.6)

111

(8.9)

53

(4.2)

7

(0.6)

1,249

(100.0)

Indiana

3,655

(34.4)

2,563

(24.1)

2,010

(18.9)

911

(8.6)

539

(5.1)

936

(8.8)

10,614

(100.0)

Iowa

2,963

(44.1)

1,583

(23.5)

1,282

(19.1)

616

(9.2)

267

(4.0)

11

(0.2)

6,722

(100.0)

Kansas

4,536

(40.6)

2,850

(25.5)

2,308

(20.7)

1,000

(9.0)

479

(4.3)

0

(0)

11,173

(100.0)

Kentucky

1,586

(40.5)

1,095

(28.0)

817

(20.9)

277

(7.1)

137

(3.5)

0

(0)

3,912

(100.0)

Maine

1,462

(54.8)

560

(21.0)

453

(17.0)

144

(5.4)

51

(1.9)

0

(0)

2,670

(100.0)

Maryland,**

2,819

(34.6)

2,458

(30.2)

1,752

(21.5)

757

(9.3)

353

(4.3)

0

(0)

8,139

(100.0)

Michigan

10,344

(40.3)

6,681

(26.1)

5,103

(19.9)

2,249

(8.8)

1,259

(4.9)

0

(0)

25,636

(100.0)

Minnesota

6,032

(42.9)

3,382

(24.0)

2,674

(19.0)

1,247

(8.9)

714

(5.1)

16

(0.1)

14,065

(100.0)

Mississippi

970

(32.9)

988

(33.5)

670

(22.7)

227

(7.7)

---

---

---

---

2,949

(100.0)

Missouri

3,062

(40.5)

2,055

(27.2)

1,427

(18.9)

639

(8.5)

373

(4.9)

0

(0)

7,556

(100.0)

Montana

1,097

(51.8)

449

(21.2)

356

(16.8)

151

(7.1)

66

(3.1)

0

(0)

2,119

(100.0)

Nebraska

1,118

(38.2)

804

(27.5)

595

(20.3)

280

(9.6)

---

---

---

---

2,927

(100.0)

Nevada

4,615

(40.2)

2,776

(24.2)

2,185

(19.0)

1,052

(9.2)

611

(5.3)

232

(2.0)

11,471

(100.0)

New Jersey††

12,879

(41.6)

8,288

(26.7)

5,679

(18.3)

2,460

(7.9)

1,669

(5.4)

11

(0)

30,986

(100.0)

New York

54,689

(42.9)

32,034

(25.1)

23,007

(18.1)

9,730

(7.6)

5,695

(4.5)

2,282

(1.8)

127,437

(100.0)

City

35,520

(39.4)

24,111

(26.7)

17,059

(18.9)

7,166

(7.9)

4,019

(4.5)

2,282

(2.5)

90,157

(100.0)

State

19,169

(51.4)

7,923

(21.3)

5,948

(16.0)

2,564

(6.9)

1,676

(4.5)

0

(0)

37,280

(100.0)

North Dakota

534

(41.1)

364

(28.0)

227

(17.5)

112

(8.6)

61

(4.7)

0

(0)

1,298

(100.0)

Ohio

11,488

(34.9)

9,040

(27.4)

6,740

(20.5)

2,768

(8.4)

1,381

(4.2)

1,519

(4.6)

32,936

(100.0)

Oklahoma**

2,681

(37.8)

1,950

(27.5)

1,571

(22.2)

622

(8.8)

264

(3.7)

0

(0)

7,088

(100.0)

Oregon

5,503

(46.9)

2,793

(23.8)

2,103

(17.9)

854

(7.3)

420

(3.6)

59

(0.5)

11,732

(100.0)

Pennsylvania

15,205

(41.4)

9,877

(26.9)

7,049

(19.2)

2,984

(8.1)

1,616

(4.4)

0

(0)

36,731

(100.0)

Rhode Island**

2,003

(41.5)

1,331

(27.6)

829

(17.2)

345

(7.1)

166

(3.4)

154

(3.2)

4,828

(100.0)

South Carolina

3,102

(44.3)

1,950

(27.8)

1,336

(19.1)

447

(6.4)

---

---

---

---

7,005

(100.0)

South Dakota**

334

(44.7)

180

(24.1)

141

(18.9)

66

(8.8)

27

(3.6)

0

(0)

748

(100.0)

Tennessee

6,013

(33.6)

5,163

(28.9)

3,828

(21.4)

1,616

(9.0)

964

(5.4)

299

(1.7)

17,883

(100.0)

Texas

31,466

(38.4)

22,088

(27.0)

17,235

(21.0)

7,395

(9.0)

3,650

(4.5)

49

(0.1)

81,883

(100.0)

Utah

1,543

(41.1)

887

(23.6)

707

(18.8)

359

(9.6)

200

(5.3)

57

(1.5)

3,753

(100.0)

Vermont

889

(55.2)

352

(21.9)

242

(15.0)

91

(5.7)

29

(1.8)

7

(0.4)

1,610

(100.0)

Virginia

10,943

(40.0)

7,586

(27.7)

5,624

(20.6)

2,174

(7.9)

933

(3.4)

89

(0.3)

27,349

(100.0)

Washington

11,580

(47.0)

5,920

(24.0)

4,397

(17.9)

1,803

(7.3)

913

(3.7)

14

(0.1)

24,627

(100.0)

West Virginia

712

(35.0)

650

(31.9)

468

(23.0)

149

(7.3)

---

---

---

---

2,036

(100.0)

Wyoming

---

---

---

---

---

---

---

---

---

---

---

---

7

(100.0)

Total§§

249,485

(40.9)

159,458

(26.2)

117,929

(19.3)

49,903

(8.2)

25,938

(4.4)

6,084

(1.0)

609,579

(100.0)

Percentage of known values

(41.3)

(26.4)

(19.5)

(8.3)

(4.4)

* Data from 41 reporting areas; excludes three states (California, Louisiana, and New Hampshire) that did not report data and eight states/areas (Connecticut, the District of Columbia, Florida, Illinois, Massachusetts, New Mexico, North Carolina, and Wisconsin) for which the number of previous live births either was not reported or was reported as unknown for >15% of women.

Percentages for the individual component categories might not add up to 100.0% because of rounding.

§ Cell detail not displayed because of small numbers (N<5).

Includes residents only.

** Includes living children only.

†† Numbers do not include private physicians' procedures.

§§ Small numbers (N<5) that have been removed from individual cells have been subtracted from the total.


TABLE 16. Reported abortions, by number of previous abortions and state of occurrence --- selected states, United States, 2006*

No. of previous induced abortions

0

1

2

≥3

Unknown

Total

State/Area

No.

(%)

No.

(%)

No.

(%)

No.

(%)

No.

(%)

No.

(%)

Alabama

7,606

(65.3)

2,796

(24.0)

898

(7.7)

334

(2.9)

20

(0.2)

11,654

(100.0)

Alaska

1,146

(59.6)

466

(24.2)

184

(9.6)

100

(5.2)

27

(1.4)

1,923

(100.0)

Arizona

6,614

(61.0)

2,892

(26.7)

898

(8.3)

417

(3.8)

15

(0.1)

10,836

(100.0)

Arkansas

3,115

(62.4)

1,140

(22.9)

459

(9.2)

---§

---

---

---

4,988

(100.0)

Colorado

7,067

(64.0)

2,687

(24.3)

789

(7.1)

361

(3.3)

144

(1.3)

11,048

(100.0)

Delaware

2,048

(59.3)

852

(24.7)

345

(10.0)

---

---

---

---

3,451

(100.0)

Georgia

18,464

(60.4)

7,731

(25.3)

2,851

(9.3)

1,457

(4.8)

47

(0.2)

30,550

(100.0)

Hawaii

2,028

(50.8)

976

(24.5)

432

(10.8)

322

(8.1)

232

(5.8)

3,990

(100.0)

Idaho

976

(78.1)

199

(15.9)

48

(3.8)

19

(1.5)

7

(0.6)

1,249

(100.0)

Indiana

5,986

(56.4)

2,493

(23.5)

926

(8.7)

436

(4.1)

773

(7.3)

10,614

(100.0)

Iowa

4,372

(65.0)

1,548

(23.0)

525

(7.8)

271

(4.0)

6

(0.1)

6,722

(100.0)

Kansas

6,897

(61.7)

2,700

(24.2)

1,015

(9.1)

561

(5.0)

0

(0)

11,173

(100.0)

Kentucky

2,300

(58.8)

992

(25.4)

358

(9.2)

262

(6.7)

0

(0)

3,912

(100.0)

Maine

1,756

(65.8)

627

(23.5)

207

(7.8)

80

(3.0)

0

(0)

2,670

(100.0)

Maryland

1,754

(21.6)

2,783

(34.2)

1,828

(22.5)

1,774

(21.8)

0

(0)

8,139

(100.0)

Massachusetts

11,671

(48.1)

6,119

(25.2)

3,017

(12.4)

2,204

(9.1)

1,235

(5.1)

24,246

(100.0)

Michigan

13,192

(51.5)

6,692

(26.1)

3,120

(12.2)

2,632

(10.3)

0

(0)

25,636

(100.0)

Minnesota

8,224

(58.5)

3,342

(23.8)

1,405

(10.0)

1,094

(7.8)

0

(0)

14,065

(100.0)

Mississippi

1,854

(62.9)

806

(27.3)

228

(7.7)

---

---

---

---

2,949

(100.0)

Missouri

4,365

(57.8)

1,921

(25.4)

780

(10.3)

---

---

---

---

7,556

(100.0)

Montana

683

(32.2)

840

(39.6)

359

(16.9)

237

(11.2)

0

(0)

2,119

(100.0)

Nebraska

1,869

(63.9)

696

(23.8)

240

(8.2)

122

(4.2)

0

(0)

2,927

(100.0)

Nevada

5,813

(50.7)

3,219

(28.1)

1,261

(11.0)

860

(7.5)

318

(2.8)

11,471

(100.0)

New Jersey**

20,472

(66.1)

5,402

(17.4)

2,790

(9.0)

2,301

(7.4)

21

(0.1)

30,986

(100.0)

New York

57,523

(45.1)

30,310

(23.8)

17,328

(13.6)

16,095

(12.6)

6,181

(4.9)

127,437

(100.0)

City

38,341

(42.5)

22,341

(24.8)

13,412

(14.9)

12,891

(14.3)

3,172

(3.5)

90,157

(100.0)

State

19,182

(51.5)

7,969

(21.4)

3,916

(10.5)

3,204

(8.6)

3,009

(8.1)

37,280

(100.0)

North Dakota

893

(68.8)

268

(20.6)

87

(6.7)

50

(3.9)

0

(0)

1,298

(100.0)

Ohio

15,840

(48.1)

8,474

(25.7)

3,523

(10.7)

2,145

(6.5)

2,954

(9.0)

32,936

(100.0)

Oklahoma

4,496

(63.4)

1,796

(25.3)

507

(7.2)

289

(4.1)

0

(0)

7,088

(100.0)

Oregon

6,579

(56.1)

2,971

(25.3)

1,220

(10.4)

910

(7.8)

52

(0.4)

11,732

(100.0)

Pennsylvania

20,294

(55.3)

9,596

(26.1)

4,102

(11.2)

2,739

(7.5)

0

(0)

36,731

(100.0)

Rhode Island

2,475

(51.3)

1,326

(27.5)

542

(11.2)

317

(6.6)

168

(3.5)

4,828

(100.0)

South Carolina

3,992

(57.0)

1,784

(25.5)

729

(10.4)

---

---

---

---

7,005

(100.0)

South Dakota

527

(70.5)

161

(21.5)

40

(5.3)

20

(2.7)

0

(0)

748

(100.0)

Tennessee

9,340

(52.2)

4,646

(26.0)

2,101

(11.7)

1,504

(8.4)

292

(1.6)

17,883

(100.0)

Texas

47,524

(58.0)

21,871

(26.7)

8,058

(9.8)

4,355

(5.3)

75

(0.1)

81,883

(100.0)

Utah

2,493

(66.4)

795

(21.2)

248

(6.6)

217

(5.8)

0

(0)

3,753

(100.0)

Vermont

958

(59.5)

393

(24.4)

155

(9.6)

97

(6.0)

7

(0.4)

1,610

(100.0)

Virginia

15,412

(56.4)

7,355

(26.9)

2,938

(10.7)

1,578

(5.8)

66

(0.2)

27,349

(100.0)

Washington

13,135

(53.3)

6,423

(26.1)

2,880

(11.7)

2,165

(8.8)

24

(0.1)

24,627

(100.0)

West Virginia

1,211

(59.5)

540

(26.5)

185

(9.1)

---

---

---

---

2,036

(100.0)

Total††

342,964

(54.1)

158,628

(25.0)

69,606

(11.0)

48,325

(7.9)

12,664

(2.0)

633,818

(100.0)

Percentage of known values

(55.2)

(25.5)

(11.2)

(8.0)

* Data from 41 reporting areas; excludes three states (California, Louisiana, and New Hampshire) that did not report data and eight states/areas (Connecticut, the District of Columbia, Florida, Illinois, New Mexico, North Carolina, Wisconsin, and Wyoming) for which the number of previous induced abortions either was not reported or was reported as unknown for >15% of women.

Percentages for the individual component categories might not add up to 100.0% because of rounding.

§ Cell detail not displayed because of small numbers (N<5).

Includes residents only.

** Numbers do not include private physicians' procedures.

†† Small numbers (N<5) that have been removed from individual cells have been subtracted from the total.


TABLE 17. Reported abortions, by known race, age group, and marital status of women who obtained an abortion --- selected states, United States, 2006

Race

White

Black

Other

Total

Characteristic

No.

(%)

No.

(%)

No.

(%)

No.

(%)*

Age group (yrs)

<15

1,318

(0.4)

1,549

(0.7)

148

(0.4)

3,015

(0.5)

15--19

53,047

(16.5)

35,068

(16.6)

5,646

(13.4)

93,761

(16.3)

20--24

108,387

(33.8)

68,195

(32.2)

12,193

(29.0)

188,775

(32.8)

25--29

74,533

(23.2)

54,528

(25.8)

10,080

(24.0)

139,141

(24.2)

30--34

43,398

(13.5)

31,229

(14.8)

7,274

(17.3)

81,901

(14.2)

35--39

29,393

(9.2)

16,365

(7.7)

4,740

(11.3)

50,498

(8.8)

≥40

11,065

(3.4)

4,744

(2.2)

1,979

(4.7)

17,788

(3.1)

Total

321,141

(100.0)

211,678

(100.0)

42,060

(100.0)

574,879

(100.0)

Marital status

Married

52,213

(17.9)

20,444

(10.6)

12,435

(31.9)

85,092

(16.3)

Unmarried

239,433

(82.1)

172,428

(89.4)

26,534

(68.1)

438,395

(83.7)

Total§

291,646

(100.0)

192,872

(100.0)

38,969

(100.0)

523,487

(100.0)

* The sum of percentages by age and by marital status might not add up to 100.0% because of rounding.

Data from 36 reporting areas; excludes three states (California, Louisiana, and New Hampshire) that did not report data and 13 states/areas (Arizona, Connecticut, the District of Columbia, Florida, Illinois, Massachusetts, Nebraska, Nevada, New Mexico, Rhode Island, Utah, Washington, and Wyoming) for which race by age either was not reported or was reported as unknown for >15% of women.

§ Data from 33 reporting areas; excludes three states (California, Louisiana, and New Hampshire) that did not report data and 16 states/areas (Arizona, Arkansas, Connecticut, the District of Columbia, Florida, Illinois, Maryland, Massachusetts, Nebraska, Nevada, New Mexico, New York [excluding New York City], Rhode Island, Utah, Washington, and Wyoming) for which race by marital status either was not reported or was reported as unknown for >15% of women.


TABLE 18. Reported abortions, by known ethnicity, age group, and marital status of women who obtained an abortion --- selected states, United States, 2006

Ethnicity

Hispanic

Non-Hispanic

Total

Characteristic

No.

(%)

No.

(%)

No.

(%)*

Age groups (yrs)

<15

490

(0.5)

2,051

(0.5)

2,541

(0.5)

15--19

15,207

(15.8)

63,079

(16.6)

78,286

(16.4)

20--24

31,824

(33.1)

123,871

(32.5)

155,695

(32.7)

25--29

24,631

(25.6)

90,860

(23.9)

115,491

(24.2)

30--34

13,990

(14.6)

53,871

(14.2)

67,861

(14.2)

35--39

7,373

(7.7)

34,444

(9.0)

41,817

(8.8)

≥40

2,582

(2.7)

12,442

(3.3)

15,024

(3.2)

Total

96,097

(100.0)

380,618

(100.0)

476,715

(100.0)

Marital status

Married

15,436

(17.1)

54,372

(15.8)

69,808

(16.0)

Unmarried

74,651

(82.9)

290,701

(84.2)

365,352

(84.0)

Total§

90,087

(100.0)

345,073

(100.0)

435,160

(100.0)

* The sum of percentages by age and by marital status might not add up to 100.0% because of rounding.

Data from 30 reporting areas; excludes three states (California, Louisiana, New Hampshire) that did not report data and 19 states/areas (Alaska, Connecticut, the District of Columbia, Florida, Illinois, Iowa, Kentucky, Maryland, Massachusetts, Michigan, Montana, Nebraska, Nevada, North Carolina, North Dakota, Oklahoma, Rhode Island, Virginia, and Washington) for which ethnicity by age either was not reported or was reported as unknown for >15% of women.

§ Data from 24 reporting areas; excludes three states (California, Louisiana, and New Hampshire) that did not report data and 25 states/areas (Alaska, Arkansas, Connecticut, District of Columbia, Florida, Georgia, Illinois, Indiana, Iowa, Kentucky, Maine, Maryland, Massachusetts, Michigan, Montana, Nebraska, Nevada, New York [excluding New York City], North Carolina, North Dakota, Oklahoma, Rhode Island, Utah, Virginia, and Washington) for which ethnicity by marital status either was not reported or was reported as unknown for >15% of women.


TABLE 19. Reported abortions, by known week of gestation, age group, race, and ethnicity of women who obtained an abortion --- selected states, United States, 2006

Weeks

≤8

9--10

11--12

13--15

16--20

≥21

Total

Characteristic

No.

(%)

No.

(%)

No.

(%)

No.

(%)

No.

(%)

No.

(%)

No.

(%)*

Age group (yrs)

<15

1,376

(42.2)

608

(18.7)

469

(14.4)

361

(11.1)

302

(9.3)

142

(4.4)

3,258

(0.5)

15--19

53,520

(51.9)

20,099

(19.5)

12,583

(12.2)

9,081

(8.8)

5,709

(5.5)

2,151

(2.1)

103,143

(16.4)

20--24

124,589

(60.5)

36,493

(17.7)

20,495

(10.0)

14,159

(6.9)

7,697

(3.7)

2,546

(1.2)

205,979

(32.8)

25--29

98,291

(65.0)

25,245

(16.7)

12,940

(8.6)

8,657

(5.7)

4,592

(3.0)

1,539

(1.0)

151,264

(24.1)

30--34

60,099

(67.5)

14,084

(15.8)

6,753

(7.6)

4,480

(5.0)

2,623

(2.9)

1,012

(1.1)

89,051

(14.2)

35--39

37,490

(67.9)

8,418

(15.3)

3,985

(7.2)

2,784

(5.0)

1,814

(3.3)

698

(1.3)

55,189

(8.8)

≥40

13,655

(69.3)

2,781

(14.1)

1,336

(6.8)

919

(4.7)

741

(3.8)

259

(1.3)

19,691

(3.1)

Total

389,020

(62.0)

107,728

(17.2)

58,561

(9.3)

40,441

(6.4)

23,478

(3.7)

8,347

(1.3)

627,575

(100.0)

Race

White

201,085

(65.1)

50,183

(16.2)

26,374

(8.5)

17,944

(5.8)

9,706

(3.1)

3,781

(1.2)

309,073

(56.2)

Black

113,577

(56.9)

37,790

(18.9)

21,760

(10.9)

15,111

(7.6)

8,627

(4.3)

2,792

(1.4)

199,657

(36.3)

Other

27,430

(67.1)

5,984

(14.6)

2,843

(7.0)

2,449

(6.0)

1,612

(3.9)

561

(1.4)

40,879

(7.4)

Total§

342,092

(62.2)

93,957

(17.1)

50,977

(9.3)

35,504

(6.5)

19,945

(3.6)

7,134

(1.3)

549,609

(100.0)

Ethnicity

Hispanic

60,725

(64.1)

15,098

(15.9)

7,515

(7.9)

6,563

(6.9)

3,484

(3.7)

1,404

(1.5)

94,789

(20.5)

Non-Hispanic

224,973

(61.3)

63,919

(17.4)

34,756

(9.5)

23,720

(6.5)

14,304

(3.9)

5,613

(1.5)

367,285

(79.5)

Total

285,698

(61.8)

79,017

(17.1)

42,271

(9.1)

30,283

(6.6)

17,788

(3.8)

7,017

(1.5)

462,074

(100.0)

* The sum of percentages by age, race and ethnicity might not add up to 100.0% because of rounding.

Data from 39 reporting areas; excludes three states (California, Louisiana, and New Hampshire) that did not report data and 10 states/areas (Connecticut, the District of Columbia, Florida, Illinois, Maryland, Massachusetts, Mississippi, Nebraska, Nevada and North Carolina) for which gestational age by age group either was not reported or was reported as unknown for >15% of women.

§ Data from 30 reporting areas; excludes three states (California, Louisiana, and New Hampshire) that did not report data and 19 states/areas (Arizona, Connecticut, the District of Columbia, Florida, Illinois, Indiana, Maryland, Massachusetts, Mississippi, Nebraska, Nevada, New Mexico, New York [excluding New York City], North Carolina, Rhode Island, Utah, Washington, Wisconsin and Wyoming) for which gestational age by race either was not reported or was reported as unknown for >15% of women.

Data from 26 reporting areas; excludes three states (California, Louisiana, and New Hampshire) that did not report data and 23 states/areas (Alaska, Connecticut, the District of Columbia, Florida, Illinois, Indiana, Iowa, Kentucky, Maryland, Massachusetts, Michigan, Mississippi, Montana, Nebraska, Nevada, New York [excluding New York City], North Carolina, North Dakota, Oklahoma, Rhode Island, Virginia, Washington, and Wisconsin) for which gestational age by ethnicity either was not reported or was reported as unknown for >15% of women.


TABLE 20. Reported abortions obtained at ≤8 weeks of gestation, by known week of gestation, age group, race, and ethnicity of women who obtained an abortion --- selected states, United States, 2006

Weeks

≤6

7

8

Total

Characteristic

No.

(%)

No.

(%)

No.

(%)

No.

(%)*

Age group (yrs)

<15

560

(17.4)

391

(12.2)

404

(12.6)

1,355

(42.2)

15--19

22,630

(22.3)

15,912

(15.7)

14,306

(14.1)

52,848

(52.1)

20--24

57,682

(28.4)

36,081

(17.8)

29,264

(14.4)

123,027

(60.7)

25--29

47,136

(31.6)

28,465

(19.1)

21,491

(14.4)

97,092

(65.1)

30--34

29,522

(33.6)

17,295

(19.7)

12,533

(14.3)

59,350

(67.6)

35--39

18,459

(33.9)

10,652

(19.6)

7,920

(14.6)

37,031

(68.0)

≥40

6,948

(35.8)

3,807

(19.6)

2,726

(14.1)

13,481

(69.5)

Total

182,937

(29.6)

112,603

(18.2)

88,644

(14.3)

384,184

(62.1)

Race

White

101,771

(32.9)

56,017

(18.1)

43,297

(14.0)

201,085

(65.1)

Black

48,151

(24.1)

35,812

(17.9)

29,614

(14.8)

113,577

(56.9)

Other

14,109

(34.5)

7,651

(18.7)

5,670

(13.9)

27,430

(67.1)

Total§

164,031

(29.8)

99,480

(18.1)

78,581

(14.3)

342,092

(62.2)

Ethnicity

Hispanic

31,574

(33.3)

16,314

(17.2)

12,837

(13.5)

60,725

(64.1)

Non-Hispanic

105,411

(28.7)

66,501

(18.1)

53,061

(14.4)

224,973

(61.3)

Total

136,985

(29.6)

82,815

(17.9)

65,898

(14.3)

285,698

(61.8)

* Percentages were calculated using the total number of abortions obtained at all known weeks of gestation. Percentages might not add to the percentage obtained at ≤8 weeks of gestation as shown in Table 19 because fewer states are included in certain variables and because of rounding.

Data from 38 reporting areas; excludes three states (California, Louisiana, and New Hampshire) that did not report data and 11 states/areas (Connecticut, the District of Columbia, Florida, Illinois, Maryland, Massachusetts, Mississippi, Nebraska, Nevada, North Carolina, and Wisconsin) for which gestational age by age group either was not reported or was reported as unknown for >15% of women.

§ Data from 30 reporting areas; excludes three states (California, Louisiana, and New Hampshire) that did not report data and 19 states/areas (Arizona, Connecticut, the District of Columbia, Florida, Illinois, Indiana, Maryland, Massachusetts, Mississippi, Nebraska, Nevada, New Mexico, New York [excluding New York City], North Carolina, Rhode Island, Utah, Washington, Wisconsin, and Wyoming) for which gestational age by race either was not reported or was reported as unknown for >15% of women.

Data from 26 reporting areas; excludes three states (California, Louisiana, and New Hampshire) that did not report data and 23 states/areas (Alaska, Connecticut, the District of Columbia, Florida, Illinois, Indiana, Iowa, Kentucky, Maryland, Massachusetts, Michigan, Mississippi, Montana, Nebraska, Nevada, New York [excluding New York City], North Carolina, North Dakota, Oklahoma, Rhode Island, Virginia, Washington, and Wisconsin) for which gestational age by ethnicity either was not reported or was reported as unknown for >15% of women.


TABLE 21. Reported abortions, by known week of gestation and type of procedures --- selected states, United States, 2006*

Weeks

≤8

9--10

11--12

13--15

16--20

≥21

Total

Type of procedure

No.

(%)

No.

(%)

No.

(%)

No.

(%)

No.

(%)

No.

(%)

No.

(%)

Curettage§

316,019

(82.6)

103,520

(98.0)

56,920

(99.4)

39,069

(99.4)

21,768

(96.5)

6,945

(85.9)

544,241

(88.5)

Intrauterine instillation

286

(0.1)

97

(0.1)

63

(0.1)

69

(0.2)

167

(0.8)

86

(1.1)

768

(0.1)

Medical

60,758

(15.9)

1,886

(1.8)

222

(0.4)

127

(0.3)

405

(1.8)

380

(4.7)

63,778

(10.4)

Other**

5,377

(1.4)

138

(0.1)

64

(0.1)

46

(0.1)

221

(1.0)

676

(8.4)

6,522

(1.1)

Total

382,440

(100.0)

105,641

(100.0)

57,269

(100.0)

39,311

(100.0)

22,561

(100.0)

8,087

(100.0)

615,309

(100.0)

* Data from 39 reporting areas; excludes three states (California, Louisiana, and New Hampshire) that did not report data and 10 states/areas (Connecticut, the District of Columbia, Florida, Illinois, Kentucky, Maryland, Massachusetts, Mississippi, Nebraska, and Wisconsin) for which gestational age by procedure type either was not reported or was reported as unknown for >15% of women.

The sum of percentages by procedure type might not add up to 100.0% because of rounding.

§ Includes vacuum aspiration, sharp curettage, and dilation and evacuation procedures.

Medical (nonsurgical) procedures differed by weeks of gestation (i.e., mifepristone and misoprostol or methotrexate and misoprostol were reported for abortions performed at ≤8 weeks gestation; vaginal prostaglandins were primarily reported for abortions performed at later weeks of gestation).

** Includes hysterotomy/hysterectomy and procedures reported as "other."


TABLE 22. Number of deaths and case-fatality rates* for abortion-related deaths reported to CDC, by type of abortion --- United States, 1972--2005

Type of abortion induced

Year

Legal§

Illegal

Unknown**

Total

Case-fatality rate

1972

24

39

2

65

4.1

1973

25

19

3

47

4.1

1974

26

6

1

33

3.4

1975

29

4

1

34

3.4

1976

11

2

1

14

1.1

1977

17

4

0

21

1.6

1978

9

7

0

16

0.8

1979

22

0

0

22

1.8

1980

9

1

2

12

0.7

1981

8

1

0

9

0.6

1982

11

1

0

12

0.8

1983

11

1

0

12

0.9

1984

12

0

0

12

0.9

1985

11

1

1

13

0.8

1986

11

0

2

13

0.8

1987

7

2

0

9

0.5

1988

16

0

0

16

1.2

1989

12

1

0

13

0.9

1990

9

0

0

9

0.6

1991

11

1

0

12

0.8

1992

10

0

0

10

0.7

1993

6

1

2

9

0.5

1994

10

2

0

12

0.8

1995

4

0

0

4

0.3

1996

9

0

0

9

0.7

1997

7

0

0

7

0.6

1998

10

0

0

10

---††

1999

4

0

0

4

---

2000

11

0

0

11

---

2001

6

1

0

7

---

2002

9

0

0

9

---

2003

10

0

0

10

---

2004

7

1

0

8

---

2005

7

0

0

7

---

Total

400

95

15

511

1.1§§

* Number of abortion-related deaths per 100,000 reported legal induced abortions.

Certain numbers might differ from those in reports published previously because additional information has been supplied to CDC subsequent to publication.

§ An abortion is defined as "legal" if it was performed by a licensed physician or an appropriately licensed advanced practice clinician acting under the supervision of a licensed physician.

An abortion is defined as "illegal" if it was performed by any person other than a licensed physician or an appropriately licensed advanced practice clinician acting under the supervision of a licensed physician.

** Unknown whether induced or spontaneous abortions.

†† Case-fatality rates for 1998--2005 cannot be calculated because a substantial number of abortions occurred in nonreporting states, and the denominator (i.e., the total number of abortions) is unknown.

§§ Case-fatality rate computed for 1972--1997 only.

FIGURE 1. Number, rate,* and ratio of abortions performed, by year --- selected states, United States, 1996--2006§

This figure displays the data from 46 reporting areas (excludes Alaska, California, Louisiana, New Hampshire, Oklahoma, and West Virginia) for an 11-year period showing the number of abortions, the abortion rate (i.e., the number of abortions per 1,000 women aged 15–44 years, and the abortion ratio (i.e., the number of abortions per 1,000 live births) per year.

Regression analysis indicated a general decline during 1996–2006 in abortion numbers, rates, and ratios. These declines were attributable primarily to reductions that occurred during 1996–2000. On average, during 1996–2000, the number of abortions decreased 20,605 per year, the abortion rate decreased 0.5 abortions per 1,000 women per year, and the abortion ratio decreased 9.7 abortions per 1,000 live births per year. For 2001–2006, the number of abortions declined 2,163 per year, the abortion rate declined 0.1 per year, and the abortion ratio declined 3.3 per year. During the previous year (2005–2006), the total number of reported abortions increased 25,253, and the abortion rate increased 0.5, although the abortion ratio remained stable.

*Number of abortions per 1,000 women aged 15--44 years.

Number of abortions per 1,000 live births.

§Data from 46 reporting areas; excludes Alaska, California, Louisiana, New Hampshire, Oklahoma, and West Virginia.

Alternate Text: This figure displays the data from 46 reporting areas (excludes Alaska, California, Louisiana, New Hampshire, Oklahoma, and West Virginia) for an 11-year period showing the number of abortions, the abortion rate (i.e., the number of abortions per 1,000 women aged 15–44 years, and the abortion ratio (i.e., the number of abortions per 1,000 live births) per year. Regression analysis indicated a general decline during 1996–2006 in abortion numbers, rates, and ratios. These declines were attributable primarily to reductions that occurred during 1996–2000. On average, during 1996–2000, the number of abortions decreased 20,605 per year, the abortion rate decreased 0.5 abortions per 1,000 women per year, and the abortion ratio decreased 9.7 abortions per 1,000 live births per year. For 2001–2006, the number of abortions declined 2,163 per year, the abortion rate declined 0.1 per year, and the abortion ratio declined 3.3 per year. During the previous year (2005–2006), the total number of reported abortions increased 25,253, and the abortion rate increased 0.5, although the abortion ratio remained stable.

Figure 2. Abortion rate,* ratio, and percentage of total abortions, by age group of women who obtained an abortion --- selected states, United States, 2006§

This figure displays data from 48 reporting areas (excludes California, Florida, Louisiana, and New Hampshire) for 2006 showing the abortion rate (i.e., the number of abortions per 1,000 women aged 15–44 years, the abortion ratio (i.e., the number of abortions per 1,000 live births), and the percentage of total abortions by the age group of women who obtained an abortion.

Women aged 20–29 years accounted for 417,402 (56.8%) of the 735,187 procedures reported among women of known age. Women in this age group also had the highest abortion rates (29.9 and 22.2 abortions per 1,000 women aged 20–24 and 25–29 years, respectively). Women at the youngest and oldest age extremes (<15 or ≥40 years) accounted for the smallest percentage of abortions (0.5% and 3.2%, respectively) and had the lowest abortion rates (1.2 and 2.6 abortions per 1,000 women aged <15 and ≥40 years, respectively).

*Number of abortions per 1,000 women aged 15--44 years.

Number of abortions per 1,000 live births.

§Data from 48 reporting areas; excludes California, Florida, Louisiana, and New Hampshire.

Alternate Text: This figure displays data from 48 reporting areas (excludes California, Florida, Louisiana, and New Hampshire) for 2006 showing the abortion rate (i.e., the number of abortions per 1,000 women aged 15–44 years, the abortion ratio (i.e., the number of abortions per 1,000 live births), and the percentage of total abortions by the age group of women who obtained an abortion. Women aged 20–29 years accounted for 417,402 (56.8%) of the 735,187 procedures reported among women of known age. Women in this age group also had the highest abortion rates (29.9 and 22.2 abortions per 1,000 women aged 20–24 and 25–29 years, respectively). Women at the youngest and oldest age extremes (<15 or ≥40 years) accounted for the smallest percentage of abortions (0.5% and 3.2%, respectively) and had the lowest abortion rates (1.2 and 2.6 abortions per 1,000 women aged <15 and ≥40 years, respectively).

FIGURE 3. Percentage* of women who obtained early or late§ abortions, by age group --- selected states, United States, 2006

This figure displays data for 39 reporting areas (excludes three states [California, Louisiana, and New Hampshire] that did not report data and 10 areas [Connecticut, the District of Columbia, Florida, Illinois, Maryland, Massachusetts, Mississippi, Nebraska, Nevada, and North Carolina] for which gestational age by age group either was not reported or was reported as unknown for >15% of women) showing the percentage of women who obtained early (i.e., <8 weeks’ gestation) or late (i.e., >16 weeks’ gestation) abortions. The highest percentage of abortions were obtained at ≤8 weeks’ gestation. Although 42.2% of adolescents aged <15 years and 51.9% of adolescents aged 15–19 years obtained an abortion by ≤8 weeks’ gestation, 60.5%–69.3% of adult women aged ≥20 years obtained an abortion by this time.

* Based on total known weeks of gestation.

≤8 weeks' gestation.

§ ≥16 weeks' gestation.

Data from 39 reporting areas; excludes three states (California, Louisiana, and New Hampshire) that did not report data and 10 states/areas (Connecticut, the District of Columbia, Florida, Illinois, Maryland, Massachusetts, Mississippi, Nebraska, Nevada, and North Carolina) for which gestational age by age group either was not reported or was reported as unknown for >15% of women.

Alternate Text: This figure displays data for 39 reporting areas (excludes three states [California, Louisiana, and New Hampshire] that did not report data and 10 areas [Connecticut, the District of Columbia, Florida, Illinois, Maryland, Massachusetts, Mississippi, Nebraska, Nevada, and North Carolina] for which gestational age by age group either was not reported or was reported as unknown for >15% of women) showing the percentage of women who obtained early (i.e., <8 weeks’ gestation) or late (i.e., >16 weeks’ gestation) abortions. The highest percentage of abortions were obtained at ≤8 weeks’ gestation. Although 42.2% of adolescents aged <15 years and 51.9% of adolescents aged 15–19 years obtained an abortion by ≤8 weeks’ gestation, 60.5%–69.3% of adult women aged ≥20 years obtained an abortion by this time.

Use of trade names and commercial sources is for identification only and does not imply endorsement by the U.S. Department of Health and Human Services.


References to non-CDC sites on the Internet are provided as a service to MMWR readers and do not constitute or imply endorsement of these organizations or their programs by CDC or the U.S. Department of Health and Human Services. CDC is not responsible for the content of pages found at these sites. URL addresses listed in MMWR were current as of the date of publication.

All MMWR HTML versions of articles are electronic conversions from typeset documents. This conversion might result in character translation or format errors in the HTML version. Users are referred to the electronic PDF version (http://www.cdc.gov/mmwr) and/or the original MMWR paper copy for printable versions of official text, figures, and tables. An original paper copy of this issue can be obtained from the Superintendent of Documents, U.S. Government Printing Office (GPO), Washington, DC 20402-9371; telephone: (202) 512-1800. Contact GPO for current prices.

**Questions or messages regarding errors in formatting should be addressed to mmwrq@cdc.gov.

Date last reviewed: 11/19/2009

HOME  |  ABOUT MMWR  |  MMWR SEARCH  |  DOWNLOADS  |  RSSCONTACT
POLICY  |  DISCLAIMER  |  ACCESSIBILITY

Safer, Healthier People

Morbidity and Mortality Weekly Report
Centers for Disease Control and Prevention
1600 Clifton Rd, MailStop E-90, Atlanta, GA 30333, U.S.A

USA.GovDHHS

Department of Health
and Human Services