Skip Navigation LinksSkip Navigation Links
Centers for Disease Control and Prevention
Safer Healthier People
Blue White
Blue White
bottom curve
CDC Home Search Health Topics A-Z spacer spacer
spacer
Blue curve MMWR spacer
spacer
spacer


Persons using assistive technology might not be able to fully access information in this file. For assistance, please send e-mail to: mmwrq@cdc.gov. Type 508 Accommodation and the title of the report in the subject line of e-mail.

Trends in Smoking Before, During, and After Pregnancy --- Pregnancy Risk Assessment Monitoring System (PRAMS), United States, 31 Sites, 2000--2005

Van T. Tong, MPH1

Jaime R. Jones, MPH1

Patricia M. Dietz, DrPH1

Denise D'Angelo, MPH1

Jennifer M. Bombard, MSPH2

1Division of Reproductive Health, National Center for Chronic Disease Prevention and Health Promotion, CDC

2Office on Smoking and Health, National Center for Chronic Disease Prevention and Health Promotion, CDC

Corresponding author: Van Tong, MPH, Division of Reproductive Health, National Center for Chronic Disease Prevention and Health Promotion, CDC, MS K-22, 4770 Buford Hwy., NE, Atlanta, GA, 30341. Telephone: 770-488-6309; Fax: 770-488-6291; E-mail: vtong@cdc.gov.

Abstract

Problem: Smoking among nonpregnant women contributes to reduced fertility, and smoking during pregnancy is associated with delivery of preterm infants, low infant birthweight, and increased infant mortality. After delivery, exposure to secondhand smoke can increase an infant's risk for respiratory tract infections and for dying of sudden infant death syndrome. During 2000--2004, an estimated 174,000 women in the United States died annually from smoking-attributable causes, and an estimated 776 infants died annually from causes attributed to maternal smoking during pregnancy.

Reporting Period Covered: 2000--2005.

Description of System: The Pregnancy Risk Assessment Monitoring System (PRAMS) was initiated in 1987 and is an ongoing state- and population-based surveillance system designed to monitor selected maternal behaviors and experiences that occur before, during, and after pregnancy among women who deliver live-born infants in the United States. Self-reported questionnaire data are linked to selected birth certificate data and are weighted to represent all women delivering live infants in the state. Self-reported smoking data were obtained from the PRAMS questionnaire and birth certificates. This report provides data on trends (aggregated and site-specific estimates) of smoking before, during, and after pregnancy and describes characteristics of female smokers during these periods.

Results: For the study period 2000--2005, data from 31 PRAMS sites (Alabama, Alaska, Arkansas, Colorado, Florida, Georgia, Hawaii, Illinois, Louisiana, Maine, Maryland, Michigan, Minnesota, Mississippi, Montana, Nebraska, New Jersey, New Mexico, New York, New York City, North Carolina, North Dakota, Ohio, Oklahoma, Oregon, Rhode Island, South Carolina, Utah, Vermont, Washington, and West Virginia) were included in this report. All 31 sites have met the Healthy People 2010 (HP 2010) objective of increasing the percentage of pregnant smokers who stop smoking during pregnancy to 30%; site-specific quit rates in 2005 ranged from 30.2% to 61.0%. However, none of the sites achieved the HP 2010 objective of reducing the prevalence of prenatal smoking to 1%; site-specific prevalence of smoking during pregnancy in 2005 ranged from 5.2% to 35.7%. During 2000--2005, two sites (New Mexico and Utah) experienced decreasing rates for smoking before, during, and after pregnancy, and two sites (Illinois and New Jersey) experienced decreasing rates during pregnancy only. Three sites (Louisiana, Ohio, and West Virginia) had increases in the rates for smoking before, during, and after pregnancy, and Arkansas had increases in rates before pregnancy only. For the majority of sites, smoking rates did not change over time before, during, or after pregnancy. For 16 sites (Alaska, Arkansas, Colorado, Florida, Hawaii, Illinois, Maine, Nebraska, New Mexico, New York [excluding New York City], North Carolina, Oklahoma, South Carolina, Utah, Washington, and West Virginia) for which data were available for the entire 6-year study period, the prevalence of smoking before pregnancy remained unchanged, with approximately one in five women (from 22.3% in 2000 to 21.5% in 2005) reporting smoking before pregnancy. The prevalence of smoking during pregnancy declined (p = 0.01) from 15.2% in 2000 to 13.8% in 2005, and the prevalence of smoking after delivery declined (p = 0.04) from 18.1% in 2000 to 16.4% in 2005.

Interpretation: The results indicate that efforts to reduce smoking prevalence among female smokers before pregnancy have not been effective; however, efforts targeting pregnant women have met some success as rates have declined during pregnancy and after delivery. Current tobacco-control efforts and smoking-cessation efforts targeting pregnant women are not sufficient to reach the HP 2010 objective of reducing prevalence of smoking during pregnancy.

Public Health Action: The data provided in this report are important for developing, monitoring, and evaluating state tobacco-control policies and programs to reduce smoking among female and pregnant smokers. States can reduce smoking before, during, and after pregnancy through sustained and comprehensive tobacco-control efforts (e.g., smoke-free policies and tobacco excise taxes). Health-care providers should increase efforts to assess the smoking status of their patients and offer effective smoking-cessation interventions to every female or pregnant smoker to whom they provide health-care services.

Introduction

Prenatal smoking remains one of the most common preventable causes of infant morbidity and mortality and is associated with 30% of small-for-gestational-age infants, 10% of preterm infants, and 5% of infant deaths (1,2). Cigarette smoking before conception can cause reduced fertility and conception delay among women (2,3). Maternal cigarette smoking during pregnancy increases the risk for pregnancy complications (e.g., placental previa, placental abruption, and premature rupture of the membrane) and poor pregnancy outcomes (e.g., preterm delivery, restricted fetal growth, and sudden infant death syndrome [SIDS]) (2,3). Exposure to secondhand smoke after delivery increases an infant's risk for respiratory tract infections (e.g., bronchitis and pneumonia), ear infections, and dying from SIDS (2--6). During 2000--2004, an estimated 174,000 women in the United States died annually from smoking-attributable causes, and an estimated 776 infants died annually from causes attributed to maternal smoking during pregnancy (7).

In 2005, approximately 10%--12% of women giving birth reported smoking during pregnancy based on birth certificates (8). Rates were higher among certain subpopulations (e.g., women aged <25 years, women with lower levels of education, American Indian/Alaska Native women, and white women) (8). Although smoking rates among women have been decreasing in the United States, an estimated 22% of women of reproductive age continued to smoke in 2006 (9).

Two Healthy People 2010 (HP 2010) national health objectives address smoking during pregnancy: 1) reduce the prevalence of cigarette smoking among pregnant women to 1% (objective no. 16-17) and 2) increase the percentage of pregnant smokers who stop smoking during pregnancy to 30% (objective no. 27-6) (10). A previous study of 10 states (Alabama, Alaska, Florida, Georgia, Maine, New York [excluding New York City*], Oklahoma, South Carolina, Washington, and West Virginia) that participated in the Pregnancy Risk Assessment Monitoring System (PRAMS) indicated that quit rates during pregnancy increased from 37.0% in 1993 to 46.0% in 1999, but no change occurred in smoking rates before pregnancy or in postpartum relapse rates during the study period (11). In 2003, 19 PRAMS sites (Alabama, Alaska, Arkansas, Colorado, Florida, Hawaii, Illinois, Louisiana, Maine, Nebraska, New Mexico, New York [excluding New York City], North Carolina, Ohio, Oklahoma, South Carolina, Utah, Washington, and West Virginia) achieved the second objective, with quit rates ranging from 30.2% in West Virginia to 65.8% in Utah (12). However, none of the sites achieved the first objective, with prevalence of smoking during the last 3 months of pregnancy ranging from 3.9% in Utah to 27.5% in West Virginia.

To assess progress toward achieving the HP 2010 objectives and to assist tobacco-control efforts targeting nonpregnant, pregnant, and postpartum female smokers, CDC analyzed data from the PRAMS questionnaire for 2000--2005. This report provides the first summary of PRAMS data concerning trends (aggregated and site-specific estimates) of smoking before, during, and after pregnancy and describes characteristics of female smokers during these periods.

Methods

Project Description

Initiated in 1987, PRAMS is an ongoing state- and population-based surveillance system designed to monitor selected self-reported behaviors, health-care use, and maternal morbidities that occur before, during, and after pregnancy among women who deliver a live-born infant in the United States. PRAMS is administered by CDC's National Center for Chronic Disease Prevention and Health Promotion in collaboration with state health departments. During 1987--2008, PRAMS began with six sites (District of Columbia, Indiana, Maine, Michigan, Oklahoma, and West Virginia) and now includes 37 states (Alabama, Alaska, Arkansas, Colorado, Delaware, Florida, Georgia, Hawaii, Illinois, Louisiana, Maine, Maryland, Massachusetts, Michigan, Minnesota, Mississippi, Missouri, Nebraska, New Jersey, New Mexico, New York, North Carolina, Ohio, Oklahoma, Oregon, Pennsylvania, Rhode Island, South Carolina, Tennessee, Texas, Utah, Vermont, Virginia, Washington, West Virginia, Wisconsin, and Wyoming), a tribal-state collaborative project (South Dakota), and one major metropolitan city (New York City).

Data Collection

All health departments participating in PRAMS use a standardized data collection methodology developed by CDC (13). At each site, a monthly stratified sample of 100--300 new mothers is selected systematically from recent birth certificates. PRAMS staff at each site mail a self-administered questionnaire to the selected women starting 2--3 months after the delivery of a live infant. Women who do not respond to any of three serial mailings are contacted by telephone to complete the survey. To minimize recall bias, all efforts to contact women by mail and telephone end 9 months postpartum. Survey data are linked to selected birth certificate data and weighted for sample design, nonresponse, and noncoverage.

The PRAMS questionnaire is revised periodically. Data highlighted in this report were collected using the Phase Four (2000--2003) and Phase Five (2004--2005) versions of the questionnaire (14). Details concerning the PRAMS methodology have been described elsewhere (13).

PRAMS sites were included in the report if an overall weighted response rate of ≥70% was achieved for a given year for every site. To minimize nonresponse bias, PRAMS has established 70% as the minimum weighted response rate for site data to be included in published results. The weighted response rate indicates the proportion of women sampled who completed a survey, adjusting for sample design.

For the study period 2000--2005, data from 31 PRAMS sites (Alabama, Alaska, Arkansas, Colorado, Florida, Georgia, Hawaii, Illinois, Louisiana, Maine, Maryland, Michigan, Minnesota, Mississippi, Montana, Nebraska, New Jersey, New Mexico, New York, New York City, North Carolina, North Dakota, Ohio, Oklahoma, Oregon, Rhode Island, South Carolina, Utah, Vermont, Washington, and West Virginia) were included in this report. Data from 26 PRAMS sites (Alaska, Arkansas, Colorado, Florida, Georgia, Hawaii, Illinois, Maine, Maryland, Michigan, Minnesota, Nebraska, New Jersey, New Mexico, New York, New York City, North Carolina, Ohio, Oklahoma, Oregon, Rhode Island, South Carolina, Utah, Vermont, Washington, and West Virginia) with data available in 2005 were aggregated for the analysis of maternal characteristics associated with smoking, and data from 16 PRAMS sites (Alaska, Arkansas, Colorado, Florida, Hawaii, Illinois, Maine, Nebraska, New Mexico, New York [excluding New York City], North Carolina, Oklahoma, South Carolina, Utah, Washington, and West Virginia) with data available for all 6 years during 2000--2005 were aggregated to analyze time trends in the prevalence of smoking. The 31 PRAMS sites included in this report represent approximately 54% of live births in the United States during 2005.

Data Analysis

This report presents data on five measures of smoking behaviors before, during, and after pregnancy: 1) smoking during the 3 months before pregnancy, 2) smoking during pregnancy (reported by women on the PRAMS questionnaire for the last 3 months of pregnancy or indicated on the linked birth certificate at any time during pregnancy), 3) quitting smoking during pregnancy among women who smoked before pregnancy, 4) smoking after delivery (measured at the time the questionnaire was completed), and 5) relapsing to smoking after delivery among women who quit smoking during pregnancy (see Appendix for definitions). Three PRAMS questions were used to calculate these measures: 1) "In the 3 months before you got pregnant, how many cigarettes did you smoke on an average day?"; 2) "In the last 3 months of your pregnancy, how many cigarettes did you smoke on an average day?"; and 3) "How many cigarettes do you smoke on an average day now?"

Smoking measures were analyzed in the aggregate by selected maternal characteristics for the 26 sites with available data for 2005. Maternal age, race/ethnicity, education, marital status, parity, and initiation of prenatal care were derived from the birth certificate. Annual income, prepregnancy body mass index, pregnancy intention, health-care insurance coverage during pregnancy, Special Supplemental Nutrition Program for Women, Infants, and Children (WIC) enrollment during pregnancy, alcohol use during pregnancy, and number of cigarettes smoked per day before pregnancy were derived from the PRAMS questionnaire (see Appendix for variable definitions). Smoking prevalence and standard errors were estimated by year for each site and aggregated only for the 16 sites with available data for all 6 years during 2000--2005.

To estimate the magnitude of change in the prevalence estimates, the proportion change was calculated by subtracting the smoking prevalence of the most recent year available from that of the earliest year available and dividing the difference by the prevalence from the earliest year. Statistical linear trends were assessed using logistic regression with smoking as the outcome variable and the infant's birth year as the independent variable. Only sites with at least 3 years of data were assessed for linear trends. Chi-square tests for independence were conducted to test for differences in smoking and maternal characteristics for categorical variables. Significance level for all statistical tests was set at p≤0.05.

Data were weighted to represent all live births delivered in each respective site in the given year. The analyses were conducted using SUDAAN version 9.1 to account for the complex survey design of PRAMS (15).

Results

A total of 31 PRAMS sites that had ≥1 year of data available during 2000--2005 were included in the analysis, with a total unweighted sample size of 242,038. The yearly site-specific sample size ranged from 770 respondents in New York City in 2004 to 2,518 respondents in Hawaii in 2000. The highest (89%) 1-year response rate was achieved in Utah in 2004. The average age of infants for whom the PRAMS questionnaire was completed varied (range: 93.8 days [Montana in 2002]--146.7 days [Florida in 2005]) on the basis of the most recent year of data available for a site (Table 1).

Maternal Characteristics of Smokers and Nonsmokers

In 2005, on the basis of aggregated data from 26 sites, 22.5% of women reported smoking before or during pregnancy or after delivery (Table 2). Compared with nonsmokers, women who smoked were significantly more likely to be younger (aged <25 years), non-Hispanic white, have ≤12 years of education, be unmarried, have an annual income of <$15,000, be underweight, have an unintended pregnancy, be first-time mothers, have initiated prenatal care later, be Medicaid-enrolled, and be enrolled in WIC during pregnancy (Table 2).

Smoking Before Pregnancy

Site-Specific Trends

On the basis of aggregated data from the 16 sites for which data were available for all 6 years during 2000--2005, the prevalence of smoking during the 3 months before pregnancy did not change significantly (from 22.3% to 21.5%) (Figure 1; Table 3). During 2000--2005, the prevalence of smoking during the 3 months before pregnancy increased significantly for four sites (Arkansas [from 28.6% to 32.6%], Louisiana [from 21.2% to 28.2%], Ohio [from 28.6% to 32.0%], and West Virginia [from 36.2% to 45.8%]) and decreased significantly for two sites (New Mexico [from 21.3% to 18.8%] and Utah [from 14.3% to 10.2%]) (Table 3). In 2005, among 26 sites, site-specific prevalence of smoking during the 3 months before pregnancy ranged from 10.2% in Utah to 45.8% in West Virginia (Figures 2 and 3; Table 3).

Smoking During Pregnancy

Site-Specific Trends

PRAMS datasets include two sources for data on smoking during pregnancy: self-reported smoking during the last 3 months of pregnancy reported on the PRAMS questionnaire and smoking at any time during pregnancy indicated on the linked birth certificate. Estimates from each data source are presented with a combined estimate, which includes smoking during pregnancy indicated on either source. In 2005, on the basis of aggregated data from the 26 sites, the combined estimate for smoking during pregnancy (14.1%) was 16% higher than the PRAMS-only estimate (12.2%) and 38% higher than the birth certificate--only estimate (10.2%; data not presented). The prevalence of smoking during pregnancy based on the combined estimate was higher than the estimate based on either data source alone in all 31 sites.

On the basis of aggregated data from the 16 sites, smoking during pregnancy (combined estimate) decreased significantly during 2000--2005, from 15.2% to 13.8%; however, this trend differed by site (Figure 1; Table 4). During the study period, smoking during pregnancy (combined estimate) increased significantly for three sites (Louisiana [from 13.7% to 18.9%], Ohio [from 20.2% to 23.8%], and West Virginia [from 29.4% to 35.7%] and decreased significantly for four sites (Illinois [from 14.6% to 11.3%], New Jersey [from 11.5% to 9.8%], New Mexico [from 13.1% to 11.3%], and Utah [from 9.9% to 6.2%]) (Table 4). The site-specific prevalence of smoking during pregnancy (combined estimate) among the 26 sites in 2005 ranged from 5.2% in New York City to 35.7% in West Virginia (Figures 4 and 5; Table 4).

Maternal Racial/Ethnic, and Age Trends

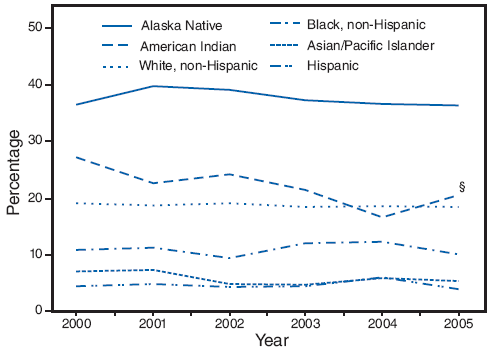
On the basis of aggregated data from the 16 sites with data available for all 6 years during 2000--2005, trends in smoking during pregnancy varied by maternal racial/ethnic and age categories. American Indians were the only racial/ethnic population that experienced a significant decline in smoking during pregnancy, from 27.1% in 2000 to 20.6% in 2005 (Figure 6; Table 5). In 2005, prevalence of smoking was highest among Alaska Natives (36.3%) and American Indians (20.6%) and lowest among Hispanics (4.0%) and Asian/Pacific Islanders (5.4%) (Table 5). Among age groups, only women aged ≥35 years had a significant decline in smoking during pregnancy, from 13.2% in 2000 to 9.2% in 2005 (Figure 7; Table 5). In 2005, the prevalence of smoking was highest among women aged 20--24 years (20.7%) and lowest among women aged ≥35 years (9.2%) (Table 5).

Breakdowns by age within racial/ethnic subpopulations demonstrated different trends over time. During 2000--2005, the prevalence of prenatal smoking increased significantly (from 30.0% to 32.8%) among non-Hispanic white women aged 20--24 years and decreased significantly (from 15.3% to 10.8%) among non-Hispanic white women aged ≥35 years (Table 5). Among non-Hispanic black women aged 25--34 years, the prevalence of smoking increased significantly (from 8.9% to 12.0%) (Table 5). Among Alaska Natives aged 20--24 years, the prevalence of prenatal smoking decreased significantly (from 44.8% to 36.1%) (Table 5). Among American Indians, the prevalence of prenatal smoking decreased significantly among women aged <20 years (from 37.6% to 15.9%) and among women aged 20--24 years (from 30.9% to 17.0%) (Table 5).

Quitting Smoking During Pregnancy

During the study period, on the basis of aggregated data from the 16 sites, the percentage of smokers who quit smoking during pregnancy did not increase significantly (from 43.9% to 45.7%) (Table 6). However, significant site-specific trends over time were observed. The percentage of smokers who quit smoking during pregnancy decreased significantly for one site (Louisiana [from 44.2% to 37.1%]) and increased significantly for two sites (Michigan [from 33.1% to 44.9%] and New Jersey [from 47.9% to 58.5%]) (Table 6). The site-specific percentage of women who quit smoking during pregnancy among the 26 sites in 2005 ranged from 30.2% in West Virginia to 61.0% in Hawaii (Figure 8; Table 6).

The 2005 aggregated data from 26 sites indicate that women who quit smoking during pregnancy differed from those who continued to smoke. Compared with women who did not quit smoking, women who quit were more likely to be Hispanic or Asian/Pacific Islander, had >12 years of education, were married, had an annual income of ≥$15,000, had an intended pregnancy, had normal or overweight body mass index, were first-time mothers, initiated prenatal care in the first trimester, were not Medicaid-enrolled, were not enrolled in WIC, did not use alcohol during pregnancy, and smoked fewer cigarettes before pregnancy (Table 7).

Smoking After Delivery

On the basis of aggregated data from the 16 sites, the prevalence of smoking after delivery decreased significantly (from 18.1% to 16.4%) during the study period (Figure 1; Table 8). The prevalence of smoking after delivery increased significantly for three sites (Louisiana [from 18.7% to 23.4%], Ohio [from 24.2% to 27.4%], and West Virginia [from 31.6% to 39.3%]) and decreased significantly for two sites (New Mexico [from 16.0% to 13.1%] and Utah [from 9.5% to 7.3%]) (Table 8). In 2005, the site-specific prevalence of smoking after delivery among the 26 states ranged from 7.3% in Utah to 39.3% in West Virginia (Figures 9 and 10; Table 8).

Relapsing to Smoking After Delivery

On the basis of aggregated data from the 16 sites, the percentage of women who relapsed to smoking after delivery was not statistically different (50.3% in 2000 compared with 51.4% in 2005) (Table 9). During the study period, the percentage of women relapsing to smoking after delivery increased significantly for three sites (Arkansas [from 43.1% to 62.0%], Minnesota [from 40.1% to 54.5%], and Vermont [from 34.7% to 44.0%]) (Table 9). In 2005, the percentage of women in the 26 sites who relapsed to smoking after delivery ranged from 36.4% in Oregon to 62.0% in Arkansas (Figure 11; Table 9).

Characteristics of women who quit smoking during pregnancy and did not start smoking again after delivery differed from those of women who relapsed to smoking. Compared with women who did not start smoking again after delivery, women who relapsed to smoking after delivery were significantly more likely to be aged <25 years, be non-Hispanic black, have <12 years of education, be unmarried, have an annual income of <$15,000, have had an unintended pregnancy, have entered prenatal care during or after the second trimester, have had Medicaid coverage, and be enrolled in WIC during pregnancy (Table 10).

Discussion

During 2000--2005, the overall aggregated prevalence of smoking before pregnancy for the 16 sites for which data were available for all 6 years remained unchanged, with approximately one in five women (from 22.3% in 2000 to 21.5% in 2005) reporting smoking during the 3 months before pregnancy. This finding suggests that efforts in the United States to prevent smoking and increase cessation among female smokers before becoming pregnant have not been effective. However, during 2000--2005, significant declines occurred in the prevalence of women smoking while pregnant (from 15.2% to 13.8%) and after delivery (from 18.1% to 16.4%), suggesting that efforts targeting pregnant and postpartum women have been effective. During 2000--2005, two sites (New Mexico and Utah) had decreases in the smoking prevalence before, during, and after pregnancy, and two sites (Illinois and New Jersey) had decreases in the smoking prevalence during pregnancy only. Three sites (Louisiana, Ohio, and West Virginia) had increases in the prevalence of smoking before, during, and after pregnancy, and Arkansas had increases in the smoking prevalence before pregnancy. For the majority of sites, smoking rates did not change over time before, during, or after pregnancy.

The 31 PRAMS sites included in this report have achieved the HP 2010 objective of increasing the percentage of pregnant smokers who stop smoking during pregnancy to 30%, although variations occurred across the PRAMS sites. In 2005, quit rates during pregnancy ranged from 30.2% in West Virginia to 61.0% in Hawaii. However, none of the sites achieved the HP 2010 objective of reducing prevalence of smoking during pregnancy to 1%; site-specific prevalence of smoking during pregnancy in 2005 ranged from 5.2% in New York City to 35.7% in West Virginia.

State tobacco-control efforts should be increased to achieve the HP 2010 objective of reducing prenatal smoking to 1%. Effective state and local strategies to prevent the initiation of smoking or to increase smoking cessation among nonpregnant women include banning all forms of tobacco advertisement, enforcing laws that prohibit sales to children and adolescents, promoting smoke-free policies in public places and in the workplace, and increasing taxes on cigarettes (16). A 10.0% increase in the price of tobacco products would result in an estimated 3.7% decrease in the number of adolescents who use tobacco and an estimated 4.1% decrease in the amount of tobacco used by the general population (16). Raising state tobacco taxes might assist states with high smoking rates and current low excise tax rates. In 2008, state tobacco excise taxes ranged from $0.07 to $2.75 per pack, and 25 states (Alabama, Arkansas, California, Colorado, Florida, Georgia, Idaho, Illinois, Indiana, Kansas, Kentucky, Louisiana, Mississippi, Missouri, Nebraska, Nevada, New Mexico, North Carolina, North Dakota, South Carolina, Tennessee, Utah, Virginia, West Virginia, and Wyoming) had excises taxes lower than $1.00 per pack (17).

Smoking cessation counseling and programs offered during prenatal care can provide effective assistance to encourage pregnant women to quit smoking, especially women who were light- to moderate-level smokers before becoming pregnant (i.e., women who smoke <1 pack of cigarettes a day) (18,19). However, the number of smokers who are offered such interventions is unknown. Studies of prenatal care providers in a few states indicate that approximately 30%--60% provide intensive interventions or referrals to cessation programs to pregnant smokers (20--22). Therefore, health-care providers can increase promotion and use of evidence-based cessation services. Each state has a telephone quitline that provides cessation counseling and support and is a free resource that can be promoted (e.g., through mass media campaigns and provider referrals) to all smokers (23).

Because higher rates of smoking during pregnancy were observed among Medicaid-enrolled women, comprehensive Medicaid coverage of tobacco-dependence treatments needs to be made available for all smokers who want to quit. As of 2006, seven state Medicaid programs (California, Indiana, Minnesota, New York, Oregon, Pennsylvania, and West Virginia) covered all forms of tobacco-dependence medications and at least one form of counseling, and 39 programs covered at least one form of treatment (24). However, even when coverage is available, providers and patients often are unaware of the Medicaid coverage. In a survey conducted in two states with comprehensive Medicaid coverage of cessation treatment, only 36% of Medicaid-enrolled smokers and 60% of Medicaid physicians knew that their state Medicaid program offered any coverage for tobacco-dependence treatments (25). States can encourage Medicaid coverage for tobacco-dependence treatments for all smokers and promote awareness of this coverage among providers and patients.

The results presented in this report indicate that smoking trends differed among racial/ethnic populations and age groups. During 2000--2005, prenatal smoking rates increased among non-Hispanic white women aged 20--24 years and among non-Hispanic black women aged 25--34 years. However, these rates declined among other ages in these racial/ethnic populations. The increase in smoking rates among non-Hispanic white women aged 20--24 years is similar to the increase in smoking rates among young adults aged 18--24 years reported for 1991--2002 (26). This increase might be attributable to tobacco marketing directed at these age groups or to a cohort effect of teens who had high smoking rates in the 1990s. Further analyses are needed to explore the increases and disparities of prevalence rates among subpopulations of pregnant smokers.

Pregnancy is an opportune time to encourage women to quit smoking for their lifetime. The data provided in this report indicate that 53.0% of women who quit smoking during pregnancy reported smoking cigarettes at the time they completed the PRAMS questionnaire, an average of 4 months after delivery. In 2005, relapse rates varied among PRAMS sites (range: 36.4% [Oregon]--62.0% [Arkansas]). Women who were more likely to relapse to smoking after delivery were younger and had a lower annual income. Other important factors associated with relapse include living with a partner who smoked and experiencing a stressful life event and depression (27). Effective clinic-based interventions to prevent postpartum relapse do not exist; a meta-analysis of nine interventions to prevent relapse among pregnant and postpartum ex-smokers did not find any significant benefit (28). Relapse to smoking is common among quit attempts, and women should be encouraged to make additional attempts if relapse occurs. However, community-based interventions, (e.g., raising cigarette taxes) have been demonstrated to be effective in reducing relapse rates (11).

Limitations

Previous studies have determined that women underreport smoking and overreport quitting smoking (29,30). PRAMS is a self-administered, mailed, and confidential survey. More pregnant smokers are identified on the PRAMS questionnaire than the birth certificate, which is based on women reporting smoking to their health-care provider, suggesting that women might be more likely to report smoking through a confidential and anonymous survey than to their health-care providers (31,32). Underreporting of prenatal smoking was addressed by combining smoking reported on the PRAMS questionnaire and the linked birth certificate. However, because PRAMS data are based on self-reporting and are not validated biochemically, the data provided in this report probably underestimate the burden of smoking among pregnant women (33). In addition, PRAMS samples only women who have delivered a live infant and cannot estimate the total prevalence of smoking among all pregnant women, specifically those who did not have a live birth outcome (e.g., spontaneous abortions, ectopic pregnancies, or still-birth). Finally, the findings of this report are generalizable only to the PRAMS sites included in the analyses.

Conclusion

PRAMS is an effective state-level tool to monitor and evaluate the impact of tobacco-control activities. Additional resources for monitoring and evaluating tobacco-control efforts include 1) CDC's State Tobacco Activities Tracking and Evaluation system, which provides detailed information on state-level tobacco-control activities (e.g., tobacco excise taxes and smoke-free regulations in child care centers) and 2) CDC's Smoking-Attributable Mortality, Morbidity, and Economic Costs system, which estimates the health and health-related economic consequences of smoking to both adults and infants (34,35).

The majority of negative pregnancy outcomes are of unknown etiology (36). However, smoking during pregnancy is one behavior known to result in infant morbidity and mortality and for which effective cessation interventions exist. States can reduce smoking during pregnancy through sustained and comprehensive tobacco-control activities, including promoting policies that establish smoke-free environments in public places and the workplace, increasing tobacco excise taxes, banning all forms of tobacco advertisement, enforcing laws to prohibit sales to children and adolescents, using mass media campaigns, and ensuring adequate health-care coverage for cessation services.

On the clinical level, primary and prenatal health-care providers can assess their patients' smoking status, offer smoking cessation interventions, or refer smoking patients to effective cessation services. Maternal and child health-care practitioners should work in concert with state tobacco-control professionals to achieve the HP 2010 objective of reducing prenatal smoking to 1%.

Acknowledgments

The following persons assisted in the preparation of this report: E. Kathleen Adams, PhD, Rollins School of Public Health, Emory University, Atlanta, Georgia; Brian Morrow, MA, Dabo Brantley, MPH, Lucinda England, MD, Juliette Kendrick, MD, Division of Reproductive Health, National Center for Chronic Disease Prevention and Health Promotion, CDC.

References

  1. Salihu HM, Aliyu MH, Pierre-Louis BJ, Alexander GR. Levels of excess infant deaths attributable to maternal smoking during pregnancy in the United States. Matern Child Health J 2003;7:219--27.
  2. CDC. Women and smoking: a report of the Surgeon General. Atlanta, GA: US Department of Health and Human Services, CDC; 2001.
  3. CDC. The health consequences of smoking: a report of the Surgeon General. Atlanta, GA: US Department of Health and Human Services, CDC; 2004.
  4. DiFranza JR, Aligne CA, Weitzman M. Prenatal and postnatal environmental tobacco smoke exposure and children's health. Pediatrics 2004;113(Suppl 4):1007--15.
  5. Jedrychowski W, Flak E. Maternal smoking during pregnancy and postnatal exposure to environmental tobacco smoke as predisposition factors to acute respiratory infections. Environ Health Perspect 1997;105:302--6.
  6. CDC. The health consequences of involuntary exposure to tobacco smoke: a report of the Surgeon General. Atlanta, GA: US Department of Health and Human Services, CDC; 2006.
  7. CDC. Smoking-attributable mortality, years of potential life lost, and productivity losses---United States, 2000--2004. MMWR 2008;57:1226--8.
  8. Martin JA, Hamilton BE, Sutton PD, et al. Births: final data for 2005. Natl Vital Stat Rep 2007;56(6).
  9. CDC. Smoking prevalence among women of reproductive age---United States, 2006. MMWR 2008;57:849--52.
  10. US Department of Health and Human Services. Healthy people 2010. 2nd ed. With understanding and improving health and objectives for improving health (2 vols). Washington, DC: US Department of Health and Human Services; 2000.
  11. Colman GJ, Joyce T. Trends in smoking before, during, and after pregnancy in ten states. Am J Prev Med 2003;24:29--35.
  12. Suellentrop K, Morrow B, Williams L, D'Angelo D. Monitoring progress toward achieving maternal and infant Healthy People 2010 objectives---19 states, Pregnancy Risk Assessment Monitoring System (PRAMS), 2000--2003. In: Surveillance Summaries, October 6, 2006. MMWR 2006;55(No. SS-9).
  13. Shulman HB, Gilbert BC, Lansky A. The Pregnancy Risk Assessment Monitoring System (PRAMS): current methods and evaluation of 2001 response rates. Public Health Rep 2006;121:74--83.
  14. CDC. Pregnancy Risk Assessment Monitoring System (PRAMS): Questionnaire. Phase 4 (2000--2003) core questions, phase 4 (2000--2003) standard questions, phase 5 (2004--2008) core questions, and phase 5 (2004--2008) standard questions. Available at http://www.cdc.gov/PRAMS/Questionnaire.htm.
  15. Shah B, Barnwell B, Bieler G. SUDAAN user's manual: software for the statistical analysis of correlated data. Release 7.5. Research Triangle Park, NC: Research Triangle Institute; 1997.
  16. Hopkins DP, Briss PA, Ricard CJ, et al. Reviews of evidence regarding interventions to reduce tobacco use and exposure to environmental tobacco smoke. Am J Prev Med 2001;20(Suppl 2):16--66.
  17. CDC. State excise tax fact sheet. Atlanta, GA: US Department of Health and Human Services, CDC; 2007. Available at http://apps.nccd.cdc.gov/statesystem/publications/STATESystemFactSheetTax.pdf.
  18. Fiore MC, Bailey WC, Cohen SJ, Dorfman SF, Goldstein MG, Gritz ER. Treating tobacco use and dependence: clinical practice guidelines. Rockville, MD, US Department of Health and Human Services, Public Health Service; 2008.
  19. Lumley J, Oliver SS, Chamberlain C, Oakley L. Interventions for promoting smoking cessation during pregnancy. Cochrane Database Syst Rev 2004;4:CD001055.
  20. Hartmann KE, Wechter ME, Payne P, Salisbury K, Jackson RD, Melvin CL. Best practice smoking cessation intervention and resource needs of prenatal care providers. Obstet Gynecol 2007;110:765--70.
  21. Price JH, Jordan TR, Dake JA. Obstetricians and gynecologists' perceptions and use of nicotine replacement therapy. J Community Health 2006;31:160--75.
  22. Tong VT, England LJ, Dietz PM, Asare LA. Smoking patterns and use of cessation interventions during pregnancy. Am J Prev Med 2008;
    35:327--33.
  23. US Department of Health and Human Services. 1-800-QUIT-NOW. Washington, DC: US Department of Health and Human Services; 2007. Available at http://1800quitnow.cancer.gov.
  24. CDC. State Medicaid coverage for tobacco-dependence treatments---United States, 2006. MMWR 2008;57:117--22.
  25. McMenamin SB, Halpin HA, Ibrahim JK, Orleans CT. Physician and enrollee knowledge of Medicaid coverage for tobacco dependence treatments. Am J Prev Med 2004;26:99--104.
  26. CDC. Cigarette smoking among adults---United States, 2004. MMWR 2005;54:1121--4.
  27. Fang WL, Goldstein AO, Butzen AY, et al. Smoking cessation in pregnancy: a review of postpartum relapse prevention strategies. J Am Board Fam Pract 2004;17:264--75.
  28. Hajek P, Stead LF, West R, Jarvis M. Relapse prevention interventions for smoking cessation. Cochrane Database Syst Rev 2005;1:CD003999.
  29. Ford RP, Tappin DM, Schluter PJ, Wild CJ. Smoking during pregnancy: how reliable are maternal self reports in New Zealand? J Epidemiol Community Health 1997;51:246--51.
  30. Lawrence T, Aveyard P, Croghan E. What happens to women's self-reported cigarette consumption and urinary cotinine levels in pregnancy? Addiction 2003;98:1315--20.
  31. Allen AM, Dietz PM, Tong VT, England L, Prince CB. Prenatal smoking prevalence ascertained from two population-based data sources: birth certificates and PRAMS questionnaires, 2004. Public Health Rep 2008;123:586--92.
  32. Northam S, Knapp TR. The reliability and validity of birth certificates. J Obstet Gynecol Neonatal Nurs 2006;35:3--12.
  33. Russell T, Crawford M, Woodby L. Measurements for active cigarette smoke exposure in prevalence and cessation studies: why simply asking pregnant women isn't enough. Nicotine Tob Res 2004(6 Suppl 2):
    S141--51.
  34. CDC. State Tobacco Activities Tracking and Evaluation (STATE) System. Atlanta, GA: US Department of Health and Human Services, CDC; 2008. Available at http://apps.nccd.cdc.gov/statesystem.
  35. CDC. Smoking-Attributable Mortality, Morbidity, and Economic Costs (SAMMEC). Atlanta, GA: US Department of health and Human Services, CDC; 2008. Available at http://apps.nccd.cdc.gov/sammec.
  36. Goldenberg RL, Rouse DJ. Prevention of premature birth. N Engl J Med 1998;339:313--20.

* Because New York state and New York City have separate vital records registries and collect data as independent projects, data for these two PRAMS sites are reported separately.

Compared with the 1989 birth certificate, which had a check box for smoking at any time during pregnancy, the 2003 revised birth certificate has three check boxes, one for smoking during each trimester of pregnancy. For the analysis, smoking during each trimester of pregnancy was aggregated to indicate smoking at any time during pregnancy on the basis of the birth certificate. Four PRAMS states (New York [2004], Nebraska [2005], South Carolina [2004], and Washington [2003]) have implemented the 2003 revised birth certificate.

FIGURE 1. Prevalence of smoking before pregnancy, during pregnancy, and after delivery,* by year --- Pregnancy Risk Assessment Monitoring System (PRAMS), United States, 16 sites, 2000--2005

Prevalence of smoking before pregnancy, during pregnancy, and after delivery,* by year --- Pregnancy Risk Assessment Monitoring System (PRAMS), United States, 16 sites,† 2000--2005

* Smoking before pregnancy = smoking 3 months before pregnancy on the basis of the PRAMS survey. Smoking during pregnancy = smoking during the last 3 months of pregnancy on the basis of the PRAMS survey or smoking at any time during pregnancy on the basis of the birth certificate. Smoking after delivery = smoking approximately 4 months after delivery on the basis of the PRAMS survey.

Data aggregated for 16 PRAMS sites (Alaska, Arkansas, Colorado, Florida, Hawaii, Illinois, Maine, Nebraska, New Mexico, New York [excluding New York City], North Carolina, Oklahoma, South Carolina, Utah, Washington, and West Virginia) with data available for all years.

§ Significant linear trend was p≤0.05.

FIGURE 2. Prevalence of smoking 3 months before pregnancy --- Pregnancy Risk Assessment Monitoring System (PRAMS), United States, 26 sites, 2005

Prevalence of smoking 3 months before pregnancy --- Pregnancy Risk Assessment Monitoring System (PRAMS), United States, 26 sites, 2005

* Births for New York City are reported separately.

FIGURE 3. Prevalence of smoking 3 months before pregnancy --- Pregnancy Risk Assessment Monitoring System, United States, 26 sites,* 2005

Prevalence of smoking 3 months before pregnancy --- Pregnancy Risk Assessment Monitoring System, United States, 26 sites,* 2005

* Alaska, Arkansas, Colorado, Florida, Georgia, Hawaii, Illinois, Maine, Maryland, Michigan, Minnesota, Nebraska, New Jersey, New Mexico, New York, New York City, North Carolina, Ohio, Oklahoma, Oregon, Rhode Island, South Carolina, Utah, Vermont, Washington, and West Virginia.

FIGURE 4. Prevalence of smoking during pregnancy* --- Pregnancy Risk Assessment Monitoring System (PRAMS), United States, 26 sites, 2005

Prevalence of smoking during pregnancy* --- Pregnancy Risk Assessment Monitoring System (PRAMS), United States, 26 sites, 2005

* Smoking during pregnancy = smoking during the last 3 months of pregnancy on the basis of the PRAMS survey or smoking at any time during pregnancy on the basis of the birth certificate.

Births for New York City are reported separately.

FIGURE 5. Prevalence of smoking during pregnancy* --- Pregnancy Risk Assessment Monitoring System (PRAMS), United States, 26 sites, 2005

Prevalence of smoking during pregnancy* --- Pregnancy Risk Assessment Monitoring System (PRAMS), United States, 26 sites,† 2005

* Smoking during pregnancy = smoking during the last 3 months of pregnancy on the basis of the PRAMS survey or smoking at any time during pregnancy on the basis of the birth certificate.

Alaska, Arkansas, Colorado, Florida, Georgia, Hawaii, Illinois, Maine, Maryland, Michigan, Minnesota, Nebraska, New Jersey, New Mexico, New York (excluding New York City), New York City, North Carolina, Ohio, Oklahoma, Oregon, Rhode Island, South Carolina, Utah, Vermont, Washington, and West Virginia.

FIGURE 6. Prevalence of smoking during pregnancy,* by maternal race/ethnicity and year --- Pregnancy Risk Assessment Monitoring System (PRAMS), United States, 16 sites, 2000--2005

Prevalence of smoking during pregnancy,* by maternal race/ethnicity and year --- Pregnancy Risk Assessment Monitoring System (PRAMS), United States, 16 sites,† 2000--2005

* Smoking during pregnancy = smoking during the last 3 months of pregnancy on the basis of the PRAMS survey or smoking at any time during pregnancy on the basis of the birth certificate.

Data aggregated for 16 PRAMS sites (Alaska, Arkansas, Colorado, Florida, Hawaii, Illinois, Maine, Nebraska, New Mexico, New York [excluding New York City], North Carolina, Oklahoma, South Carolina, Utah, Washington, and West Virginia) with data available for all years.

§ Significant linear trend was p≤0.05.

FIGURE 7. Prevalence of smoking during pregnancy,* by maternal age group and year --- Pregnancy Risk Assessment Monitoring System (PRAMS), United States, 16 sites, 2000--2005

Prevalence of smoking during pregnancy,* by maternal age group and year --- Pregnancy Risk Assessment Monitoring System (PRAMS), United States, 16 sites,† 2000--2005

* Smoking during pregnancy = smoking during the last 3 months of pregnancy on the basis of the PRAMS survey or smoking at any time during pregnancy on the basis of the birth certificate.

Data aggregated for 16 PRAMS sites (Alaska, Arkansas, Colorado, Florida, Hawaii, Illinois, Maine, Nebraska, New Mexico, New York [excluding New York City], North Carolina, Oklahoma, South Carolina, Utah, Washington, and West Virginia) with data available for all years.

§ Significant linear trend was p≤0.05.

FIGURE 8. Percentage of women who quit smoking by the last 3 months of pregnancy* --- Pregnancy Risk Assessment Monitoring System (PRAMS), United States, 26 sites, 2005

Percentage of women who quit smoking by the last 3 months of pregnancy* --- Pregnancy Risk Assessment Monitoring System (PRAMS), United States, 26 sites, 2005

* Quit smoking = no smoking during the last 3 months of pregnancy among women who smoked 3 months before pregnancy on the basis of the PRAMS survey.

Births for New York City are reported separately.

FIGURE 9. Prevalence of smoking after delivery* --- Pregnancy Risk Assessment Monitoring System (PRAMS), United States, 26 sites, 2005

Prevalence of smoking after delivery* --- Pregnancy Risk Assessment Monitoring System (PRAMS), United States, 26 sites, 2005

* Smoking after delivery = smoking approximately 4 months after delivery on the basis of the PRAMS survey.

Births for New York City are reported separately.

FIGURE 10. Prevalence of smoking after delivery* --- Pregnancy Risk Assessment Monitoring System (PRAMS), United States, 26 sites, 2005

Prevalence of smoking after delivery* --- Pregnancy Risk Assessment Monitoring System (PRAMS), United States, 26 sites,† 2005

* Smoking after delivery = smoking approximately 4 months after delivery on the basis of the PRAMS survey.

Alaska, Arkansas, Colorado, Florida, Georgia, Hawaii, Illinois, Maine, Maryland, Michigan, Minnesota, Nebraska, New Jersey, New Mexico, New York, New York City, North Carolina, Ohio, Oklahoma, Oregon, Rhode Island, South Carolina, Utah, Vermont, Washington, and West Virginia.

FIGURE 11. Percentage of women who relapsed to smoking following delivery after having quit smoking during pregnancy* --- Pregnancy Risk Assessment Monitoring System (PRAMS), United States, 26 sites, 2005

Percentage of women who relapsed to smoking following delivery after having quit smoking during pregnancy* --- Pregnancy Risk Assessment Monitoring System (PRAMS), United States, 26 sites, 2005

* Relapsed to smoking = smoking approximately 4 months after delivery among women who quit smoking during the last 3 months of pregnancy on the basis of the PRAMS survey. Quit smoking = no smoking during the last 3 months of pregnancy among women who smoked 3 months before pregnancy on the basis of the PRAMS survey.

Births for New York City are reported separately.

TABLE 1. Analysis years, sample size range, response rate range, and average age of infant at survey completion, by days --- Pregnancy Risk Assessment Monitoring System (PRAMS), United States, 31 sites, 2000--2005

Site

Analysis
years

Sample size
range

Response rate
range (%)*

Average age of infant
(days) 2005

Alabama

2000--2003

1,492--1,607

72--77

123.6§

Alaska

2000--2005

1,340--1,642

77--88

116.7

Arkansas

2000--2005

1,655--2,238

74--80

119.7

Colorado

2000--2005

1,975--2,295

71--76

119.0

Florida

2000--2005

1,995--2,161

77--80

146.7

Georgia

2004--2005

1,601--1,799

70--70

137.2

Hawaii

2000--2005

1,724--2,518

79--82

115.1

Illinois

2000--2005

1,621--2,018

78--84

127.6

Louisiana

2000--2004

1,651--2,374

70--75

127.6§

Maine

2000--2005

1,140--1,191

75--78

103.5

Maryland

2001--2005

1,359--1,627

70--73

115.9

Michigan

2001--2005

848--1,568

70--76

109.8

Minnesota

2002--2005

1,153--1,831

76--77

114.6

Mississippi

2003--2004

1,386--1,453

70--72

124.3§

Montana

2002

1,045

79

93.8§

Nebraska

2000--2005

1,758--2,239

80--86

120.4

New Jersey

2002--2005

952--2,291

71--74

123.2

New Mexico

2000--2005

1,056--1,615

70--73

116.9

New York**

2000--2005

1,085--1,262

71--78

121.8

New York City

2004--2005

770--1,026

70--70

110.1

North Carolina

2000--2005

1,030--1,837

70--76

115.5

North Dakota

2002

909

77

111.8§

Ohio

2000--2003, 2005

1,353--1,668

73--78

126.5

Oklahoma

2000--2005

1,878--2,001

77--84

131.8

Oregon

2003--2005

1,508--1,968

74--76

101.6

Rhode Island

2002--2005

1,414--1,533

72--76

108.6

South Carolina

2000--2005

1,419--1,639

70--78

127.8

Utah

2000--2005

1,582--1,970

80--89

108.6

Vermont

2001--2005

1,056--1,392

80--88

111.8

Washington

2000--2005

1,395--1,616

75--82

108.2

West Virginia

2000--2005

870--1,700

72--75

124.1

* Weighted response rates.

Average age of infant by days when the PRAMS survey was completed.

§ Most recent year of data was used if 2005 data were not available.

Sites include partial year of births because of data availability for a given year.

** New York City births reported separately.


TABLE 2. Maternal characteristics among women who smoked before or during pregnancy, or after delivery and among nonsmokers --- Pregnancy Risk Assessment Monitoring System (PRAMS), United States, 26 sites,* 2005

Maternal characteristics

Smoked before or during pregnancy, or after delivery
Unweighted n = 10,485

% (SE)§

Nonsmokers
Unweighted n = 29,882

% (SE)

p value

All women**

22.5 (±0.3)

77.5 (±0.3)


Maternal age group (yrs)


<20

13.0 (±0.6)

8.6 (±0.2)

<0.0001

20--24

36.0 (±0.8)

21.0 (±0.4)

25--34

42.5 (±0.9)

53.7 (±0.5)

≥35

8.4 (±0.5)

16.8 (±0.3)

Maternal race/ethnicity

White, non-Hispanic

76.9 (±0.7)

54.9 (±0.4)

<0.0001

Black, non-Hispanic

10.4 (±0.5)

17.5 (±0.3)

Hispanic

8.1 (±0.5)

20.9 (±0.4)

Alaska Native

0.3 (±0.01)

0.1 (±0.004)

American Indian

1.6 (±0.1)

0.7 (±0.1)

Asian/Pacific Islander

1.6 (±0.2)

4.9 (±0.2)

Other

1.2 (±0.2)

1.1 (±0.1)

Maternal education (yrs)

<12

24.9 (±0.8)

16.9 (±0.3)

<0.0001

12

40.8 (±0.9)

26.3 (±0.4)

>12

34.3 (±0.8)

56.8 (±0.4)

Marital status

Not married

56.0 (±0.9)

31.0 (±0.4)

<0.0001

Married

44.0 (±0.9)

69.0 (±0.4)

Annual income

<$15,000

43.6 (±0.9)

26.0 (±0.4)

<0.0001

≥$15,000

56.4 (±0.9)

74.0 (±0.4)

Prepregnancy body mass index

Underweight (<18.5)

7.1 (±0.5)

4.3 (±0.2)

<0.0001

Normal (18.5--24.9)

51.1 (±0.9)

53.5 (±0.5)

Overweight (25.0--29.9)

20.9 (±0.7)

23.3 (±0.4)

Obese (≥30)

20.9 (±0.7)

18.8 (±0.4)

Pregnancy intention

Intended

44.7 (±0.9)

61.7 (±0.4)

<0.0001

Unintended

55.3 (±0.9)

38.3 (±0.4)

Parity

First birth

45.5 (±0.9)

40.4 (±0.5)

<0.0001

Second or later birth

54.5 (±0.9)

59.6 (±0.5)

Initiation of prenatal care (PNC)

1st Trimester

80.0 (±0.7)

83.1 (±0.3)

0.0002

2nd Trimester

16.0 (±0.6)

13.3 (±0.3)

3rd Trimester or no PNC

4.0 (±0.3)

3.6 (±0.2)

Health insurance coverage during PNC

Medicaid

54.7 (±0.9)

32.2 (±0.4)

<0.0001

Other Insurance

38.3 (±0.8)

58.3 (±0.4)

Uninsured

7.1 (±0.4)

9.5 (±0.3)

WIC†† enrollment during pregnancy

Yes

58.2 (±0.9)

41.2 (±0.4)

<0.0001

No

41.8 (±0.9)

58.8 (±0.4)

Alcohol use during pregnancy

Yes

7.4 (±0.5)

6.8 (±0.2)

0.2485

No

92.6 (±0.5)

93.2 (±0.2)


* Data aggregated for 26 PRAMS sites (Alaska, Arkansas, Colorado, Florida, Georgia, Hawaii, Illinois, Maine, Maryland, Michigan, Minnesota, Nebraska, New Jersey, New Mexico, New York, New York City, North Carolina, Ohio, Oklahoma, Oregon, Rhode Island, South Carolina, Utah, Vermont, Washington, and West Virginia) with data available for 2005.

Smoking before pregnancy = smoking 3 months before pregnancy on the basis of the PRAMS survey. Smoking during pregnancy = smoking during the last 3 months of pregnancy on the basis of the PRAMS survey and smoking at any time during pregnancy on the basis of the birth certificate. Smoking after delivery=smoking approximately 4 months after delivery on the basis of the PRAMS survey.

§ Standard error.

Chi-square significance test.

** Percentages for rows are presented.

†† Special Supplemental Nutrition Program for Women, Infants, and Children.


TABLE 3. Prevalence of smoking during the 3 months before pregnancy, by site and year --- Pregnancy Assessment Monitoring System (PRAMS), United States, 31 sites, 2000--2005

Year

Site 

2000

% (SE*)

2001

% (SE)

2002

% (SE)

2003

% (SE)

2004

% (SE)

2005

% (SE)

Proportion change

p value§

16 PRAMS sites

22.3 (±0.4)

22.5 (±0.4)

22.3 (±0.4)

22.8 (±0.5)

24.0 (±0.5)

21.5 (±0.4)

-3.6

0.76

Alabama

23.0 (±1.3)

26.9 (±1.4)

24.3 (±1.3)

22.9 (±1.4)

---**

---

-0.4

0.69

Alaska

30.8 (±1.4)

27.2 (±1.2)

31.9 (±1.3)

30.9 (±1.3)

30.9 (±1.5)

29.5 (±1.5)

-4.2

0.80

Arkansas

28.6 (±1.6)

32.3 (±1.4)

29.4 (±1.4)

31.0 (±1.5)

34.5 (±1.4)

32.6 (±1.3)

+14.0

0.02††

Colorado

19.9 (±1.1)

21.3 (±1.2)

20.1 (±1.1)

18.7 (±1.1)

21.3 (±1.3)

20.2 (±1.3)

+1.5

0.98

Florida

17.2 (±1.3)

19.7 (±1.4)

19.5 (±1.4)

21.3 (±1.4)

22.1 (±1.4)

17.9 (±1.2)

+4.1

0.29

Georgia§§

---

---

---

---

19.4 (±1.5)

19.1 (±1.4)

-1.5

¶¶

Hawaii

20.2 (±0.9)

20.8 (±0.9)

19.8 (±1.1)

20.8 (±1.1)

20.6 (±0.9)

21.2 (±1.0)

+5.0

0.50

Illinois

20.3 (±1.0)

21.1 (±1.0)

21.6 (±1.0)

21.9 (±1.1)

22.3 (±1.0)

18.8 (±1.0)

-7.4

0.66

Louisiana

21.2 (±1.1)

24.2 (±1.1)

22.7 (±1.2)

24.4 (±1.2)

28.2 (±1.3)

---

+33.0

<0.01††

Maine

31.2 (±1.6)

29.8 (±1.6)

28.9 (±1.6)

29.0 (±1.6)

31.0 (±1.6)

32.1 (±1.6)

+2.9

0.52

Maryland§§

---

18.9 (±1.6)

18.4 (±1.6)

20.6 (±1.6)

20.3 (±1.6)

17.9 (±1.6)

-5.3

0.98

Michigan

---

29.3 (±1.8)

28.9 (±1.3)

27.6 (±1.3)

31.7 (±1.5)

28.8 (±1.4)

-1.7

0.66

Minnesota§§

---

---

27.7 (±1.7)

24.6 (±1.4)

27.6 (±1.5)

27.2 (±1.5)

-1.8

0.67

Mississippi

---

---

---

21.9 (±1.4)

21.4 (±1.4)

---

-2.3

¶¶

Montana

---

---

29.7 (±1.5)

---

---

---

***

¶¶

Nebraska

24.8 (±1.2)

26.9 (±1.1)

27.6 (±1.3)

25.7 (±1.2)

26.1 (±1.3)

25.8 (±1.2)

+4.0

0.99

New Jersey§§

---

---

17.2 (±1.3)

15.7 (±0.8)

16.7 (±0.8)

16.1 (±0.8)

-6.4

0.75

New Mexico§§

21.3 (±1.1)

24.0 (±1.2)

19.8 (±1.1)

18.4 (±1.1)

20.7 (±1.1)

18.8 (±1.3)

-11.7

0.02††

New York†††

27.1 (±1.6)

24.8 (±1.6)

23.3 (±1.6)

25.6 (±1.6)

28.4 (±1.8)

23.0 (±1.6)

-15.1

0.59

New York City§§

---

---

---

---

14.2 (±1.6)

12.4 (±1.3)

-12.7

¶¶

North Carolina§§

24.4 (±1.3)

21.3 (±1.3)

22.5 (±1.3)

23.6 (±1.4)

26.7 (±1.4)

22.5 (±1.7)

-7.8

0.38

North Dakota

---

---

26.4 (±1.4)

---

---

---

***

¶¶

Ohio

28.6 (±1.6)

27.2 (±1.5)

26.6 (±1.6)

32.5 (±1.7)

---

32.0 (±1.8)

+11.9

0.02††

Oklahoma

30.2 (±1.8)

31.8 (±1.8)

31.2 (±1.7)

28.6 (±1.7)

31.8 (±1.8)

31.6 (±1.7)

+4.6

0.74

Oregon

---

---

---

20.2 (±1.7)

23.6 (±1.7)

21.6 (±1.6)

+6.9

0.57

Rhode Island

---

---

21.3 (±1.3)

21.6 (±1.3)

22.2 (±1.3)

21.9 (±1.3)

+2.8

0.71

South Carolina

23.2 (±1.7)

22.8 (±1.7)

22.0 (±1.8)

23.7 (±1.9)

24.7 (±1.8)

25.8 (±1.8)

+11.2

0.17

Utah

14.3 (±1.2)

13.8 (±1.0)

13.6 (±1.2)

11.5 (±1.0)

12.3 (±0.8)

10.2 (±0.7)

-28.7

<0.01††

Vermont§§

---

30.4 (±1.2)

28.4 (±1.4)

25.1 (±1.2)

29.8 (±1.4)

26.9 (±1.4)

-11.5

0.16

Washington

21.4 (±1.5)

20.5 (±1.6)

22.3 (±1.6)

21.4 (±1.6)

19.8 (±1.5)

18.6 (±1.4)

-13.1

0.18

West Virginia§§

36.2 (±1.6)

39.1 (±1.7)

37.0 (±1.7)

38.9 (±1.7)

39.5 (±2.4)

45.8 (±1.7)

+26.5

<0.01††

* Standard error.

Proportion change calculated using the first and last years of data available by site.

§ Linear trends were assessed conducted using logistic regression model for sites with at least 3 years of data.

Data aggregated for 16 PRAMS sites (Alaska, Arkansas, Colorado, Florida, Hawaii, Illinois, Maine, Nebraska, New Mexico, New York [excluding New York City], North Carolina, Oklahoma, South Carolina, Utah, Washington, and West Virginia) with data available for all years.

** Data not available.

†† Significant linear trend was p≤0.05.

§§ Sites include partial year of births because of data availability for a given year.

¶¶ Insufficient data (i.e., <3 years) to assess linear trends.

*** Insufficient data (i.e., <2 years) to calculate change in proportions.

††† New York City births reported separately.


TABLE 4. Prevalence of smoking during pregnancy, by site and year --- Pregnancy Risk Assessment Monitoring System (PRAMS), United States, 31 sites, 2000--2005

Year

Site 

2000

% (SE*)

2001

% (SE)

2002

% (SE)

2003

% (SE)

2004

% (SE)

2005

% (SE)

Proportion
change

p value§

16 PRAMS sites

Combined estimate**

15.2 (±0.4)

14.9 (±0.4)

14.7 (±0.4)

14.5 (±0.4)

14.8 (±0.4)

13.8 (±0.4)

-9.2

0.01††

PRAMS§§

12.7 (±0.3)

12.5 (±0.3)

12.3 (±0.3)

12.3 (±0.4)

12.9 (±0.4)

11.7 (±0.3)

Birth certificate¶¶

11.9 (±0.3)

11.5 (±0.3)

11.2 (±0.3)

10.9 (±0.3)

10.9 (±0.3)

10.2 (±0.3)

Alabama

Combined estimate

16.9 (±1.2)

17.9 (±1.2)

17.0 (±1.1)

14.9 (±1.1)

---***

---

-11.8

0.18

PRAMS

14.0 (±1.1)

15.6 (±1.1)

14.4 (±1.1)

13.3 (±1.1)

---

---

Birth certificate

12.3 (±1.0)

13.8 (±1.0)

12.4 (±1.0)

8.5 (±0.8)

---

---

Alaska

Combined estimate

20.7 (±1.1)

18.1 (±1.0)

21.5 (±1.1)

20.3 (±1.1)

20.3 (±1.3)

19.1 (±1.2)

-7.7

0.76

PRAMS

16.8 (±1.0)

14.7 (±0.9)

17.7 (±1.0)

16.7 (±1.0)

17.4 (±1.2)

16.0 (±1.1)

Birth certificate

17.0 (±1.0)

15.2 (±0.9)

18.0 (±1.0)

16.6 (±1.0)

14.8 (±1.1)

14.5 (±1.0)

Arkansas

Combined estimate

22.4 (±1.5)

23.1 (±1.2)

22.3 (±1.3)

21.0 (±1.2)

24.7 (±1.3)

23.2 (±1.2)

+3.6

0.50

PRAMS

20.3 (±1.4)

20.1 (±1.2)

19.2 (±1.2)

18.5 (±1.2)

23.1 (±1.2)

20.9 (±1.1)

Birth certificate

17.5 (±1.4)

18.7 (±1.2)

16.8 (±1.1)

15.7 (±1.1)

16.5 (±1.1)

16.5 (±1.0)

Colorado

Combined estimate

12.0 (±0.9)

13.3 (±1.0)

12.0 (±0.8)

12.6 (±0.9)

13.0 (±1.0)

12.2 (±1.1)

+1.7

0.93

PRAMS

10.2 (±0.8)

11.4 (±0.9)

10.6 (±0.8)

10.6 (±0.9)

10.4 (±0.9)

10.2 (±1.0)

Birth certificate

8.0 (±0.7)

9.2 (±0.8)

7.5 (±0.6)

8.9 (±0.8)

8.7 (±0.9)

8.8 (±0.9)

Florida

Combined estimate

10.9 (±1.1)

10.8 (±1.0)

11.4 (±1.1)

11.7 (±1.1)

11.9 (±1.1)

10.3 (±0.9)

-5.5

0.94

PRAMS

9.1 (±1.0)

9.4 (±1.0)

10.0 (±1.0)

10.6 (±1.1)

10.0 (±1.0)

8.3 (±0.9)

Birth certificate

8.9 (±1.0)

7.6 (±0.9)

8.1 (±0.9)

7.9 (±0.9)

9.0 (±1.0)

7.5 (±0.8)

Georgia†††

Combined estimate

---

---

---

---

12.2 (±1.2)

11.1 (±1.1)

-9.0

§§§

PRAMS

---

---

---

---

10.5 (±1.1)

10.3 (±1.1)

Birth certificate

---

---

---

---

7.5 (±1.0)

6.5 (±0.9)

Hawaii

Combined estimate

10.2 (±0.6)

11.4 (±0.7)

10.1 (±0.8)

11.1 (±0.8)

10.1 (±0.7)

10.0 (±0.7)

-2.0

0.52

PRAMS

8.4 (±0.6)

9.5 (±0.6)

8.1 (±0.7)

9.3 (±0.8)

8.1 (±0.6)

8.4 (±0.7)

Birth certificate

6.5 (±0.5)

6.8 (±0.5)

5.6 (±0.5)

5.5 (±0.5)

5.9 (±0.6)

5.9 (±0.6)

Illinois

Combined estimate

14.6 (±0.9)

14.1 (±0.8)

13.2 (±0.8)

13.7 (±0.9)

13.1 (±0.8)

11.3 (±0.8)

-22.6

0.01††

PRAMS

12.5 (±0.8)

12.6 (±0.8)

11.4 (±0.8)

12.6 (±0.9)

12.1 (±0.8)

10.4 (±0.8)

Birth certificate

10.5 (±0.7)

10.4 (±0.7)

10.1 (±0.7)

10.2 (±0.8)

9.0 (±0.7)

7.4 (±0.7)

Louisiana

Combined estimate

13.7 (±0.9)

15.0 (±0.9)

13.7 (±0.9)

16.5 (±1.1)

18.9 (±1.1)

---

+38.0

<0.01††

PRAMS

11.9 (±0.8)

12.8 (±0.9)

11.8 (±0.9)

14.5 (±1.0)

17.7 (±1.1)

---

Birth certificate

8.7 (±0.7)

10.0 (±0.8)

9.2 (±0.8)

10.3 (±0.9)

9.9 (±0.9)

---

Maine

Combined estimate

22.2 (±1.4)

20.3 (±1.4)

19.5 (±1.4)

18.9 (±1.4)

21.5 (±1.4)

19.6 (±1.4)

-11.7

0.39

PRAMS

17.5 (±1.3)

17.3 (±1.3)

15.9 (±1.3)

16.2 (±1.3)

20.0 (±1.4)

17.5 (±1.3)

Birth certificate

17.9 (±1.3)

16.8 (±1.3)

15.5 (±1.3)

14.1 (±1.2)

16.0 (±1.3)

14.6 (±1.2)

Maryland†††

Combined estimate

---

10.9 (±1.3)

9.7 (±1.2)

12.0 (±1.3)

11.8 (±1.3)

10.8 (±1.3)

-0.9

0.61

PRAMS

---

9.4 (±1.2)

8.3 (±1.1)

11.1 (±1.3)

10.3 (±1.2)

10.0 (±1.3)

Birth certificate

---

8.0 (±1.1)

6.6 (±1.0)

8.9 (±1.1)

7.5 (±1.1)

6.2 (±1.0)

Michigan

Combined estimate

---

22.3 (±1.7)

19.0 (±1.1)

18.7 (±1.1)

21.2 (±1.3)

17.5 (±1.2)

-21.5

0.18

PRAMS

---

20.0 (±1.7)

17.4 (±1.1)

15.6 (±1.1)

18.9 (±1.3)

15.8 (±1.1)

Birth certificate

---

17.6 (±1.6)

14.4 (±1.0)

14.2 (±1.0)

15.2 (±1.2)

13.4 (±1.1)

Minnesota†††

Combined estimate

---

---

17.9 (±1.4)

15.7 (±1.1)

17.5 (±1.3)

16.6 (±1.2)

-7.3

0.82

PRAMS

---

---

15.4 (±1.4)

14.9 (±1.1)

15.9 (±1.2)

15.6 (±1.2)

Birth certificate

---

---

11.5 (±1.2)

10.2 (±1.0)

10.8 (±1.1)

9.5 (±1.0)

Mississippi

Combined estimate

---

---

---

15.6 (±1.2)

15.5 (±1.2)

---

-0.6

§§§

PRAMS

---

---

---

13.5 (±1.1)

13.9 (±1.2)

---

Birth certificate

---

---

---

9.3 (±0.9)

10.1 (±1.0)

---

Montana

Combined estimate

---

---

20.5 (±1.3)

---

---

---

¶¶¶

§§§

PRAMS

---

---

15.9 (±1.2)

---

---

---

Birth certificate

---

---

16.8 (±1.2)

---

---

---

Nebraska

Combined estimate

16.0 (±1.0)

17.4 (±0.9)

17.5 (±1.1)

16.1 (±1.0)

16.9 (±1.1)

18.4 (±1.1)

+15.0

0.29

PRAMS

14.0 (±1.0)

14.8 (±0.9)

14.4 (±1.1)

13.0 (±1.0)

16.0 (±1.1)

15.2 (±1.0)

Birth certificate

13.4 (±1.0)

13.5 (±0.8)

13.7 (±1.0)

12.5 (±0.9)

12.8 (±1.0)

15.4 (±1.0)

New Jersey†††

Combined estimate

---

---

11.5 (±0.8)

10.9 (±0.4)

10.6 (±0.4)

9.8 (±0.4)

-14.8

0.03††

PRAMS

---

---

9.0 (±0.8)

7.9 (±0.5)

7.9 (±0.4)

6.7 (±0.4)

Birth certificate

---

---

8.4 (±0.1)

8.1 (±0.1)

8.1 (±0.03)

7.8 (±0.04)

New Mexico†††

Combined estimate

13.1 (±0.9)

14.4 (±1.0)

11.1 (±0.8)

10.5 (±0.9)

11.3 (±0.9)

11.3 (±1.0)

-13.7

0.01††

PRAMS

9.3 (±0.8)

10.7 (±0.9)

8.2 (±0.7)

8.2 (±0.8)

9.9 (±0.8)

8.6 (±0.9)

Birth certificate

10.2 (±0.8)

11.6 (±1.0)

8.3 (±0.8)

8.1 (±0.8)

6.8 (±0.7)

7.9 (±0.9)

New York****

Combined estimate

19.8 (±1.5)

18.0 (±1.4)

17.1 (±1.4)

18.1 (±1.4)

19.1 (±1.6)

15.6 (±1.3)

-21.2

0.17

PRAMS

17.0 (±1.4)

14.4 (±1.3)

14.6 (±1.3)

14.6 (±1.3)

15.6 (±1.5)

12.9 (±1.2)

Birth certificate

15.5 (±1.3)

14.0 (±1.2)

12.2 (±1.2)

14.4 (±1.3)

15.7 (±1.5)

12.7 (±1.3)

New York City†††

Combined estimate

---

---

---

---

7.8 (±1.2)

5.2 (±0.9)

-33.3

§§§

PRAMS

---

---

---

---

7.6 (±1.2)

5.0 (±0.9)

Birth certificate

---

---

---

---

2.1 (±0.6)

0.8 (±0.4)

North Carolina†††

Combined estimate

16.6 (±1.1)

15.0 (±1.1)

14.6 (±1.1)

16.2 (±1.2)

16.8 (±1.2)

14.3 (±1.4)

-13.9

0.82

PRAMS

13.9 (±1.1)

12.2 (±1.0)

11.7 (±1.0)

13.2 (±1.1)

14.8 (±1.1)

13.3 (±1.3)

Birth certificate

13.9 (±1.1)

13.1 (±1.1)

11.5 (±1.0)

13.4 (±1.1)

12.3 (±1.1)

10.0 (±1.2)

North Dakota

Combined estimate

---

---

19.6 (±1.2)

---

---

---

¶¶¶

§§§

PRAMS

---

---

15.6 (±1.2)

---

---

---

Birth certificate

---

---

15.0 (±1.1)

---

---

---

Ohio

Combined estimate

20.2 (±1.4)

19.2 (±1.3)

20.8 (±1.4)

23.0 (±1.5)

---

23.8 (±1.6)

+17.8

0.02††

PRAMS

17.1 (±1.3)

17.5 (±1.3)

17.6 (±1.4)

19.0 (±1.5)

---

21.6 (±1.6)

Birth certificate

15.7 (±1.3)

15.5 (±1.2)

17.5 (±1.4)

18.1 (±1.4)

---

18.6 (±1.5)

Oklahoma

Combined estimate

19.7 (±1.5)

24.1 (±1.6)

23.7 (±1.6)

19.3 (±1.5)

20.3 (±1.5)

21.8 (±1.5)

+10.7

0.67

PRAMS

16.9 (±1.4)

20.3 (±1.6)

20.0 (±1.5)

16.2 (±1.4)

19.0 (±1.5)

19.6 (±1.5)

Birth certificate

15.4 (±1.5)

18.0 (±1.5)

18.2 (±1.4)

14.0 (±1.3)

13.2 (±1.3)

15.7 (±1.3)

Oregon

Combined estimate

---

---

---

14.7 (±1.5)

15.2 (±1.4)

15.1 (±1.4)

+2.7

0.86

PRAMS

---

---

---

12.1 (±1.4)

13.7 (±1.4)

13.7 (±1.3)

Birth certificate

---

---

---

11.7 (±1.4)

12.2 (±1.3)

12.4 (±1.3)

Rhode Island

Combined estimate

---

---

14.5 (±1.1)

12.2 (±1.0)

12.7 (±1.0)

12.3 (±1.0)

-15.2

0.20

PRAMS

---

---

12.9 (±1.1)

10.5 (±1.0)

11.3 (±1.0)

11.7 (±1.0)

Birth certificate

---

---

11.6 (±1.0)

10.4 (±0.9)

9.9 (±0.9)

9.6 (±0.9)

South Carolina

Combined estimate

15.4 (±1.4)

15.2 (±1.4)

17.0 (±1.6)

14.2 (±1.5)

16.0 (±1.5)

19.2 (±1.6)

+24.7

0.14

PRAMS

12.4 (±1.3)

13.0 (±1.4)

13.1 (±1.5)

11.4 (±1.4)

13.9 (±1.5)

14.9 (±1.5)

Birth certificate

11.3 (±1.2)

12.1 (±1.3)

14.2 (±1.5)

11.8 (±1.4)

12.3 (±1.4)

15.7 (±1.5)

Utah

Combined estimate

9.9 (±1.1)

9.0 (±0.8)

8.4 (±1.0)

5.6 (±0.7)

7.9 (±0.6)

6.2 (±0.5)

-37.4

<0.01††

PRAMS

7.3 (±0.9)

7.7 (±0.8)

6.8 (±0.9)

3.9 (±0.6)

6.6 (±0.6)

5.1 (±0.5)

Birth certificate

9.1 (±1.0)

7.1 (±0.7)

7.4 (±0.9)

4.7 (±0.7)

6.3 (±0.6)

5.0 (±0.5)

Vermont†††

Combined estimate

---

22.7 (±1.1)

21.6 (±1.2)

18.9 (±1.1)

22.6 (±1.3)

19.4 (±1.2)

-14.5

0.12

PRAMS

---

17.8 (±1.0)

18.2 (±1.2)

15.3 (±1.0)

18.0 (±1.2)

16.4 (±1.2)

Birth certificate

---

20.3 (±1.1)

19.4 (±1.2)

16.8 (±1.1)

19.9 (±1.3)

16.7 (±1.2)

Washington

Combined estimate

14.3 (±1.3)

13.1 (±1.3)

14.4 (±1.4)

12.3 (±1.2)

12.0 (±1.2)

11.7 (±1.2)

-18.2

0.09

PRAMS

11.1 (±1.2)

9.9 (±1.2)

11.8 (±1.3)

10.2 (±1.2)

10.3 (±1.1)

9.2 (±1.1)

Birth certificate

11.8 (±1.2)

11.1 (±1.3)

12.8 (±1.4)

9.2 (±1.1)

8.9 (±1.1)

9.0 (±1.1)

West Virginia†††

Combined estimate

29.4 (±1.5)

29.8 (±1.6)

29.7 (±1.5)

32.2 (±1.6)

31.7 (±2.3)

35.7 (±1.7)

+21.4

<0.01††

PRAMS

24.5 (±1.5)

26.1 (±1.5)

25.3 (±1.5)

27.5 (±1.6)

28.4 (±2.2)

31.9 (±1.6)

Birth certificate

25.8 (±1.5)

25.1 (±1.5)

24.9 (±1.5)

27.2 (±1.5)

25.4 (±2.1)

29.7 (±1.6)

* Standard error.

Proportion change calculated using the first and last years of data available by site.

§ Linear trends analysis was conducted using logistic regression model for sites with at least 3 years of data.

Data aggregated for 16 PRAMS sites (Alaska, Arkansas, Colorado, Florida, Hawaii, Illinois, Maine, Nebraska, New Mexico, New York, North Carolina, Oklahoma, South Carolina, Utah, Washington, and West Virginia) with data for all years.

** Smoking during the last 3 months of pregnancy on the basis of the PRAMS survey or smoking any time during pregnancy on the basis of the birth certificate.

†† Significant linear trend was p≤0.05.

§§ Smoking during the last 3 months of pregnancy on the basis of the PRAMS survey.

¶¶ Smoking any time during pregnancy on the basis of the birth certificate.

*** Data not available.

††† Sites include partial year of births because of data availability for a given year.

§§§ Insufficient data (i.e., <3 years) to assess linear trends.

¶¶¶ Insufficient data (i.e., <2 years) to calculate change in proportions.

**** New York City births reported separately.


TABLE 5. Prevalence of smoking during pregnancy, by maternal race/ethnicity and age group, by year --- Pregnancy Risk Assessment Monitoring System (PRAMS), United States, 16 sites,* 2000--2005

Year

Characteristic

2000

% (SE)

2001

% (SE)

2002

% (SE)

2003

% (SE)

2004

% (SE)

2005

% (SE)

Proportion change§

p value

16 PRAMS sites

15.2 (±0.4)

14.9 (±0.4)

14.7 (±0.4)

14.5 (±0.4)

14.8 (±0.4)

13.8 (±0.4)

-9.2

0.01**

Maternal race/ethnicity


White, non-Hispanic

19.2 (±0.5)

18.8 (±0.5)

19.2 (±0.5)

18.5 (±0.5)

18.6 (±0.5)

18.5 (±0.5)

-3.6

0.27

Black, non-Hispanic

10.9 (±0.8)

11.3 (±0.8)

9.4 (±0.7)

12.1 (±0.9)

12.3 (±0.9)

10.1 (±0.8)

-7.3

0.75

Hispanic

4.4 (±0.5)

4.8 (±0.5)

4.3 (±0.4)

4.5 (±0.5)

6.1 (±0.6)

4.0 (±0.4)

-9.1

0.68

Alaska Native

36.5 (±1.8)

39.7 (±1.9)

39.1 (±1.9)

37.3 (±1.9)

36.6 (±2.1)

36.3 (±2.0)

-0.5

0.50

American Indian

27.1 (±3.2)

22.7 (±2.9)

24.3 (±3.0)

21.5 (±3.0)

16.7 (±2.5)

20.6 (±2.7)

-24.0

0.03**

Asian/Pacific Islander

7.1 (±1.1)

7.4 (±1.0)

4.9 (±0.8)

4.7 (±0.8)

5.9 (±0.9)

5.4 (±0.8)

-23.9

0.09

Maternal age group (yrs)


<20

21.1 (±1.1)

22.0 (±1.1)

20.8 (±1.1)

21.5 (±1.3)

20.7 (±1.3)

18.9 (±1.2)

-10.4

0.17

20--24

21.4 (±0.9)

20.0 (±0.8)

20.1 (±0.8)

20.6 (±0.8)

21.8 (±0.9)

20.7 (±0.8)

-3.3

0.72

25--34

11.1 (±0.5)

11.8 (±0.5)

11.4 (±0.5)

10.5 (±0.5)

11.7 (±0.5)

10.5 (±0.4)

-5.4

0.25

≥35

13.2 (±1.1)

10.6 (±0.9)

11.6 (±0.9)

11.5 (±1.0)

9.4 (±0.9)

9.2 (±0.8)

-30.3

<0.01**

White, non-Hispanic


<20

34.0 (±1.9)

36.8 (±1.9)

34.7 (±1.9)

34.3 (±2.2)

36.4 (±2.3)

35.4 (±2.3)

+4.1

0.76

20--24

30.0 (±1.3)

26.2 (±1.2)

28.7 (±1.3)

30.4 (±1.3)

30.8 (±1.4)

32.8 (±1.3)

+9.3

0.01**

25--34

13.2 (±0.6)

14.6 (±0.7)

14.5 (±0.7)

12.1 (±0.6)

13.7 (±0.7)

12.4 (±0.6)

-6.1

0.08

≥35

15.3 (±1.4)

11.8 (±1.1)

13.5 (±1.2)

13.8 (±1.3)

10.2 (±1.1)

10.8 (±1.1)

-29.4

0.01**

Black, non-Hispanic


<20

7.8 (±1.4)

8.5 (±1.6)

8.9 (±1.8)

8.8 (±1.7)

10.8 (±2.1)

6.6 (±1.7)

-15.4

0.88

20--24

13.5 (±1.6)

14.6 (±1.7)

9.7 (±1.3)

13.4 (±1.6)

13.0 (±1.5)

9.2 (±1.3)

-31.9

0.07

25--34

8.9 (±1.2)

9.0 (±1.2)

7.8 (±1.1)

12.8 (±1.5)

13.3 (±1.5)

12.0 (±1.5)

+34.8

<0.01**

≥35

15.9 (±3.0)

15.8 (±3.0)

15.6 (±3.1)

10.7 (±2.7)

8.6 (±2.4)

12.0 (±2.8)

-24.5

0.07

Hispanic


<20

6.8 (±1.5)

6.6 (±1.1)

6.4 (±1.3)

9.5 (±2.0)

5.4 (±1.2)

4.4 (±1.1)

-35.3

0.24

20--24

4.9 (±0.8)

5.5 (±1.0)

5.2 (±1.0)

3.1 (±0.5)

7.6 (±1.2)

4.7 (±0.9)

-4.1

0.68

25--34

3.6 (±0.7)

3.9 (±0.7)

3.2 (±0.5)

4.0 (±0.8)

5.2 (±0.8)

3.6 (±0.6)

No change

0.40

≥35

2.6 (±0.9)

4.4 (±1.4)

4.2 (±1.5)

4.4 (±1.7)

7.0 (±2.4)

3.1 (±1.3)

+19.2

0.55

Alaska Native


<20

36.0 (±4.1)

48.7 (±4.4)

36.0 (±4.2)

43.9 (±4.4)

40.5 (±5.5)

45.3 (±5.8)

+25.8

0.48

20--24

44.8 (±3.3)

43.2 (±3.3)

44.7 (±3.6)

40.1 (±3.2)

36.4 (±3.7)

36.1 (±3.3)

-19.4 

0.02**

≥25††

31.5 (±2.4)

33.5 (±2.6)

37.2 (±2.6)

32.5 (±2.7)

35.4 (±2.9)

34.0 (±2.8)

+7.9

0.51

American Indian


<20

37.6 (±8.3)

19.9 (±5.6)

24.9 (±6.1)

32.9 (±7.4)

13.9 (±4.5)

15.9 (±6.0)

-57.7

0.04**

20--24

30.9 (±5.5)

25.3 (±5.4)

37.3 (±6.0)

20.6 (±5.1)

15.7 (±4.2)

17.0 (±3.9)

-45.0

0.01**

25--34

18.0 (±4.0)

22.8 (±4.7)

10.9 (±2.5)

18.9 (±4.6)

15.7 (±3.4)

25.3 (±4.7)

+40.6

0.50

≥35

27.1 (±11.1)

18.4 (±8.6)

21.6 (±9.1)

17.0 (±7.9)

32.6 (±13.9)

20.9 (±8.5)

-22.9

0.96

Asian/Pacific Islander


<20

12.2 (±2.3)

14.8 (±4.4)

14.6 (±4.4)

11.3 (±3.2)

18.2 (±4.6)

10.2 (±3.5)

-16.4

0.74

20--24

12.4 (±2.1)

15.7 (±4.3)

9.3 (±1.8)

8.1 (±1.3)

11.6 (±2.9)

8.7 (±1.6)

-29.8

0.13

25--34

6.1 (±1.6)

5.2 (±0.8)

3.1 (±1.2)

4.0 (±1.1)

4.7 (±1.1)

4.7 (±1.2)

-23.0

0.52

≥35

3.3 (±0.8)

3.7 (±0.8)

2.5 (±0.9)

1.9 (±0.7)

2.6 (±0.6)

3.1 (±1.0)

-6.1

0.54

* Smoking indicated on the PRAMS survey or birth certificate (combined estimate). Data aggregated for 16 PRAMS sites (Alaska, Arkansas, Colorado, Florida, Hawaii, Illinois, Maine, Nebraska, New Mexico, New York [excluding New York City], North Carolina, Oklahoma, South Carolina, Utah, Washington, West Virginia) with data available for all years.

Standard error.

§ Proportion change calculated using first and last years of data available by site.

Linear trends were assessed using logistic regression model.

** Significant linear trend was p≤0.05.

†† For Alaska Natives, age categories aged 25--34 years and ≥35 years were collapsed because of small sample sizes.


TABLE 6. Percentage of women who quit smoking during pregnancy,* by site and year --- Pregnancy Risk Assessment Monitoring System (PRAMS), United States, 31 sites, 2000--2005

Year

Site

2000

% (SE)

2001

% (SE)

2002

% (SE)

2003

% (SE)

2004

% (SE)

2005

% (SE)

Proportion change§

p value

16 PRAMS sites**

43.9 (±1.1)

45.5 (±1.1)

46.2 (±1.1)

47.5 (±1.2)

46.3 (±1.1)

45.7 (±1.1)

+4.1

0.17

Alabama

41.7 (±3.3)

41.4 (±3.1)

41.6 (±3.2)

44.2 (±3.5)

---††

---

+6.0

0.62

Alaska

45.7 (±2.7)

46.6 (±2.7)

46.1 (±2.5)

46.8 (±2.6)

44.5 (±2.9)

46.1 (±3.0)

+0.9

0.88

Arkansas

31.9 (±3.1)

37.4 (±2.7)

35.6 (±2.8)

40.3 (±2.8)

33.1 (±2.4)

36.1 (±2.4)

+13.2

0.68

Colorado

49.3 (±3.1)

47.6 (±3.1)

49.3 (±3.0)

46.0 (±3.2)

52.0 (±3.4)

50.1 (±3.6)

+1.6

0.58

Florida

47.8 (±4.3)

53.7 (±3.9)

49.8 (±4.0)

51.5 (±3.9)

54.7 (±3.6)

53.7 (±3.7)

+12.3

0.31

Georgia§§

---

---

---

---

46.1 (±4.3)

46.3 (±4.1)

+0.4

¶¶

Hawaii

59.3 (±2.4)

56.0 (±2.3)

59.1 (±3.0)

55.6 (±2.9)

61.3 (±2.5)

61.0 (±2.7)

+2.9

0.30

Illinois

40.3 (±2.7)

41.3 (±2.5)

47.4 (±2.7)

44.5 (±3.0)

45.8 (±2.6)

44.7 (±3.1)

+10.9

0.16

Louisiana

44.2 (±2.8)

46.2 (±2.8)

49.1 (±3.0)

39.7 (±2.9)

37.1 (±2.6)

---

-16.1

0.01***

Maine

43.9 (±3.1)

41.6 (±3.1)

46.6 (±3.3)

45.5 (±3.3)

35.1 (±2.9)

45.2 (±3.1)

+3.0

0.60

Maryland§§

---

53.8 (±4.9)

54.5 (±4.7)

45.5 (±4.5)

49.5 (±4.5)

44.3 (±5.1)

-17.7

0.13

Michigan

---

33.1 (±3.4)

39.9 (±2.7)

44.2 (±2.8)

39.9 (±2.9)

44.9 (±2.9)

+35.6

0.04***

Minnesota§§

---

---

45.3 (±3.6)

39.9 (±3.2)

42.7 (±3.2)

42.9 (±3.1)

-5.3

0.88

Mississippi

---

---

---

39.0 (±3.6)

35.3 (±3.5)

---

-6.9

¶¶

Montana

---

---

48.1 (±3.0)

---

---

---

***

¶¶

Nebraska

43.6 (±2.9)

46.5 (±2.4)

47.7 (±2.9)

50.8 (±2.9)

38.5 (±2.8)

40.7 (±2.8)

-6.7

0.11

New Jersey§§

---

---

47.9 (±4.2)

51.3 (±2.7)

53.0 (±2.5)

58.5 (±2.5)

+22.1

0.02***

New Mexico§§

58.6 (±2.8)

55.3 (±3.0)

58.3 (±3.0)

56.8 (±3.3)

52.1 (±3.1)

53.6 (±3.7)

-8.5

0.17

New York§§§

37.3 (±3.5)

43.4 (±3.6)

38.4 (±3.7)

44.7 (±3.7)

45.2 (±3.7)

44.5 (±3.9)

+19.3

0.11

New York City§§

---

---

---

---

46.2 (±6.0)

60.9 (±5.6)

+31.8

¶¶

North Carolina§§

44.5 (±3.2)

43.4 (±3.5)

50.5 (±3.4)

45.4 (±3.5)

45.1 (±3.1)

42.4 (±4.2)

-4.7

0.83

North Dakota

---

---

43.1 (±3.2)

---

---

---

***

¶¶

Ohio

39.7 (±3.2)

36.9 (±3.2)

34.8 (±3.4)

41.0 (±3.3)

---

33.3 (±3.2)

-16.1

0.31

Oklahoma

46.4 (±3.6)

37.6 (±3.3)

38.2 (±3.3)

44.7 (±3.5)

39.2 (±3.4)

38.0 (±3.1)

-18.1

0.28

Oregon

---

---

---

43.5 (±4.9)

42.6 (±4.2)

37.3 (±4.0)

-14.3

0.32

Rhode Island

---

---

38.0 (±3.5)

51.9 (±3.5)

49.0 (±3.4)

46.7 (±3.4)

+22.9

0.15

South Carolina

45.6 (±4.2)

43.3 (±4.4)

44.8 (±4.9)

49.6 (±4.6)

42.7 (±4.3)

42.8 (±4.2)

-6.1

0.72

Utah

49.8 (±4.7)

45.6 (±3.8)

49.7 (±4.8)

65.8 (±4.5)

47.0 (±3.3)

51.3 (±3.6)

+3.0

0.41

Vermont§§

---

42.9 (±2.4)

37.5 (±2.7)

39.1 (±2.8)

39.9 (±2.9)

39.2 (±3.0)

-8.6

0.48

Washington

49.7 (±4.2)

54.8 (±4.4)

49.7 (±4.4)

54.1 (±4.2)

47.9 (±4.3)

50.5 (±4.5)

+1.6

0.75

West Virginia§§

32.7 (±2.6)

32.8 (±2.6)

32.8 (±2.6)

30.2 (±2.6)

28.1 (±3.5)

30.2 (±2.4)

-7.6

0.24

* Quit smoking = no smoking during the last 3 months of pregnancy among women who smoked 3 months before pregnancy on the basis of the PRAMS survey.

Standard error.

§ Proportion change calculated using first and last years of data available.

Linear trends were assessed using logistic regression model for sites with at least 3 years of data.

** Data aggregated for 16 PRAMS sites (Alaska, Arkansas, Colorado, Florida, Hawaii, Illinois, Maine, Nebraska, New Mexico, New York [excluding New York City], North Carolina, Oklahoma, South Carolina, Utah, Washington, and West Virginia) with data available for all years.

†† Data not available.

§§ Sites include partial year of births because of data availability for a given year.

¶¶ Insufficient data (i.e., <3 years) to assess linear trends.

*** Significant linear trend was p≤0.05.

††† Insufficient data to calculate change in proportions.

§§§ New York City births reported separately.


TABLE 7. Maternal characteristics among smokers who quit smoking during pregnancy and among smokers who did not quit smoking during pregnancy --- Pregnancy Risk Assessment Monitoring System (PRAMS), United States, 26 sites,* 2005

Maternal characteristics

Quit smoking

Unweighted n = 4,185

% (SE)

Did not quit smoking

Unweighted n = 6,066

% (SE)

p value§

Maternal age (yrs)

<20

12.2 (±0.9)

13.7 (±0.8)

0.1082

20--24

34.8 (±1.3)

36.7 (±1.2)

25--34

45.0 (±1.3)

40.8 (±1.2)

≥35

8.0 (±0.7)

8.8 (±0.6)

Maternal race and ethnicity

White, non-Hispanic

74.2 (±1.1)

79.8 (±0.9)

<0.0001

Black, non-Hispanic

9.6 (±0.8)

10.5 (±0.7)

Hispanic

11.1 (±0.9)

5.6 (±0.5)

Alaska Native

0.2 (±0.02)

0.3 (±0.02)

American Indian

1.4 (±0.2)

1.6 (±0.2)

Asian/Pacific Islander

2.2 (±0.3)

1.2 (±0.2)

Other

1.3 (±0.3)

1.0 (±0.2)

Maternal education (yrs)

<12

16.0 (±1.0)

31.8 (±1.1)

<0.0001

12

37.2 (±1.3)

43.6 (±1.2)

>12

46.8 (±1.3)

24.6 (±1.0)

Marital status

Not married

49.0 (±1.3)

61.6 (±1.1)

<0.0001

Married

51.0 (±1.3)

38.4 (±1.1)

Annual income

<$15,000

33.0 (±1.3)

52.2 (±1.2)

<0.0001

≥$15,000

67.0 (±1.3)

47.8 (±1.2)

Prepregnancy body mass index

Underweight (<18.5)

5.4 (±0.6)

8.3 (±0.7)

Normal (18.5--24.9)

53.5 (±1.3)

49.3 (±1.2)

0.0002

Overweight (25.0--29.9)

22.4 (±1.1)

19.8 (±0.9)

Obese (≥30)

18.7 (±1.0)

22.6 (±1.0)

Pregnancy intention

Intended

48.6 (±1.3)

41.4 (±1.2)

<0.0001

Unintended

51.4 (±1.3)

58.6 (±1.2)

Parity

First birth

56.5 (±1.3)

36.8 (±1.1)

<0.0001

Second or later birth

43.5 (±1.3)

63.2 (±1.1)

Initiation of prenatal care (PNC)

1st trimester

82.5 (±1.0)

78.2 (±1.0)

0.0038

2nd trimester

14.3 (±0.9)

17.0 (±0.9)

3rd trimester or no PNC

3.1 (±0.5)

4.8 (±0.5)

Health insurance coverage during PNC

Medicaid

44.7 (±1.3)

62.7 (±1.2)

<0.0001

Other insurance

48.6 (±1.3)

30.2 (±1.1)

Uninsured

6.8 (±0.7)

7.1 (±0.6)

WICenrollment during pregnancy

Yes

50.2 (±1.3)

64.5 (±1.1)

<0.0001

No

49.8 (±1.3)

35.5 (±1.1)

Alcohol use during pregnancy

Yes

5.9 (±0.6)

8.4 (±0.7)

0.0052

No

94.1 (±0.6)

91.6 (±0.7)

No. of cigarettes smoked per day before pregnancy

≤10

70.8 (±1.2)

42.2 (±1.2)

<0.0001

11--20

22.4 (±1.1)

42.0 (±1.2)

>20

6.8 (±0.7)

15.9 (±0.9)


Total

44.8 (±0.9)

55.2 (±0.9)


* Quitting smoking or not quitting smoking during pregnancy was assessed among women who smoked 3 months before pregnancy on the basis of the PRAMS survey. Data aggregated for 26 sites (Alaska, Arkansas, Colorado, Florida, Georgia, Hawaii, Illinois, Maine, Maryland, Michigan, Minnesota, Nebraska, New Jersey, New Mexico, New York, New York City, North Carolina, Ohio, Oklahoma, Oregon, Rhode Island, South Carolina, Utah, Vermont, Washington, and West Virginia) with data available for 2005.

Standard error.

§ Chi-square significance test.

Special Supplemental Nutrition Program for Women, Infants, and Children.


TABLE 8. Prevalence of smoking after delivery,* by site and year --- Pregnancy Risk Assessment Monitoring System (PRAMS), United States, 31 sites, 2000--2005

Year

Site

2000

% (SE)

2001

% (SE)

2002

% (SE)

2003

% (SE)

2004

% (SE)

2005

% (SE)

Proportion change§

p value

16 PRAMS sites**

18.1 (±0.4)

17.9 (±0.4)

17.2 (±0.4)

18.1 (±0.4)

18.3 (±0.4)

16.4 (±0.4)

-9.4

0.04¶¶

Alabama

19.5 (±1.3)

22.4 (±1.3)

19.7 (±1.2)

17.8 (±1.2)

---††

---

-8.7

0.18

Alaska

24.4 (±1.2)

20.4 (±1.1)

24.3 (±1.2)

22.1 (±1.1)

23.6 (±1.4)

20.7 (±1.3)

-15.2

0.29

Arkansas

25.0 (±1.6)

25.9 (±1.3)

25.3 (±1.3)

26.1 (±1.4)

28.6 (±1.3)

27.5 (±1.3)

+10.0

0.07

Colorado

15.0 (±1.0)

15.9 (±1.0)

14.0 (±0.9)

14.0 (±1.0)

15.3 (±1.1)

14.8 (±1.2)

-1.3

0.75

Florida

14.8 (±1.2)

14.7 (±1.2)

14.3 (±1.2)

16.7 (±1.3)

16.1 (±1.2)

12.8 (±1.0)

-13.5

0.69

Georgia§§

---

---

---

---

14.8 (±1.3)

15.4 (±1.3)

+4.1

0.75

Hawaii

13.7 (±0.7)

15.0 (±0.8)

13.0 (±0.9)

14.8 (±0.9)

13.1 (±0.8)

14.1 (±0.9)

+2.9

0.79

Illinois

16.6 (±0.9)

17.2 (±0.9)

16.8 (±0.9)

17.8 (±1.0)

17.1 (±0.9)

14.7 (±0.9)

-11.4

0.27

Louisiana

18.7 (±1.0)

20.5 (±1.1)

19.2 (±1.1)

21.9 (±1.2)

23.4 (±1.2)

---

+25.1

<0.01¶¶

Maine

23.8 (±1.5)

22.7 (±1.4)

21.6 (±1.4)

20.8 (±1.4)

24.5 (±1.5)

23.4 (±1.5)

-1.7

0.86

Maryland§§

---

14.6 (±1.4)

12.8 (±1.4)

16.4 (±1.5)

16.3 (±1.5)

13.7 (±1.5)

-6.2

0.64

Michigan

---

24.3 (±1.7)

23.4 (±1.3)

22.7 (±1.2)

25.6 (±1.4)

22.4 (±1.3)

-7.8

0.78

Minnesota§§

---

---

19.9 (±1.5)

19.4 (±1.3)

21.4 (±1.4)

21.3 (±1.4)

+7.0

0.30

Mississippi

---

---

---

20.0 (±1.3)

17.7 (±1.3)

---

-11.5

***

Montana

---

---

20.8 (±1.3)

---

---

---

†††

***

Nebraska

19.4 (±1.1)

21.4 (±1.0)

19.9 (±1.2)

18.8 (±1.1)

20.8 (±1.2)

20.1 (±1.1)

+3.6

0.96

New Jersey§§

---

---

13.1 (±1.1)

12.2 (±0.7)

12.0 (±0.6)

11.5 (±0.6)

-12.2

0.18

New Mexico§§

16.0 (±1.0)

16.2 (±1.1)

13.6 (±0.9)

12.5 (±0.9)

14.5 (±1.0)

13.1 (±1.1)

-18.1

0.01¶¶

New York§§§

22.4 (±1.6)

20.6 (±1.5)

19.3 (±1.5)

19.2 (±1.5)

21.6 (±1.7)

17.5 (±1.4)

-21.9

0.09

New York City§§

---

---

---

---

11.7 (±1.5)

8.8 (±1.1)

-24.8

***

North Carolina§§

20.1 (±1.2)

17.6 (±1.2)

17.8 (±1.2)

20.5 (±1.3)

20.7 (±1.3)

16.9 (±1.5)

-15.9

0.96

North Dakota

---

---

21.8 (±1.3)

---

---

---

†††

***

Ohio

24.2 (±1.5)

23.8 (±1.4)

22.6 (±1.5)

28.0 (±1.7)

---

27.4 (±1.7)

+13.2

0.04¶¶

Oklahoma

25.8 (±1.7)

27.2 (±1.7)

27.0 (±1.6)

24.7 (±1.6)

26.3 (±1.7)

26.3 (±1.6)

+1.9

0.85

Oregon

---

---

---

15.5 (±1.6)

17.8 (±1.5)

15.9 (±1.4)

+2.6

0.87

Rhode Island

---

---

17.0 (±1.2)

15.1 (±1.1)

16.6 (±1.2)

15.8 (±1.2)

-7.1

0.69

South Carolina

18.6 (±1.5)

20.3 (±1.6)

17.8 (±1.7)

20.1 (±1.7)

19.2 (±1.7)

21.5 (±1.7)

+15.6

0.32

Utah

9.5 (±1.0)

10.1 (±0.8)

9.0 (±1.0)

7.6 (±0.9)

8.7 (±0.6)

7.3 (±0.6)

-23.2

0.01¶¶

Vermont§§

---

22.2 (±1.1)

21.5 (±1.2)

17.6 (±1.1)

22.8 (±1.3)

21.0 (±1.3)

-5.4

0.68

Washington

16.0 (±1.4)

14.9 (±1.4)

15.7 (±1.5)

15.5 (±1.4)

14.6 (±1.3)

13.0 (±1.3)

-18.8

0.13

West Virginia§§

31.6 (±1.6)

34.3 (±1.7)

33.7 (±1.6)

33.6 (±1.6)

33.5 (±2.3)

39.3 (±1.7)

+24.4

0.01¶¶

* Smoking after delivery = smoking approximately 4 months after delivery on the basis of the PRAMS survey. Average = 117.9 days; range = 61--270 days.

Standard error.

§ Proportion change calculated using first and last years of data available.

Linear trends were assessed using logistic regression model for sites with at least 3 years of data.

** Data aggregated for 16 PRAMS sites (Alaska, Arkansas, Colorado, Florida, Hawaii, Illinois, Maine, Nebraska, New Mexico, New York [excluding New York City], North Carolina, Oklahoma, South Carolina, Utah, Washington, and West Virginia) with data available for all years.

†† Data not available.

§§ Sites include partial year of births because of data availability for a given year.

¶¶ Significant linear trend was p≤0.05.

*** Insufficient data (i.e., <3 years) to assess linear trends.

††† Insufficient data (i.e., <2 years) to calculate change in proportions.

§§§ New York City births reported separately.


TABLE 9. Percentage of women who relapsed to smoking* after delivery, by site and year --- Pregnancy Risk Assessment Monitoring System (PRAMS), United States, 31 sites, 2000--2005

Year

Site

2000

% (SE)

2001

% (SE)

2002

% (SE)

2003

% (SE)

2004

% (SE)

2005

% (SE)

Proportion change§

p value

16 PRAMS sites**

50.3 (±1.7)

49.2 (±1.7)

46.1 (±1.7)

51.6 (±1.8)

51.8 (±1.7)

51.4 (±1.7)

+2.2

0.18

Alabama

54.0 (±5.4)

54.9 (±4.9)

52.1 (±5.1)

42.4 (±5.5)

---††

---

-21.5

0.12

Alaska

52.0 (±4.1)

42.4 (±4.0)

47.3 (±3.7)

41.8 (±3.8)

47.6 (±4.5)

44.8 (±4.5)

-13.8

0.46

Arkansas

43.1 (±5.8)

43.0 (±4.6)

45.3 (±5.0)

56.6 (±4.6)

50.4 (±4.4)

62.0 (±4.0)

+43.9

<0.01§§

Colorado

45.5 (±4.5)

45.6 (±4.5)

39.3 (±4.4)

43.1 (±4.7)

45.2 (±4.9)

48.8 (±5.2)

+7.3

0.60

Florida

59.1 (±6.3)

45.8 (±5.5)

43.3 (±5.6)

54.4 (±5.6)

53.8 (±4.9)

55.0 (±5.0)

-6.9

0.56

Georgia¶¶

---

---

---

---

52.3 (±6.4)

59.5 (±6.1)

+13.8

***

Hawaii

46.6 (±3.2)

46.6 (±3.2)

42.4 (±4.0)

47.7 (±4.0)

44.6 (±3.2)

43.3 (±3.4)

-7.1

0.54

Illinois

45.8 (±4.3)

51.1 (±4.0)

50.1 (±3.9)

53.5 (±4.5)

49.8 (±3.9)

50.0 (±4.6)

+9.2

0.58

Louisiana

65.9 (±4.0)

63.3 (±3.9)

62.3 (±4.2)

68.4 (±4.2)

57.3 (±4.4)

---

-13.1

0.33

Maine

42.2 (±4.7)

41.2 (±4.8)

39.8 (±4.6)

42.3 (±4.9)

42.9 (±5.1)

43.7 (±4.5)

+3.6

0.69

Maryland¶¶

---

46.4 (±6.7)

40.5 (±6.6)

54.5 (±6.7)

64.1 (±6.1)

49.0 (±7.7)

+5.6

0.11

Michigan

---

46.0 (±6.2)

51.4 (±4.4)

59.6 (±4.2)

55.6 (±4.6)

54.6 (±4.4)

+18.7

0.34

Minnesota¶¶

---

---

40.1 (±5.3)

43.7 (±5.1)

48.8 (±4.9)

54.5 (±4.8)

+35.9

0.03§§

Mississippi

---

---

---

63.6 (±5.7)

57.6 (±6.0)

---

-9.4

***

Montana

---

---

36.9 (±4.1)

---

---

---

†††

***

Nebraska

48.0 (±4.4)

50.0 (±3.6)

41.9 (±4.1)

46.3 (±4.0)

59.5 (±4.5)

52.0 (±4.4)

+8.3

0.15

New Jersey¶¶

---

---

43.9 (±6.8)

50.8 (±4.4)

45.2 (±3.9)

53.0 (±4.0)

+20.7

0.38

New Mexico¶¶

54.8 (±3.9)

40.4 (±3.9)

43.8 (±4.0)

42.7 (±4.2)

46.5 (±4.2)

51.7 (±5.2)

-5.7

0.79

New York§§§

56.1 (±5.9)

49.7 (±5.6)

52.5 (±6.1)

40.9 (±5.5)

54.1 (±5.3)

50.8 (±5.9)

-9.4

0.65

New York City¶¶

---

---

---

---

72.8 (±7.8)

54.9 (±7.3)

-24.6

***

North Carolina¶¶

47.8 (±4.8)

51.9 (±5.3)

47.9 (±4.8)

60.5 (±5.2)

50.9 (±4.7)

44.3 (±6.4)

-7.3

0.88

North Dakota

---

---

50.8 (±4.9)

---

---

---

†††

***

Ohio

52.3 (±5.2)

61.2 (±5.5)

46.8 (±5.9)

62.5 (±5.1)

---

61.5 (±5.6)

+17.6

0.23

Oklahoma

60.2 (±5.1)

57.8 (±5.3)

56.9 (±5.4)

59.7 (±5.2)

64.3 (±5.3)

54.8 (±5.1)

-9.0

0.90

Oregon

---

---

---

42.7 (±7.3)

39.2 (±6.2)

36.4 (±6.4)

-14.8

0.51

Rhode Island

---

---

34.7 (±5.4)

38.4 (±4.8)

47.8 (±5.0)

46.1 (±5.1)

+32.9

0.06

South Carolina

50.0 (±6.4)

70.2 (±6.1)

40.1 (±7.1)

61.5 (±6.3)

55.3 (±6.5)

60.8 (±6.2)

+21.6

0.54

Utah

38.9 (±6.4)

39.5 (±5.6)

35.6 (±6.5)

52.0 (±6.3)

45.9 (±4.8)

41.4 (±5.2)

+6.4

0.28

Vermont¶¶

---

34.7 (±3.6)

37.2 (±4.5)

33.9 (±4.3)

47.4 (±4.6)

44.0 (±4.8)

+26.8

0.03§§

Washington

41.6 (±5.8)

46.2 (±5.9)

38.9 (±5.9)

46.3 (±5.9)

48.4 (±6.1)

43.9 (±6.1)

+5.5

0.61

West Virginia¶¶

51.0 (±4.9)

53.5 (±4.9)

65.4 (±4.6)

52.1 (±5.1)

46.2 (±7.2)

58.9 (±4.7)

+15.5

0.60

* Relapsed to smoking = smoking approximately 4 months after delivery among women who quit smoking during the last 3 months of pregnancy on the basis of the PRAMS survey. Quit smoking = no smoking during the last 3 months of pregnancy among women who smoked 3 months before pregnancy on the basis of the PRAMS survey. Average = 117.9 days; range = 61--270 days.

Standard error.

§ Proportion change calculated using first and last years of data available by site.

Linear trends were assessed using logistic regression model for sites with at least 3 years of data.

** Data aggregated for 16 PRAMS sites (Alaska, Arkansas, Colorado, Florida, Hawaii, Illinois, Maine, Nebraska, New Mexico, New York [excluding New York City], North Carolina, Oklahoma, South Carolina, Utah, Washington, and West Virginia) with data available for all years.

†† Data not available.

§§ Significant linear trend was p≤0.05.

¶¶ Sites include partial year of births because of data availability for a given year.

*** Insufficient data to assess linear trends.

††† Insufficient data to calculate change in proportions.

§§§ New York City births reported separately.


TABLE 10. Maternal characteristics among women who relapsed to smoking or did not relapse to smoking after delivery* --- Pregnancy Risk Assessment Monitoring System (PRAMS), United States, 26 sites, 2005

Maternal characteristics

Relapsed to smoking after delivery

Unweighted n = 2,216

% (SE§)

Did not relapse to smoking after delivery

Unweighted n = 1,959

% (SE)

p value

Maternal age (yrs)

<20

15.2 (±1.3)

8.8 (±1.2)

<0.0001

20--24

40.0 (±1.8)

29.1 (±1.7)

25--34

38.7 (±1.7)

52.1 (±1.9)

≥35

6.1 (±0.8)

10.0 (±1.2)

Maternal race and ethnicity

White, non-Hispanic

70.1 (±1.6)

78.8 (±1.6)

<0.0001

Black, non-Hispanic

13.3 (±1.2)

5.5 (±0.9)

Hispanic

10.9 (±1.1)

11.3 (±1.3)

Alaska Native

0.2 (±0.03)

0.3 (±0.04)

American Indian

1.5 (±0.2)

1.2 (±0.2)

Asian/Pacific Islander

2.3 (±0.4)

2.0 (±0.4)

Other

1.7 (±0.5)

0.9 (±0.4)

Maternal education (yrs)

<12

20.0 (±1.5)

11.6 (±1.3)

<0.0001

12

37.9 (±1.8)

36.5 (±1.9)

>12

42.2 (±1.8)

51.9 (±1.9)

Marital status

Not married

55.1 (±1.8)

42.1 (±1.9)

<0.0001

Married

44.9 (±1.8)

57.9 (±1.9)

Annual income

<$15,000

37.5 (±1.8)

28.0 (±1.8)

0.0002

≥$15,000

62.5 (±1.8)

72.0 (±1.8)

Prepregnancy body mass index

Underweight (<18.5)

5.0 (±0.8)

6.0 (±1.0)

0.6160

Normal (18.5--24.9)

52.9 (±1.8)

54.1 (±1.9)

Overweight (25--29.9)

23.6 (±1.5)

21.1 (±1.5)

Obese (≥30)

18.6 (±1.4)

18.8 (±1.5)

Pregnancy intention

Intended

45.4 (±1.8)

52.2 (±1.9)

0.0094

Unintended

54.6 (±1.8)

47.8 (±1.9)

Parity

First birth

54.3 (±1.8)

58.9 (±1.9)

0.0775

Second or later birth

45.7 (±1.8)

41.1 (±1.9)

Initiation of prenatal care (PNC)

1st trimester

79.5 (±1.5)

85.9 (±1.3)

0.0045

2nd trimester

17.1 (±1.4)

11.3 (±1.2)

3rd trimester or no PNC

3.4 (±0.7)

2.7 (±0.7)

Health insurance coverage during PNC

Medicaid

50.0 (±1.8)

38.7 (±1.9)

0.0001

Other insurance

43.2 (±1.8)

54.6 (±1.9)

Uninsured

6.8 (±0.9)

6.7 (±1.0)

WIC** enrollment during pregnancy

Yes

56.7 (±1.8)

42.9 (±1.9)

<0.0001

No

43.3 (±1.8)

57.1 (±1.9)

Alcohol use during pregnancy

Yes

4.9 (±0.7)

7.0 (±1.0)

No

95.1 (±0.7)

93.0 (±1.0)

0.0851

No. of cigarettes smoked per day before pregnancy

≤10

70.2 (±1.7)

71.5 (±1.7)

0.8596

11--20

22.9 (±1.5)

21.8 (±1.6)

>20

6.9 (±1.0)

6.7 (±0.9)


Total

53.0 (±1.3)

47.0 (±1.3)

* Relapsed to smoking = smoking approximately 4 months after delivery among women who quit smoking during the last 3 months of pregnancy on the basis of the PRAMS survey. Quit smoking = no smoking during the last 3 months of pregnancy among women who smoked 3 months before pregnancy on the basis of the PRAMS survey. Average: 117.9 days; range: 61--270 days.

Data aggregated for 26 PRAMS sites (Alaska, Arkansas, Colorado, Florida, Georgia, Hawaii, Illinois, Maine, Maryland, Michigan, Minnesota, Nebraska, New Jersey, New Mexico, New York, New York City, North Carolina, Ohio, Oklahoma, Oregon, Rhode Island, South Carolina, Utah, Vermont, Washington, and West Virginia) with data available for 2005.

§ Standard error.

Chi-square significance test.

** Special Supplemental Nutrition Program for Women, Infants, and Children.

The Pregnancy Risk Assessment Monitoring System (PRAMS) Working Group

Membership as of September 2008

Albert Woolbright, PhD, Alabama; Kathy Perham-Hester, MS, MPH, Alaska; Mary McGehee, PhD, Arkansas; Alyson Shupe, PhD, Colorado; Charlon Kroelinger, PhD, Delaware; Jamie Fairclough, MPH, Florida; Carol Hoban, MS, MPH, Georgia; Mark Eshima, MA, Hawaii; Theresa Sandidge, MA, Illinois Joan Wightkin, Louisiana; Kim Haggan, Maine; Diana Cheng, MD, Maryland; Hafsatou Diop, MD, Massachusetts; Violanda Grigorescu, MD, Michigan; Jan Jernell, Minnesota; Marilyn Jones, Mississippi; Venkata Garikapaty, PhD, Missouri; JoAnn Dotson, Montana; Brenda Coufal, Nebraska; Lakota Kruse, MD, New Jersey; Eirian Coronado, New Mexico; Anne Radigan-Garcia, New York State; Candace Mulready-Ward, MPH, New York City; Paul Buescher, PhD, North Carolina; Sandra Anseth, North Dakota; Connie Geidenberger, Ohio; Alicia Lincoln, Oklahoma; Kenneth Rosenberg, MD, Oregon; Kenneth Huling, Pennsylvania; Sam Viner-Brown, PhD, Rhode Island; Mike Smith, South Carolina; Christine Rinki, MPH, South Dakota; Eric Miller, PhD, Texas; David Law, PhD, Tennessee; Laurie Baksh, Utah; Peggy Brozicevic, Vermont; Marilyn Wenner, Virginia; Linda Lohdefinck, Washington; Melissa Baker, MA, West Virginia; Katherine Kvale, PhD, Wisconsin; Angi Crotsenberg; Wyoming; CDC PRAMS Team, Applied Sciences Branch, Division of Reproductive Health, National Center for Chronic Disease Prevention and Health Promotion, CDC.

Use of trade names and commercial sources is for identification only and does not imply endorsement by the U.S. Department of Health and Human Services.


References to non-CDC sites on the Internet are provided as a service to MMWR readers and do not constitute or imply endorsement of these organizations or their programs by CDC or the U.S. Department of Health and Human Services. CDC is not responsible for the content of pages found at these sites. URL addresses listed in MMWR were current as of the date of publication.

All MMWR HTML versions of articles are electronic conversions from typeset documents. This conversion might result in character translation or format errors in the HTML version. Users are referred to the electronic PDF version (http://www.cdc.gov/mmwr) and/or the original MMWR paper copy for printable versions of official text, figures, and tables. An original paper copy of this issue can be obtained from the Superintendent of Documents, U.S. Government Printing Office (GPO), Washington, DC 20402-9371; telephone: (202) 512-1800. Contact GPO for current prices.

**Questions or messages regarding errors in formatting should be addressed to mmwrq@cdc.gov.

Date last reviewed: 5/19/2009

HOME  |  ABOUT MMWR  |  MMWR SEARCH  |  DOWNLOADS  |  RSSCONTACT
POLICY  |  DISCLAIMER  |  ACCESSIBILITY

Safer, Healthier People

Morbidity and Mortality Weekly Report
Centers for Disease Control and Prevention
1600 Clifton Rd, MailStop E-90, Atlanta, GA 30333, U.S.A

USA.GovDHHS

Department of Health
and Human Services