 |
|
|
|
|
|
|
| ||||||||||
|
|
|
|
|
|
|
||||
| ||||||||||
|
|
|
|
|
Persons using assistive technology might not be able to fully access information in this file. For assistance, please send e-mail to: mmwrq@cdc.gov. Type 508 Accommodation and the title of the report in the subject line of e-mail. Abortion Surveillance --- United States, 2001Lilo T. Strauss, M.A., Joy Herndon, M.S., Jeani Chang, M.P.H., Wilda Y. Parker Corresponding address: CDC/National Center for Chronic Disease Prevention and Health Promotion/Division of Reproductive Health, 1600 Clifton Rd., NE, MS K-21, Atlanta, GA 30333; E-mail: cdcinfo@cdc.gov. Abstract Problem/Condition: CDC began abortion surveillance in 1969 to document the number and characteristics of women obtaining legal induced abortions. Reporting Period Covered: This report summarizes and describes data voluntarily reported to CDC regarding legal induced abortions obtained in the United States in 2001. Description of System: For each year since 1969, CDC has compiled abortion data by state or area of occurrence. During 1973--1997, data were received from or estimated for 52 reporting areas in the United States: 50 states, the District of Columbia, and New York City. In 1998 and 1999, CDC compiled abortion data from 48 reporting areas. Alaska, California, New Hampshire, and Oklahoma did not report, and data for these states were not estimated. In 2000 and 2001, Oklahoma again reported these data, increasing the number of reporting areas to 49. Results: A total of 853,485 legal induced abortions were reported to CDC for 2001 from 49 reporting areas, representing a 0.5% decrease from the 857,475 legal induced abortions reported by the same 49 reporting areas for 2000. The abortion ratio, defined as the number of abortions per 1,000 live births, was 246 in 2001, compared with 245 reported for 2000. This represents a 0.4% increase in the abortion ratio. The abortion rate was 16 per 1,000 women aged 15--44 years for 2001, the same as for 2000. For both the 48 and 49 reporting areas, the abortion rate remained relatively constant during 1997--2001. The highest percentages of reported abortions were for women who were unmarried (82%), white (55%) and aged <25 years (52%). Of all abortions for which gestational age was reported, 59% were performed at <8 weeks' gestation and 88% at <13 weeks. From 1992 (when detailed data regarding early abortions were first collected) through 2001, steady increases have occurred in the percentage of abortions performed at <6 weeks' gestation. A limited number of abortions were obtained at >15 weeks' gestation, including 4.3% at 16--20 weeks and 1.4% at >21 weeks. A total of 35 reporting areas submitted data stating that they performed medical (nonsurgical) procedures, making up 2.9% of all reported procedures from the 45 areas with adequate reporting on type of procedure. In 2000 (the most recent year for which data are available), 11 women died as a result of complications from known legal induced abortion. No deaths were associated with known illegal abortion. Interpretation: During 1990--1997, the number of legal induced abortions gradually declined. When the same 48 reporting areas are compared, the number of abortions decreased during 1996--2001. In 2000 and 2001, even with one additional reporting state, the number of abortions declined slightly. In 2000, as in previous years, deaths related to legal induced abortions occurred rarely (less than one death per 100,000 abortions). Public Health Action: Abortion surveillance in the United States continues to provide the data necessary for examining trends in numbers and characteristics of women who obtain legal induced abortions and to increase understanding of this pregnancy outcome. Policymakers and program planners use these data to improve the health and well-being of women and infants. IntroductionCDC began conducting abortion surveillance in 1969 to document the number and characteristics of women obtaining legal induced abortions and to monitor this outcome of unintended pregnancies. This report is based on abortion data for 2001 provided voluntarily to CDC's National Center for Chronic Disease Prevention and Health Promotion (NCCDPHP), Division of Reproductive Health. MethodsFor 2001, CDC compiled data that were voluntarily provided from 49 reporting areas in the United States: 47 states (excluding Alaska, California, and New Hampshire), the District of Columbia (DC), and New York City (NYC). Legal induced abortion was defined as a procedure, performed by a licensed physician or someone acting under the supervision of a licensed physician, that was intended to terminate a suspected or known intrauterine pregnancy and to produce a nonviable fetus at any gestational age (1,2). The total number of legal induced abortions was available from all reporting areas; however, not all these areas collected data on some or all characteristics of women who obtained abortions, and the availability of such data varied by reporting area. Data on the age of women who obtained abortions were collected and reported adequately (i.e., categorized in accordance with surveillance variables and with <15% unknown values) in 48 reporting areas (46 states, DC, and NYC), representing 90% of all reported procedures, whereas data on ethnicity were collected and reported adequately in only 32 reporting areas, representing 59% of all reported procedures. The findings in this report reflect characteristics of women only from reporting areas that submitted adequate data for the characteristics being examined. For the majority of state tables, the percentage data include a category for unknown values, and the percentage known to be in each category is actually a slight understatement of the true percentage in that category. However, for trend data, out-of-area residents, adolescent ages, and two-characteristics tables, percentages presented are based on known values only. For the 49 reporting areas, data concerning the number of women obtaining legal induced abortions were provided by the central health agency.* These agencies provided data on numbers of abortions and characteristics of women obtaining abortions by the reporting area in which the abortion was performed (i.e., state of occurrence). For the majority of reporting areas, abortion totals were also available by the woman's state or area of residence. However, three states (Delaware, Maryland, and Wisconsin) reported characteristics only for residents who obtained abortions in the state but not for women from out of state; and one state (Iowa) provided numbers and characteristics only for state residents. Two states (Florida and Louisiana) did not report abortion totals by resident status, and two states (Arizona and Massachusetts) provided only the total number of abortions for out-of-state residents without specifying individual states or areas of residence. This report provides overall and state-specific abortion statistics. For all characteristics for which birth or population data were available, abortion ratios (number of abortions per 1,000 live births) or abortion rates (number of abortions per 1,000 women in a given age group) are provided. Beginning with 1996 data, abortion ratios were calculated by using the number of live births to residents of each area from birth data reported to CDC's National Center for Health Statistics (NCHS); these numbers were previously received from state health departments. The population data used for calculating abortion rates were previously obtained from the U.S. Census Bureau postcensual data. However, because of the impact of new guidelines from the Office of Management and Budget (OMB) in 1997 that allowed for multiple race selections on the 2000 Census, NCHS bridged race and ethnicity data were used for calculating abortion rates. These estimates resulted from bridging the 31 (five single and 26 multiple) race categories used in Census 2000, as specified in the 1997 OMB standards for collecting data on race and ethnicity, to the four race categories (white, black or African-American, Asian or Pacific Islander, and American Indian or Alaska Native) specified under the 1977 standards; the single response that a person who selected more than one race in 2000 most likely would have reported under the 1977 OMB standards was selected (3). Women aged 20--44 years who obtained legal induced abortions were categorized by 5-year age groups, and adolescents aged 15--19 years were categorized by single year of age. Abortion numbers, ratios, and rates are presented by age group. Because 94% of abortions among adolescents aged <15 years occurred among those aged 13--14 years in 1988 (the latest year for which this information is known) (4), the population of adolescents aged 13--14 years was used as the denominator for calculating abortion rates for adolescents aged <15 years. Rates for women aged >40 years were based on the number of women aged 40--44 years. However, rates for all females who obtained abortions were based on the population of females aged 15--44 years. Race and ethnicity data were categorized in two different ways. First, as in previous years, race was categorized into three populations: white, black, and other (i.e. Asian or Pacific Islander and American Indian or Alaska Native), and ethnicity was categorized as either Hispanic or non-Hispanic. Race and ethnicity were provided as separate characteristics, and abortions were not cross-classified by race and ethnicity. Abortion numbers, ratios, and rates are presented by both race and ethnicity. Second, in an effort to adhere to the new pattern mandated by OMB for 2000 for reporting federal data on race and ethnicity, data were requested to be cross-classified by seven categories for race (white, black or African American, Asian, American Indian or Alaska Native, Native Hawaiian or other Pacific Islander, unknown race/no race stated, and two or more races) and three categories for ethnicity (Hispanic or Latina, non-Hispanic or Latina, and unknown). Abortion ratio and rate were to be presented by each race/ethnicity category, and a summary data set of the three ethnicity categories was to be generated. As described in the Results section, complete data that adhered to this approach were rarely available. Marital status was reported as either married (including women who either married or separated) or unmarried (including those who were never married, widowed, or divorced). Abortion numbers and ratios are presented by marital status. Gestational age (in weeks) at the time of abortion was categorized as <6, 7, 8 and <8, 9--10, 11--12, 13--15, 16--20, and >21. Weeks of gestation were estimated in 13 reporting areas as the time elapsed since the woman's most recent menstrual period. For 24 other states, gestational age was reported on the basis of the physician's estimate (data from the clinical examination, including ultrasound results). For the remaining five states, gestational age was derived from a combination of the physician's estimates and the time elapsed since the woman's most recent menstrual period. Of the 42 areas that reported adequate data on weeks of gestation at the time of abortion, 40 also reported abortions performed at <8 weeks' gestation separately for those performed at <6, 7, and 8 weeks' gestation. Abortion numbers are presented by gestational age. CDC has reported data on abortion-related deaths periodically since these deaths were first included in abortion surveillance reports for 1972 (5,6). An abortion-related death was defined as a death resulting from 1) a direct complication of an abortion, 2) an indirect complication caused by the chain of events initiated by an abortion, or 3) aggravation of a preexisting condition by the physiologic or psychologic effects of an abortion (1,2). Sources of data for abortion-related deaths included national and state vital records, maternal mortality review committees, surveys, private citizens, media reports, health-care providers, medical examiners' reports, and computerized searches of full-text print media databases. All deaths causally related to induced abortion are classified as induced abortion-related regardless of the duration of time between the abortion and the death. For each death possibly related to an induced abortion or an abortion of unknown type, clinical records and autopsy reports were requested and reviewed by two clinically experienced medical epidemiologists to determine the cause of death and evaluate whether the death was abortion related. Each abortion-related death was then categorized as legal induced, illegal induced, spontaneous (miscarriage), or of unknown cause (whether induced or spontaneous). This report provides data on abortion-related deaths during 1972--2000. Abortion mortality data are updated whenever additional information is supplied to CDC. The 2000 data have not been published previously and are the most recent data available. National case-fatality rates were calculated as the number of known legal induced abortion-related deaths per 100,000 reported legal induced abortions. Case fatality rates for 1972--1997 are provided in this report. Case fatality rates for 1998--2000 cannot be calculated because a substantial number of abortions occurred in the nonreporting states, and the total number of abortions (the denominator) is unknown. ResultsOverall, the annual number of legal induced abortions in the United States increased gradually from 1973 until it peaked in 1990, and it generally declined thereafter (Figure 1). In 2001, a total of 853,485 legal induced abortions were reported to CDC by 49 reporting areas. This represents a 0.5% decrease from 2000, for which the same 49 areas reported 857,475 legal induced abortions (Tables 1 and 2). The national legal induced abortion ratio increased from 196 per 1,000 live births in 1973 (the first year that 52 areas reported) to 358 per 1,000 in 1979 and remained nearly stable through 1981 (Figure 1) (Table 2). The ratio peaked at 364 per 1,000 in 1984 and since then has demonstrated a generally steady decline. In 2001, the abortion ratio was 246 per 1,000 in 49 reporting areas and 247 for the same 48 reporting areas for which data were available since 1998. This represents a 0.4% increase from 2000 (246 per 1,000) (Table 2) (6). The national legal induced abortion rate increased from 14 per 1,000 women aged 15--44 years in 1973 to 25 per 1,000 in 1980. The rate remained stable, at 23--24 per 1,000 during the 1980s and early 1990s and at 20--21 per 1,000 during 1994-- 1997. The abortion rate remained unchanged at 17 per 1,000 during 1997--1999 in the same 48 reporting areas. In 2001, the abortion rate remained unchanged from 2000 at 16 per 1,000, both overall and in the same 48 reporting areas as 1999. The numbers, ratios, and rates of reported legal induced abortions are presented by area of residence as well as by area of occurrence (Table 3). In 2001, the highest number of reported legal induced abortions occurred in NYC (91,792), Florida (85,589), and Texas (77,409); the fewest† occurred in Idaho (738), South Dakota (895), and North Dakota (1,216) (Table 3). The abortion ratios by state or area of occurrence ranged from 36 per 1,000 live births in Idaho to 767 per 1,000 in NYC. Among women aged 15--44 years, the rates by occurrence ranged from 3 per 1,000 women in Idaho to 37 per 1,000 in DC. These ratios and rates should be viewed with consideration of the sizable variation by state in the percentage of abortions obtained by out-of-state residents. In 2001, approximately 9% of reported abortions were obtained by out-of-state residents (range: from 0.3% [in Hawaii] to 56% [in DC]) (Table 3). Data by state of residence are incomplete because three states (Alaska, California, and New Hampshire) did not report any data on abortion, and six states (Arizona, Florida, Iowa, Louisiana, Massachusetts, and Wisconsin) did not provide data concerning the residence status of all women obtaining abortions in their state. Women known to be aged 20--24 years obtained 33% of all abortions for which age was adequately reported. Adolescents known to be aged <15 years obtained <1.0% of all abortions in the 48 areas that reported age (Table 4). Abortion ratios were highest for adolescents aged <15 years (744 per 1,000 live births) and lowest for women aged 30--34 years (147 per 1,000) (Figure 2) (Table 4). In contrast to abortion ratios, among females for whom age was reported, abortion rates were highest for women aged 20--24 years (32 per 1,000 women) and lowest for females at the extremes of reproductive age (1 per 1,000 adolescents aged 13--14 years and 2 per 1,000 women aged 40--44 years) (Table 4). Among women aged <20 years (46 reporting areas), the percentage of abortions obtained increased with age (Table 5); the abortion ratio was highest for adolescents aged <15 years§ (731 per 1,000 live births) and lowest for women aged 19 years (326 per 1,000). Conversely, the rates of abortions were lowest (1 per 1,000) for adolescents aged <15 years and highest (29 per 1,000) for women aged 19 years) (Table 5). Abortion trends by age indicate that since 1973, abortion ratios have been higher for adolescents aged <15 years than for any other age group (Figure 3). For females aged <19 years and those aged >40 years, the abortion ratio generally increased from 1974 through the early 1980s and declined thereafter (Figure 3). The abortion ratio for women aged 20--34 years (those with the highest fertility rates) (7) has declined slightly since the mid-1980s. The abortion ratio for women aged 35--39 years has declined gradually over time. In 2001, for women whose weeks of gestation at the time of abortion were adequately reported (42 reporting areas), 59% of reported legal induced abortions were known to have been obtained at <8 weeks' gestation and 87% at <13 weeks (Table 6). Overall (40 reporting areas), 25% of abortions were known to have been performed at <6 weeks' gestation, 18% at 7 weeks, and 16% at 8 weeks (Table 7). Few reported abortions occurred after 15 weeks' gestation: 4.2% at 16--20 weeks and 1.4% at >21 weeks. For women whose type of procedure was adequately reported, 95% of abortions were known to have been performed by curettage (which includes dilatation and evacuation [D&E]) and 0.5% by intrauterine instillation (Table 8). Hysterectomy and hysterotomy were included in the "other" procedure category and were known to have been used in <0.01% of all abortions. Thirty-five reporting areas submitted information regarding performance of medical (nonsurgical) procedures,¶ hereafter referred to as medical abortions. Known medical abortions make up approximately 3% of all procedures reported from the 45 areas with adequate reporting on type of procedure. Additionally, three areas that did not collect data separately for medical abortions on their abortion reporting form included medical abortions in the "other" category. For the 32 areas that reported medical abortions separately, 20,093 medical abortion procedures were performed in 2001. (Five states reported that no medical abortions were performed in 2001 but did not specify whether such abortions were available.) For the 27 states that reported one or more medical abortion for both 2001 and 2000, the data reflect an increase of 173%, from 6,892 in 2000 to 18,836 in 2001 (6). The extent to which the 20,093 medical abortions reported to CDC for 2001 represent the use of this procedure in all reporting areas is unknown. In the 39 reporting areas for which race was provided classified according to the same categories used in previous years, approximately 54% of women who obtained legal induced abortions were known to be white, 36% black, and 8% other; for the other 2%, race was not known (Table 9). The abortion ratio for black women (491 per 1,000 live births) was 3.0 times the ratio for white women (165 per 1,000), and the ratio for women of the nonhomogenous "other" race category (376 per 1,000) was 2.3 times the ratio for white women. The abortion rate for black women (29 per 1,000 women) was 3.0 times the rate for white women (10 per 1,000) whereas the abortion rate for women of other races (21 per 1,000 women) was 2.1 times the rate for white women. Reporting areas provide data voluntarily and thus are not required to use the 31 race/ethnicity categories mandated by OMB for federally funded data collection. For responses to be maximized, race categories for Hispanic or Latina, non-Hispanic or Latina, and unknown ethnicity were summarized, and the Asian, Native Hawaiian or other Pacific Islander, and American Indian or Alaska Native categories were aggregated into "other." Data using this schema were available for 28 states, compared with 39 reporting areas for which data were available for the four race categories used in previous years (Table 9). The bridged race data did not provide new information and are included only for illustrative purposes (Table 9). Moreover, the bridged race data included only 39% of all reported abortions. In particular, the added "two or more races" category includes only five non-zero values. An examination of the states' Induced Termination of Pregnancy (ITOP) forms revealed that only two states offered an option of reporting two or more races, and only one state actually had a nonzero value. Moreover, one state could not separate certain "other" responses from unknown ones. As a result, the sum of self-defined "other" and "unknown" for the 39 reporting areas equals the sum of "other" as summed from three OMB-defined categories, "unknown" single race, and two or more races for the 28 states (Table 9). Abortion ratios and rates were not generated, because with <40% of all reported abortions represented (in addition to the three nonreporting states), these would not be appropriate national statistics. Thus, although providing data cross-classified by race and ethnicity would be helpful, attempts to collect these data in the future will not continue unless a substantial number of states change their race/ethnicity questions in this direction. NYC and 31 states reported separate and adequate data** on the ethnicity of women who obtained legal induced abortions (Table 10). The percentage of abortions known to have been obtained by Hispanic women in these reporting areas was 17% overall (range: from <0.1% [in Kentucky] to 49% [in New Mexico]). For Hispanic women in these reporting areas, the abortion ratio was 230 per 1,000 live births, and the abortion rate was 22 per 1,000 women. For women whose marital status was adequately reported (39 reporting areas), 79% of women who obtained abortions were known to be unmarried (Table 11). The abortion ratio for unmarried women (572 per 1,000 live births) was 8.8 times that for married women (65 per 1,000). For women who obtained legal induced abortions and for whom data on previous live births were adequately reported (41 reporting areas), 45% were known to have had no previous live births, and 88% had two or more previous live births (Table 12). The abortion ratio was highest for women who had either no or three previous live births (264 per 1,000 live births) and lowest for those who had one previous live birth (180 per 1,000). For women who obtained an abortion and whose number of previous abortions was adequately reported (39 reporting areas), 55% were reported to have obtained an abortion for the first time, and 18% were reported to have had at least two previous abortions (Table 13). For women whose age and race were known (37 reporting areas), white women had a slightly greater percentage of abortions in the youngest (<19 years) and oldest (>35 years) age groups compared with black women (18% versus 17% and 12% versus 9%, respectively), whereas women of other races who had abortions tended to be older (Table 14). For women whose marital status and race were both known, the percentage of reported abortions among unmarried black women was higher (88%) than that among unmarried women who were white (79%) or of other races (65%). Among older (aged >35 years) women obtaining abortions whose age and ethnicity were known and reported adequately (32 reporting areas), the percentage of abortions obtained by non-Hispanic women (12%) exceeded that for Hispanic women (10%) (Table 15). Among women whose marital status and ethnicity were known and reported adequately (30 reporting areas), the percentage of reported abortions obtained by unmarried women was somewhat higher for non-Hispanic women (82%) than for Hispanic women (80%) (Table 15). Adequate data were not available to cross-classify race by Hispanic ethnicity. As in the past, approximately 88% of all abortions for which gestational age at the time of abortion was known and reported adequately were obtained at <12 weeks' gestation (Table 1). The percentage of women who obtained an abortion at <8 weeks' gestation increased with age (Figure 4) (Table 16). This association was most pronounced for abortions obtained at <6 weeks' gestation (Table 17). The percentage of women who obtained an abortion at >21 weeks' gestation decreased with age for women through age 25--29 years (Table 16). Among women with adequately reported race and weeks of gestation, white women and women of other races were more likely than black women to obtain abortions at <6--7 weeks' gestation (Table 17). Among women with adequately reported known ethnicity and weeks of gestation, the difference in timing of their abortions between Hispanic and non-Hispanic women was minimal (0.1%--1.9%) at any gestational age (Tables 16 and 17). For women whose type of procedure and weeks of gestation were known and adequately reported (38 reporting areas), approximately 96% of reported abortions obtained at <15 weeks' gestation were performed by using curettage (primarily suction procedures) (Table 18). Approximately 95% of the 16,183 reported medical abortions were performed at <8 weeks' gestation, representing 4.6% of all abortions performed at <8 weeks' gestation. At >16 weeks' gestation, medical abortions (n = 496) made up 1.5% of all abortions. Medical abortions constituted 0.1% of procedures performed in the 9--15 weeks' gestation range. Intrauterine instillation involving use of saline or prostaglandin was used rarely (0.2% of all abortions), primarily at >16 weeks' gestation. By using data from the National Pregnancy Mortality Surveillance System, CDC identified 22 maternal deaths for 2000 that were potentially related to abortion. These maternal deaths were identified either by an indication of abortion on the death certificate or from information such as a news report associated with the death. Investigation of these cases indicated that 11 of the 22 deaths in 2000 were related to legal induced abortion and none to illegal induced abortion (Table 19); eight deaths were attributable to spontaneous abortion (miscarriage), and three deaths were determined not to be abortion related. Numbers of deaths attributable to legal induced abortion were highest before the 1980s, with a limited number of deaths occurring in any single year (Table 19). Possible abortion-related deaths that occurred during 2001--2004 are being investigated. DiscussionA total of 853,485 legal induced abortions were reported in the United States in 2001 from 47 states, DC, and NYC. This reflects a decline of 0.5% from the number of legal induced abortions reported for 2000 from the same reporting areas; however, the ratio increased 0.4%. A decline of 0.5% in the number of abortions is also apparent when the same 48 reporting areas that reported for all years 1998--2001 are compared with those that reported for 2000--2001 (6). Before 1998, a substantial number of legal induced abortions were estimated to have been performed in California (e.g., >23% of the U.S. total in 1997) (8). Beginning in 1998, data were no longer estimated for nonreporting states. The lack of data for California for 2001 explains the majority of the 28% decrease from the annual number of abortions reported for 1997 (8) as well as part of the decrease in the total ratio and rate. Overall, abortion ratios and abortion rates have declined over time (Figure 1). The abortion ratio for 2001 (246 per 1,000 live births for the same 49 reporting areas as 2000) remained relatively stable from the previous year. For the same 49 reporting areas as 2000, the abortion rate for women aged 15--44 years (16 per 1,000 women) declined slightly (0.8%) from the rate reported for 2000 (Table 2). The overall declines in the abortion ratio and rate over time might reflect multiple factors, including a decrease in the number of unintended pregnancies (9); a shift in the age distribution of women toward the older and less fertile ages (7); reduced or limited access to abortion services, including the passage of abortion laws that affect adolescents (e.g. parental consent or notification laws and mandatory waiting periods) (10--14); and changes in contraceptive practices, including increased use of contraceptives (e.g., condoms and, among young women, of long-acting hormonal contraceptive methods that were introduced in the early 1990s) (15--18). The abortion rate reported here for the United States was higher than recent rates reported for Canada and Western European countries and lower than rates reported for China, Cuba, the majority of Eastern European countries, and certain Newly Independent States of the former Soviet Union (19--21). As in previous years, the abortion ratio in 2001 varied substantially by age. Although the abortion ratio was highest for adolescents in 2001, since the mid-1980s, the ratio has gradually declined for those aged <15 and 15--19 years (Figure 3). Other studies also have indicated a decrease in birth rates for females aged 10--14 and 15--19 years during 1991--2001 and a decrease in adolescent pregnancy rates during 1991--2000 (7,22--29). However, abortion rates have not decreased equally among women of all races and ethnicities; rates are declining more slowly among adolescents who are not enrolled in school and those that are members of minority populations (29). The percentage distribution of abortions by known weeks of gestation has shifted slightly since the late 1970s. From 1992 (when detailed data on early abortions were first available) through 2001, data have indicated steady increases in procedures performed at <6 weeks' gestation with decreases occurring in the percentage of abortions performed at 8, 9--10, and 11--12 weeks' gestation. The increase in the percentage of abortions known to have been performed at <6 weeks' gestation might be related to an increase in the availability of early abortion services since 1992 and an increase in medical and surgical procedures that can be performed early in gestation (30,31). Abortions performed early in pregnancy are associated with lower risks of mortality and morbidity (32,33). The proportions of abortions performed later in pregnancy (>13 weeks) have varied little since 1992. The gestational age at which an abortion is obtained can be influenced by multiple factors in addition to those for which surveillance data are available (age, race, and ethnicity). These additional factors include level of education, availability and accessibility of abortion services, timing of confirmation of pregnancy, timing of personal decision-making, timing of prenatal diagnosis, level of fear of discovery of pregnancy, and denial of pregnancy (34--36). Since the mid-1990s, two medical regimens (mifepristone and methotrexate, each used in conjunction with misoprostol) have been tested in clinical trials and used by clinical practitioners to perform early medical abortions (31,37). CDC surveillance data indicate that approximately 60% of all U.S. abortions are performed at <8 weeks' gestation, which is similar to the timing of the regimen approved for both mifepristone and methotrexate (33,38). Mifepristone for medical abortion was approved by the U.S. Food and Drug Administration (FDA) for use and distribution in the United States in September 2000. The FDA-approved protocol can be initiated at <49 days of gestation and requires three office visits by the patient: administration of oral mifepristone, followed 48 hours later by oral misoprostol in the health-care provider's office, and a follow-up visit in approximately 14 days. Clinical studies of alternative medical abortion regimens have been performed in multiple countries and are ongoing (39--48). In 1997, the U.S. ITOP standard report published by NCHS and used by providers for abortion reporting to state health departments was revised to include a category for "medical (nonsurgical)" procedures (49). Medical abortion procedures have been included in this report since then as a separate category. CDC will continue to monitor early medical procedures and to report on the number of these procedures (Table 8). The percentage of abortions known to be performed by curettage increased from 88% in 1973 to >96% since 1980 (Table 1), whereas the percentage of abortions performed by intrauterine instillation declined sharply, from 10% to <1% since 1989. The increase in use of D&E is likely attributable to the lower risk for complications associated with the procedure (50,51). The percentage of abortions performed by D&E (curettage) at >13 weeks' gestation increased from 31% in 1974 (the first year for which these data were available) to 96% in 2001, and the percentage of abortions performed by intrauterine instillation at >13 weeks' gestation decreased from 57% to 1.1%; the percentage of medical abortions increased from 1.0% in 2000 to 2.9% in 2001 (Table 18) (6,52). The differential between the abortion ratio for black women and that for white women increased from 2.0 in 1989 (the first year for which black and other races were reported separately) to 3.0 in 2001 (53). In addition, the abortion rate for black women has been approximately three times as high as that for white women (range: 2.6--3.1) since 1991 (the first year for which rates by race were published) (54). These rates by race are substantially lower than rates previously published by NCHS and indicate that the reporting areas for the 2001 report might not be truly representative of the U.S. black female population of reproductive age. Census Bureau estimates and birth certificate data indicate that a substantial majority of Hispanic women report themselves as white (7). Therefore, data for certain white women represent white women of Hispanic ethnicity. In 2001, a total of 39 states, DC, and NYC reported Hispanic ethnicity of women who obtained abortions. Because of concerns regarding the completeness of such data (>15% unknown data) in certain states, in 2001, data from only 31 states and NYC were used to determine the number and percentage of abortions obtained by women of Hispanic ethnicity. These geographic areas represent approximately 44% of reproductive-age Hispanic women in the United States for 2001 and approximately 44% of U.S. Hispanic births (55). Thus, the number of Hispanic women who obtained abortions was underestimated, and the number, ratio, and rate of abortions for Hispanic women in this report are not generalizable to the overall Hispanic population in the United States. Abortion ratios for both Hispanic and non-Hispanic women have declined considerably since 1992 (25% and 29%, respectively). As in the past, the abortion rate for Hispanic women was higher (22 per 1,000 women) than the rate for non-Hispanic women (14 per 1,000). This finding is consistent with those of other studies published previously by NCHS (26,28). The reporting areas for the 2001 report might not be fully representative of the U.S. Hispanic female population of reproductive age. Race- and ethnicity-specific differences in legal induced abortion ratios and rates might reflect differences among populations in socioeconomic status, access to family planning and contraceptive services, contraceptive use, and incidence of unintended pregnancies. NCHS vital statistics reports indicate that fertility and live birth rates were substantially higher for Hispanic women as a whole than for non-Hispanic women for all age groups in 2001 (7). However, because fertility and live birth rates differ substantially among both the different Hispanic (i.e., Mexican, Puerto Rican, Cuban, and other Hispanic) and non-Hispanic (white, black, and other) subpopulations, comparisons between Hispanic and non-Hispanic populations are of limited value (7). Available abortion surveillance data do not permit cross-classification of race by Hispanic ethnicity. Despite efforts to collect and provide a cross-classification of race and ethnicity for this report in compliance with OMB Directive 15, which specifies federal standards for the collection of data on race and ethnicity (56), only 28 states (accounting for 39% of the total number of reported abortions) were able to provide adequate data for use of the recommended race categories. Because 11 states could not adequately break down the data by ethnicity, the racial breakdown was analyzed for all ethnicities. Moreover, three recommended racial categories (Asian, Native Hawaiian or other Pacific Islander, and American Indian or Alaskan Native) had to be combined into one category of "other" to accommodate overlapping categories provided by multiple states. For these reasons, no additional information about race or ethnicity was obtained as a result of attempts to cross-classify the data (Table 9). In 1972, a total of 24 women died from causes known to be associated with legal abortions, and 39 died as a result of known illegal abortions. In 2000, a total of 11 women died as a result of legal induced abortions, and none died as a result of illegal induced abortions. The number of legal induced abortion-related deaths identified for all 52 reporting areas for 2000 is similar to the numbers reported for the previous 24 years. However, national case-fatality rates for 1998--2000 cannot be calculated because a substantial number of abortions occurred in nonreporting states (four states in 1998 and 1999 and three states in 2000), and the total number of abortions (the denominator) is unknown. LimitationsThese data are reported voluntarily and are subject to at least five limitations. First, abortion data are compiled and reported to CDC by the central health department in the reporting area in which the abortion was performed rather than the area in which the woman resided. This inflates the numbers, ratios, and rates of abortions for areas in which a high proportion of legal abortions are obtained by out-of-state residents and undercounts procedures for states with limited abortion services or more stringent legal requirements for obtaining an abortion (causing women to seek abortions elsewhere). Second, four states (Alaska, California, New Hampshire, and Oklahoma) did not report abortion data for 1998--1999, and three states (Alaska, California, and New Hampshire) did not report data for 2000--2001. Data for California and Oklahoma were estimated before 1998; however, data for nonreporting states have not been estimated since 1997. Third, data provided to state or area health departments by providers might be incomplete (57). Fourth, the overall number, ratio, and rate of abortions are conservative estimates; the total numbers of legal induced abortions provided by central health agencies and reported to CDC for 2001 were probably lower than the numbers actually performed. Additionally, the abortion total for 2000 provided to CDC by central health agencies are 20% lower than that reported for 2000 (the most recent year for which data are available) for the same reporting areas by The Alan Guttmacher Institute, a private organization that contacts abortion providers directly (58). A previous report documented a discrepancy of approximately 12% (59); the reasons for this larger discrepancy are unclear. Finally, because not all states collected or reported data on all characteristics (e.g., age, race, and the number of weeks' gestation) of women obtaining a legal induced abortion in 2001, the numbers, rates, and ratios derived in this analysis might not be representative of all women who obtained abortions. Public Health ActionsDespite these limitations, findings from ongoing national surveillance of legal induced abortion are useful for at least six purposes. First, public health agencies use data from abortion surveillance to identify characteristics of women who are at high risk for unintended pregnancy. Second, ongoing annual surveillance is used to monitor trends in the number, ratio, and rate of abortions in the United States. Third, statistics regarding the number of pregnancies ending in abortion are used in conjunction with birth data and fetal death computations to estimate pregnancy rates (e.g., pregnancy rates among adolescents) (22--26,28). Fourth, abortion and pregnancy rates can be used to evaluate the effectiveness of family planning programs and programs for preventing unintended pregnancy. Fifth, ongoing surveillance provides data for assessing changes in clinical practice patterns related to abortion (e.g., longitudinal changes in the types of procedures and trends in weeks of gestation at the time of abortion). Finally, numbers of abortions are used as the denominator in calculating abortion mortality rates (32). The Health Insurance Portability and Accountability Act (HIPAA) was enacted by Congress in 1996 to facilitate the electronic transfer of health data relating primarily to insurance coverage and transferability (60). HIPAA provisions mandate adoption of federal privacy protections for certain individually identifiable health information. The U.S. Department of Health and Human Services issued the Privacy Rule that became effective on April 14, 2003. Because the Privacy Rule exempts protected health information required for public health purposes from privacy protections, covered entities may provide such information without a person's authorization to a public health authority (e.g., CDC) whose stated purpose is to prevent and control disease. Collection of surveillance data for this report is exempt from the Privacy Rule. However, the complexity of the rule might result in difficulty in its interpretation and therefore in collecting surveillance data on the part of certain contributing agencies (60). Induced abortions usually result from unintended pregnancies, which often occur despite the use of contraception (15,61--62). Research has indicated that approximately 49% of all pregnancies in 1994 were unintended at conception (63). Additionally, 31% of births in 1995 were reported as unintended at conception; 21% were considered mistimed, and 10% were considered unwanted (9,63). Unintended pregnancy is a problem not just for adolescents, unmarried women, or women of low socioeconomic status; it is a pervasive public health problem for all women of reproductive age (9,15,54,63). A reduction in the number of unintended pregnancies, and thus in the number of abortions, will require adapting complex strategies. In a study of abortion patients conducted during 2000--2001, a total of 54% of patients reported that they were using contraception during the month they became pregnant. However, their use of contraception might have been inconsistent or incorrect (18). In 1995, the year for which the most recent National Survey of Family Growth (NSFG) data are available, approximately 29% of sexually active U.S. women who used only oral contraceptives for birth control reported that they had missed a birth-control pill more than once during the 3 months before their NSFG interview. In addition, approximately 33% of U.S. women who were using only coitus-dependent contraceptive methods†† during the 3 months before the interview used these methods inconsistently (9). Coverage of reversible contraception has increased substantially since 1993 (64) although gaps in coverage remain substantial. Education regarding abstinence and contraceptive use and practices, combined with access to and education regarding safe, effective, contraception and family planning services, might help reduce the incidence of unintended pregnancy and, therefore, the number of legal induced abortions in the United States (65--67). Copies of this and other MMWR reports containing statistical and epidemiologic data about abortions can be obtained from CDC at http://www.cdc.gov/nccdphp/drh/surv_abort.htm. Acknowledgments The authors thank Rose Pecoraro, Division of Reproductive Health, National Center for Chronic Disease Prevention and Health Promotion, CDC, for her work on graphics for this surveillance project. References
* Includes state, DC, and NYC health departments. † Wyoming reported four abortions occurring in 2001. As a result of the small number, and because computing abortion ratios and rates for such a limited number is not appropriate, Wyoming was not included in this sequence in the text. § Ratios for adolescents aged <15 years differ in Tables 4 and 5 because a different number of areas reported; Table 4 includes 48 reporting areas, and Table 5 includes 46. ¶ Medical (nonsurgical) abortion procedures involve the administration of a medication or medications to induce abortion. ** After exclusion of nine areas in which ethnicity data were unknown for >15% of women who obtained an abortion. †† Coitus-dependent contraceptive methods include male or female condoms, diaphragm, sponge, cream, jelly, or other methods that must be used at the time intercourse occurs. Table 1    Return to top. Figure 1  Return to top. Table 2  Return to top. Figure 2  Return to top. Table 3 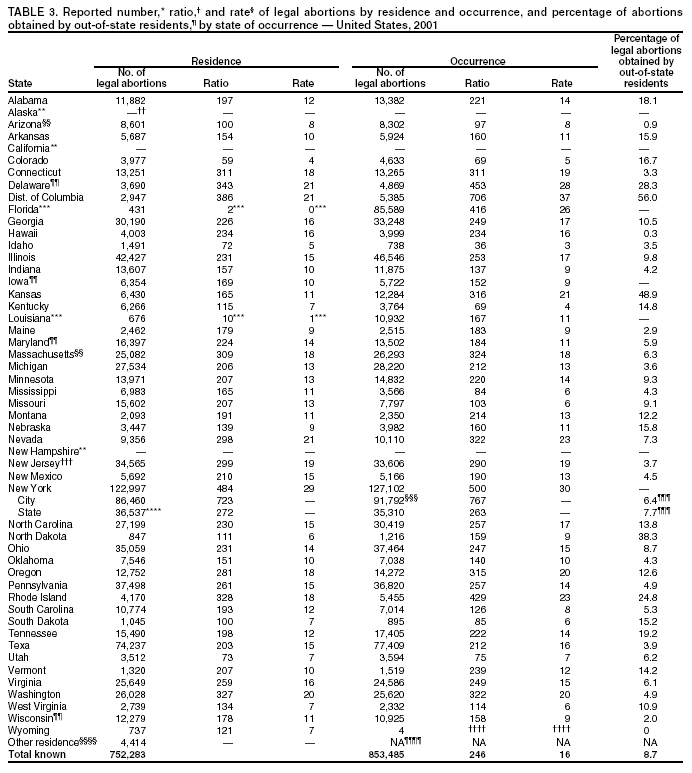 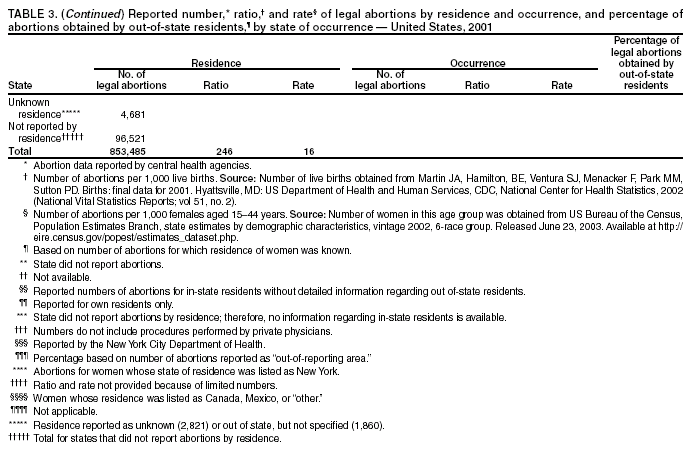 Return to top. Figure 3  Return to top. Table 4  Return to top. Figure 4  Return to top. Table 5  Return to top. Table 6 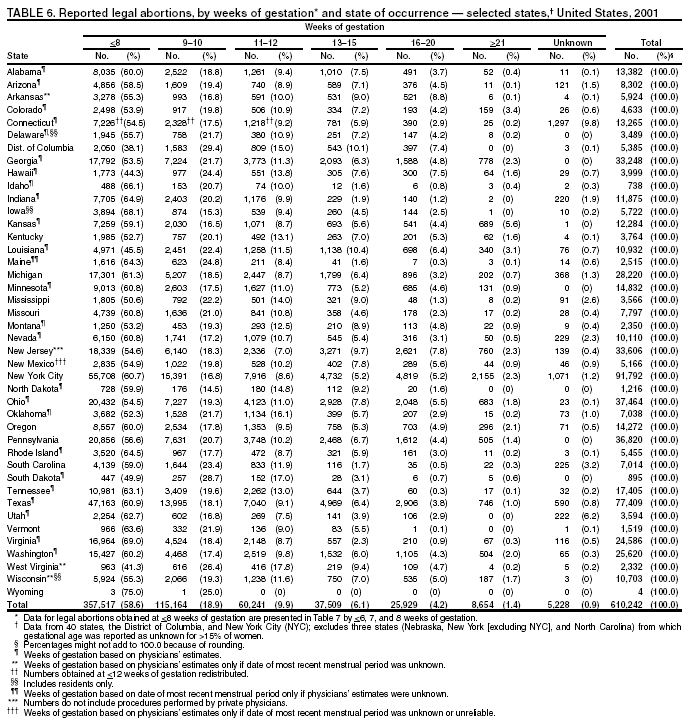 Return to top. Table 7  Return to top. Table 8  Return to top. Table 9   Return to top. Table 10  Return to top. Table 11  Return to top. Table 12  Return to top. Table 13 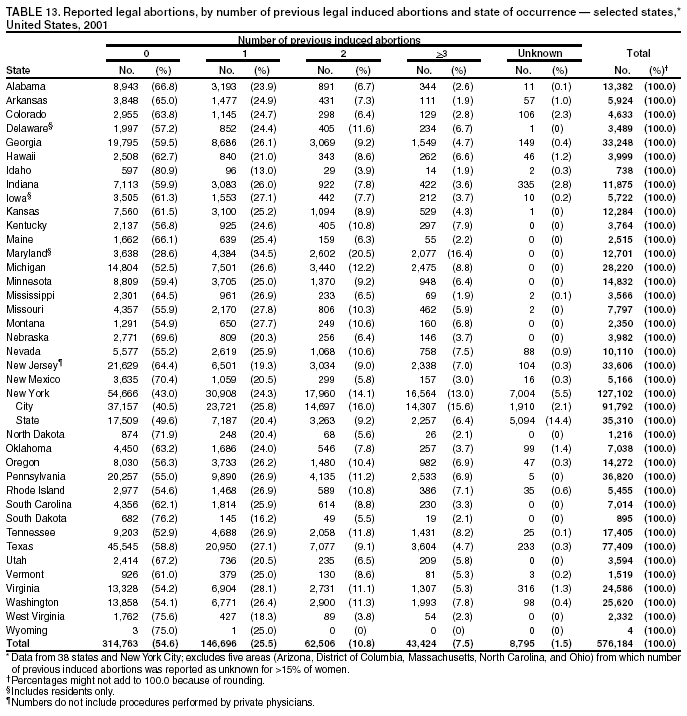 Return to top. Table 14  Return to top. Table 15  Return to top. Table 16  Return to top. Table 17  Return to top. Table 18  Return to top. Table 19  Return to top.
Disclaimer All MMWR HTML versions of articles are electronic conversions from ASCII text into HTML. This conversion may have resulted in character translation or format errors in the HTML version. Users should not rely on this HTML document, but are referred to the electronic PDF version and/or the original MMWR paper copy for the official text, figures, and tables. An original paper copy of this issue can be obtained from the Superintendent of Documents, U.S. Government Printing Office (GPO), Washington, DC 20402-9371; telephone: (202) 512-1800. Contact GPO for current prices. **Questions or messages regarding errors in formatting should be addressed to mmwrq@cdc.gov.Page converted: 11/16/2004 |
|||||||||
This page last reviewed 11/16/2004
|