 |
|
|
|
|
|
|
| ||||||||||
|
|
|
|
|
|
|
||||
| ||||||||||
|
|
|
|
|
Persons using assistive technology might not be able to fully access information in this file. For assistance, please send e-mail to: mmwrq@cdc.gov. Type 508 Accommodation and the title of the report in the subject line of e-mail. Prevalence of Selected Maternal Behaviors and Experiences, Pregnancy Risk Assessment Monitoring System (PRAMS), 1999Laurie F. Beck, M.P.H.1
Abstract Problem/Condition: Various maternal behaviors and experiences before, during, and after pregnancy (e.g., unintended pregnancy, late entry into prenatal care, cigarette smoking, not breast-feeding) are associated with adverse health outcomes for both the mother and the infant. Information regarding maternal behaviors and experiences is needed to monitor trends, to enhance the understanding of the relations between behaviors and health outcomes, to plan and evaluate programs, to direct policy decisions, and to monitor progress toward Healthy People 2000 and 2010 objectives. Reporting Period Covered: This report covers data from 1993 through 1999. Description of System: The Pregnancy Risk Assessment Monitoring System (PRAMS) is an ongoing, state- and population-based surveillance system designed to monitor selected self-reported maternal behaviors and experiences that occur before, during, and after pregnancy among women who deliver a live-born infant. PRAMS employs a mixed-mode data collection methodology; up to three self-administered surveys are mailed to a sample of mothers, and nonresponders are followed up with a telephone interview. Self-reported survey data are linked to selected birth certificate data and weighted for sample design, nonresponse, and noncoverage to create annual PRAMS analysis data sets. PRAMS generates statewide estimates of various perinatal health topics among women delivering a live infant. Data for 1999 from 17 states are examined. In addition, trend data are examined for 12 states that had at least 3 years of data during 1993--1999. Results: In 1999, the prevalence of unintended pregnancy resulting in a live birth ranged from 33.7% to 52% across the 17 states. During 1993--1999, only one state reported a decreasing trend in the prevalence of unintended pregnancy. Women aged <20 years, black women, women with less than or equal to a high school education, and women receiving Medicaid were more likely to report unintended pregnancy. The prevalence of late or no entry into prenatal care ranged from 16.1% to 29.9%. The prevalence of late or no entry into prenatal care significantly decreased over time in seven of the 12 states with trend data. In general, women aged <20 years, black women, women with less than a high school education, and women receiving Medicaid were more likely to report late or no entry into prenatal care. The prevalence of smoking during the last 3 months of pregnancy ranged from 6.2% to 27.2%, and the prevalence decreased in five states from 1993 to 1999. Overall, smoking during the last 3 months of pregnancy was associated with younger age (<25 years), non-Hispanic ethnicity, having less than or equal to a high . school education, receiving Medicaid, and delivering a low birthweight infant. The prevalence of physical abuse by a husband or partner during pregnancy ranged from 2.1% to 6.3%. No trends were observed for physical abuse from 1996 to 1999, the only years for which these data were available. Across the 17 states, only Medicaid status was consistently associated with experiencing physical abuse during pregnancy. The prevalence of breast-feeding initiation ranged from 48% to 89%. Ten of 12 states with trend data reported increases in the prevalence of breast-feeding initiation. Overall, women aged <20 years, women with less than or equal to a high school education, and women receiving Medicaid were less likely to breast-feed. The prevalence of breast-feeding duration for at least 4 weeks ranged from 34.9% to 78.1%. From 1993 to 1999, increases in levels of breast-feeding for at least 4 weeks were observed in eight states. Women aged <25 years, black women, women with less than or equal to a high school education, and women receiving Medicaid were generally less likely to breast-feed for at least 4 weeks. The prevalence of back sleep position for infants ranged from 35.1% to 74.6%. Increases in the use of the back sleep position were observed in all 12 states with trend data from 1996 to 1999. Black race and having less than or equal to a high school education were consistently associated with not using the back sleep position. Interpretation: For surveillance during 1993--1999, the majority or all states observed increases in breast-feeding initiation, breast-feeding for at least 4 weeks, and back sleep position. Approximately one half of the states observed decreases for late or no entry into prenatal care and smoking during the last 3 months of pregnancy. Little or no progress was observed in the prevalence of unintended pregnancy or physical abuse during pregnancy. With few exceptions, the 17 states failed to meet the Healthy People 2000 objectives for the seven reported behaviors in 1999. Certain demographic and socioeconomic characteristics of women were associated with an increased risk for several of the behaviors, including younger age, black race, less education, and receipt of Medicaid just before or during pregnancy. Public Health Action: State maternal and child health programs can use these population-based data for reporting on core and state-negotiated performance measures of the Title V Block Grant Measurement Performance System. The data, which are important in planning and evaluation programs, help identify whether target populations are receiving services and help identify barriers to or gaps in services. The data can be shared with policy makers to direct policy decisions that might affect the health of mothers and infants. In addition, these findings can be used to monitor progress toward Healthy People 2000 and Healthy People 2010 objectives. Introduction Various maternal behaviors and experiences before, during, and after pregnancy are associated with adverse health outcomes for both the mother and the infant. For example, cigarette smoking during pregnancy is associated with low birthweight, spontaneous abortion, stillbirth, abruptio placentae, and placenta previa (1,2). The receipt of late or inadequate prenatal care is associated with increased risk of adverse birth outcomes (e.g., low birthweight). In addition, inadequate prenatal care might prevent or delay the diagnosis and treatment of medical conditions (e.g., pregnancy-induced hypertension and diabetes [3,4]). Prone or side sleep position and exposure to tobacco smoke in utero or after delivery are modifiable factors that are associated with an increased risk of sudden infant death syndrome (SIDS) (5--8). Monitoring the prevalence of such behavioral risk factors can provide direction for interventions to improve the health of mothers and infants. The Pregnancy Risk Assessment Monitoring System (PRAMS) was initiated in 1987 and is administered by CDC's National Center for Chronic Disease Prevention and Health Promotion, Division of Reproductive Health. PRAMS is an ongoing, state- and population-based surveillance system designed to monitor selected self-reported maternal behaviors and experiences that occur before, during, and after pregnancy among women who deliver a live-born infant. The PRAMS questionnaire addresses various behaviors and experiences. Seven maternal and child health topics were selected for this report: 1) unintended pregnancy, 2) late or no entry into prenatal care, 3) cigarette smoking during the last 3 months of pregnancy, 4) physical abuse during pregnancy, 5) breast-feeding initiation, 6) breast-feeding duration of at least 4 weeks, and 7) infant sleep position. The data can be used to plan and evaluate programs, to direct policy decisions, and to monitor progress toward Healthy People 2010 objectives and Maternal and Child Health Bureau performance measures (9,10). In addition, PRAMS data will support the activities of CDC's Safe Motherhood Initiative, for example, by providing data regarding unintended pregnancy, late or no entry into prenatal care, physical abuse, and other factors that are associated with adverse health effects for pregnant women. This report includes both multistate and state-specific analyses of PRAMS data. Prevalence estimates for 1999 and trend data from 1993 through 1999 are presented by state for the seven maternal and child health topics. For 1999, subgroup analyses (i.e., by age, race, Hispanic ethnicity, education, Medicaid status, and infant birthweight) are presented for each of the seven topics. This report updates previous findings (11). Annual reports that highlight key findings regarding PRAMS for previous years are also available (12--15). MethodsProject DescriptionPRAMS was implemented in 1987 to help state health departments establish and maintain a public health surveillance system of selected maternal behaviors and experiences to supplement data from vital records. PRAMS operates through a cooperative agreement mechanism. In the health departments, PRAMS program structure involves several existing organizational units, including maternal and child health and vital statistics. This interorganizational collaboration is critical for the effective implementation of PRAMS. Since its inception, PRAMS has expanded from six state and local health departments in 1987 to 33 in 2001. This number includes 29 states and one city that conduct the traditional PRAMS surveillance, two states that were recently funded to implement a point-in-time survey, and one state that conducts the traditional PRAMS surveillance and that is funded to develop and implement an enhanced PRAMS methodology. Live births in these states and city represent approximately 62% of all live births in the United States. This report covers the 17 states that participated in PRAMS in 1999. Data CollectionPRAMS provides statewide estimates of specific perinatal health topics among women delivering a live infant. Each participating state uses a standardized data collection methodology developed by CDC (CDC, unpublished data, 1999). Every month, a stratified random sample of 100--250 new mothers is selected from eligible birth certificates. Stratification varies by state; each state selects up to two stratification variables (e.g., birthweight, maternal race/ethnicity, maternal education, maternal age, geographic area, or Medicaid status). PRAMS employs a mixed-mode data collection methodology; up to three self-administered surveys are mailed to mothers in the sample, and nonresponders are followed up with a telephone interview. The first survey is typically mailed 2--3 months after delivery to collect information about postpartum maternal and infant experiences. Self-reported survey data are linked to selected birth certificate data and weighted for sample design, nonresponse, and noncoverage to create the PRAMS analysis data sets. The noncoverage weight accounts for omissions from the sampling frame --- for example, if a birth certificate was filed late (after the sample was selected). These omissions were generally negligible. The PRAMS questionnaire is revised periodically, and each revision is referred to as a "phase." The 1999 data that are highlighted in this report were collected with the third phase of the questionnaire that was in the field from late 1995 through the end of 1999. Additional details about the PRAMS methodology are available (16). Data AnalysisThis report includes data from 17 states (Alabama, Alaska, Arkansas, Colorado, Florida, Illinois, Louisiana, Maine, New Mexico, New York, North Carolina, Ohio, Oklahoma, South Carolina, Utah, Washington, and West Virginia) that had fully implemented PRAMS data collection procedures in 1999. Weighted response rates ranged from 72% to 81% (Appendix). The weighted response rate indicates the proportion of women sampled who completed a survey, adjusted for sample design. For one reporting area, data are not representative of the entire state: New York data are for upstate New York only and exclude New York City, which has an autonomous vital records agency. Data are presented for seven maternal behaviors and experiences that were self-reported on the survey. Unintended pregnancy was defined as, at the time of conception, wanting to be pregnant later (i.e., mistimed) or not wanting to be pregnant then or at any time in the future (i.e., unwanted). Late or no entry into prenatal care was defined as beginning prenatal care after the first trimester or not receiving any prenatal care at all. Smoking during the last 3 months of pregnancy was defined as any cigarette smoking during that period. Physical abuse during pregnancy was defined as being pushed, hit, slapped, kicked, or otherwise physically hurt by a husband or partner at any time during the pregnancy. Breast-feeding initiation was defined as any breast-feeding after delivery. Breast-feeding duration for at least 4 weeks was defined as breast-feeding for at least 4 weeks after delivery, whether or not the infant was exclusively breast-fed during this period. Back sleep position was defined as placing the infant down to sleep on his or her back most of the time. The 1999 prevalence estimates are presented by state with associated standard errors and 95% confidence intervals (CIs). Graphs accompany the tables. Trend data are presented by state for those states that had multiple years of data available. The trend tables include data for 1993--1999 for those indicators for which data are available since 1993 or for 1996--1999 for those indicators that were included in the survey in 1996. Data for New York during 1993--1996 include hospital-based surveillance that supplemented the mail and telephone methodology. The 1997 data for North Carolina represent a partial year (July through December) and are weighted to that period. New Mexico has a combined data set of births from July 1997 through December 1998 that are weighted to that period; these data are referred to as 1998 data. Trend tables include data for three states (Colorado, Louisiana, and New Mexico) that had only 1998 and 1999 data available. However, these states were not included in the results sections where trends were only assessed for states that had >3 years of data. Prevalence estimates for 1999 are presented by sociodemographic characteristic and state. The majority of sociodemographic characteristics (i.e., age, race, Hispanic ethnicity, education, and birthweight) were taken from the birth certificate. Maternal age was grouped into four categories (<20 years, 20--24 years, 25--34 years, and >35 years). Race was grouped into three categories: white, black, and other. The other category includes racial groups for which data from sample sizes were not adequate to report individually. In Alaska, the other race category is comprised primarily of Alaska Natives, and in New Mexico and Oklahoma, the other race category is comprised primarily of Native Americans. In the remaining 14 states, the other race category is composed primarily of Asians. Ethnicity was defined as Hispanic or non-Hispanic. Education was grouped into three categories (less than high school, high school, more than high school). Birthweight was defined as low (<2500g) or normal (>2500g). Medicaid status was self-reported on the survey. A Medicaid recipient was defined as someone who was receiving Medicaid just before the pregnancy or who used Medicaid to pay for prenatal care or delivery. All tables in the report were produced using weighted PRAMS data. Percentages and standard errors were calculated for the characteristic of interest using PROC CROSSTAB in SUDAAN (17). The 95% CIs were computed using the formula CI = percentage ± (1.96 x standard error). The number of respondents is the number of mothers who answered a particular PRAMS question. All missing observations are excluded. An estimate is noted in the tables when the percentage of missing values is >10%. For unintended pregnancy only, "don't know" was included as a valid response option on the survey. These responses are excluded from the present analysis and have a negligible effect on the prevalence estimates. In addition, these responses are excluded along with the missing data, which account for the large number of unintended pregnancy estimates with >10% of missing data. Because estimates based on small samples are not precise and might be biased, estimates for which the number of respondents is <30 are not reported in the tables that present data by sociodemographic characteristic. Estimates based on sample sizes between 30 and 60 are reported but noted because the estimates might be unreliable. Sociodemographic differences were considered significant if the CIs did not overlap. In the tables that present trend data, the p value indicates a test for linear trend and was calculated using PROC LOGISTIC in SUDAAN (17). ResultsUnintended PregnancyIn 1999, the prevalence of unintended pregnancy among women delivering a live-born infant ranged from 33.7%--52% across the 17 states (Table 1). The prevalence was lowest in Utah and highest in Louisiana (Figure 1). North Carolina experienced a significant decrease in the prevalence of unintended pregnancy during 1997--1999 (Table 2); no other states experienced statistically significant trends over time. The prevalence of unintended pregnancy among women having a live birth varied by selected sociodemographic characteristics (Table 3). In all states, unintended pregnancy resulting in live births decreased with increasing maternal age. In general, unintended pregnancy was more prevalent among younger women (aged <20 years) than among women aged >20 years. In addition, women aged 20--24 years were generally more likely to report an unintended pregnancy than women aged >25 years. In 13 of 15 states where adequate data were available for black populations, the prevalence of unintended pregnancy among women having a live birth was significantly higher among black women than among white women. Adequate data for the other race category were available in 12 states. In five states (Alaska, Louisiana, New Mexico, Oklahoma, and Utah), women of other race were more likely to report an unintended pregnancy than white women. In four states (Illinois, North Carolina, Ohio, and Washington), black women were more likely to report an unintended pregnancy than women of other race. No significant differences were noted by Hispanic versus non-Hispanic ethnicity. In all states, the prevalence of unintended pregnancy decreased as the level of education increased. In general, unintended pregnancy was more prevalent among women with a high school education or less than among women with more than a high school education. In all states, the prevalence of unintended pregnancy resulting in a live birth was significantly higher among women receiving Medicaid than among women not receiving Medicaid. In four states (Florida, Illinois, Ohio, and South Carolina), the prevalence of unintended pregnancy was significantly higher among women delivering a low birthweight infant than among those delivering a normal birthweight infant. Late or No Entry into Prenatal CareIn 1999, 16.1%--29.9% of women reported receiving late or no entry into prenatal care (Table 4). The prevalence of late or no entry into prenatal care was lowest in Maine and highest in Oklahoma (Figure 2). From 1993 through 1999, the prevalence of late or no entry into prenatal care significantly declined in seven of the 12 states with at least 3 years of data (Table 5). In all 17 states, the prevalence of late or no entry into prenatal care decreased as age increased (Table 6). In general, the prevalence of late or no entry into prenatal care was significantly higher among women aged <20 years than among women aged >25 years. In 10 of 15 states where adequate data were available for black populations, late or no entry into prenatal care was significantly higher among black women than among white women. Adequate data for the other race category were available in 13 states. In seven of those states (Arkansas, Florida, New Mexico, New York, North Carolina, Utah, and Washington), women of other race were more likely to report late or no entry into prenatal care than white women. In Ohio, black women were significantly more likely than women of other race to receive late or no prenatal care. Hispanic women in Colorado, Illinois, North Carolina, and Washington reported a significantly higher prevalence of late or no entry into prenatal care than non-Hispanic women. In all states, the prevalence of late or no entry into prenatal care decreased as level of education increased. Overall, a significant decrease occurred at each increase in educational level. In all 17 states, the prevalence of late or no entry into prenatal care was significantly higher among women who received Medicaid compared with women who did not receive Medicaid. Differences in the prevalence of late or no entry into prenatal care by infant birthweight were observed only in Arkansas, where women who delivered low birthweight infants were more likely to report late or no entry into prenatal care than women who delivered normal birthweight infants. Smoking During the Last 3 Months of PregnancyIn 1999, the prevalence of smoking cigarettes during the last 3 months of pregnancy ranged from 6.2%--27.2% (Table 7). The prevalence was lowest in Utah and highest in West Virginia (Figure 3). From 1993 through 1999, the proportion of women who smoked during the last 3 months of pregnancy decreased significantly in Alaska, Florida, New York, Oklahoma, and Washington (Table 8). In five states, no statistically significant differences were observed between age groups (Table 9). Where significant differences were observed, the prevalence of smoking decreased as age increased. In six of 15 states where adequate data were available for black populations (Alabama, Arkansas, Florida, Louisiana, Ohio, and South Carolina), white women were significantly more likely to report smoking during the last 3 months of pregnancy than black women. Adequate data for the other race category were available in 13 states. White women were more likely than women of other race to report smoking during the last 3 months of pregnancy in five states (Colorado, Florida, Illinois, New Mexico, and Ohio), whereas women of other race were more likely to report smoking than white women in Alaska. The prevalence of smoking during the last 3 months of pregnancy was significantly higher among non-Hispanic women than Hispanic women in 9 of 13 states where data were available for Hispanic populations. The prevalence of smoking during the last 3 months of pregnancy decreased as the level of education increased in 16 of the 17 states; in general, women with less than or equal to a high school education were more likely to smoke than women with more than a high school education. In all states except Oklahoma, the prevalence of smoking during the last 3 months of pregnancy was significantly higher among women receiving Medicaid than among women not receiving Medicaid. The prevalence of smoking during the last 3 months of pregnancy was higher among women who delivered a low birthweight infant than among women who delivered a normal birthweight infant in all states; statistically significant differences were observed in 11 of the 17 states. Physical Abuse by Husband or Partner During PregnancyIn 1999, the prevalence of physical abuse by a husband or partner during pregnancy ranged from 2.1% to 6.3% (Table 10). The prevalence was lowest in Maine and Utah and highest in New Mexico (Figure 4). Data for this indicator were available only from 1996 through 1999. No significant trends occurred over this period for any state (Table 11). When examined by age group, seven states (Florida, Illinois, Louisiana, Oklahoma, South Carolina, Utah, and West Virginia) experienced significant differences in the prevalence of physical abuse during pregnancy (Table 12). Younger women were generally at higher risk, but no consistent patterns existed between states. Significant differences in physical abuse reporting during pregnancy by race were observed in only one state. In Illinois, white women and black women were more likely to report physical abuse during pregnancy than women of other race. In Louisiana and South Carolina, non-Hispanic women were more likely to report physical abuse than Hispanic women. The prevalence of physical abuse by a husband or partner during pregnancy varied significantly by education in nine states. The prevalence was significantly higher among women with less than a high school education than among women with more than a high school education. In 16 states, the prevalence of physical abuse by a husband or partner during pregnancy was significantly higher among women who received Medicaid than among women who did not receive Medicaid. In no state did the prevalence of physical abuse during pregnancy vary significantly by birthweight category. Breast-Feeding InitiationIn 1999, the prevalence of breast-feeding initiation ranged from 48% to 89% (Table 13). The prevalence was highest in Alaska and lowest in Louisiana (Figure 5). Among the 12 states with at least 3 years of data during 1993--1999, statistically significant increases in breast-feeding initiation were observed in 10 states (Table 14). In 15 states, younger women (aged <20 years) were less likely to breast-feed than older women (Table 15). In eight of 15 states where adequate data were available for black populations, black women were significantly less likely to breast-feed than white women. Adequate data for the other race category were available in 13 states. Where differences were observed, women of other race were more likely to breast-feed than white or black women. In five states (Arkansas, Florida, Illinois, Louisiana, and Ohio), black women were less likely than women of other race to initiate breast-feeding. In three states (Illinois, Louisiana, and Ohio), white women were less likely than women of other race to initiate breast-feeding. In the 13 states where data were reported for Hispanic populations, significant differences were observed in seven states. Non-Hispanic women were less likely than Hispanic women to breast-feed in Arkansas, Illinois, Louisiana, New York, North Carolina, and Oklahoma. However, in Colorado, Hispanic women were less likely to breast-feed than non-Hispanic women. In 16 of the 17 states, breast-feeding initiation varied by level of education. Overall, women with less than or equal to a high school education were significantly less likely to breast-feed than women with more than a high school education. Women receiving Medicaid were less likely to breast-feed than women not receiving Medicaid in all 17 states; statistically significant differences were observed in 12 of those states. Women who delivered low birthweight infants were less likely to breast-feed than women who delivered normal birthweight infants in all 17 states; statistically significant differences were observed in 10 of those states. Breast-Feeding Duration for at Least 4 WeeksIn 1999, the prevalence of breast-feeding for at least 4 weeks after delivery ranged from 34.9% to 78.1% (Table 16). The prevalence was highest in Utah and lowest in Louisiana (Figure 6). Among the 12 states with at least 3 years of data during 1993--1999, breast-feeding at 4 weeks after delivery significantly increased in eight states (Table 17). In all states, younger women (aged <20 years) were significantly less likely to breast-feed for at least 4 weeks than women aged >25 years (Table 18). In 12 of the 17 states, women aged 20--24 years were significantly less likely to breast-feed for at least 4 weeks than women aged >25 years. In 10 of 15 states where adequate data were available for black populations, black women were less likely than white women to breast-feed for at least 4 weeks. Adequate data for the other race category were available in 13 states. Differences were observed between women of white and other race, but these differences were not consistent. In Alaska and Utah, women of other race were less likely than women of white race to breast-feed for at least 4 weeks; in Illinois, Louisiana, and Ohio, white women were less likely than women of other race to breast-feed for at least 4 weeks. In six states (Alaska, Illinois, Louisiana, North Carolina, Ohio, and Washington), black women were less likely than women of other race to breast-feed for at least 4 weeks. In six of 13 states with sufficient data, significant differences were observed in breast-feeding for at least 4 weeks by Hispanic ethnicity. In Arkansas, Illinois, Louisiana, and North Carolina, non-Hispanic women were less likely than Hispanic women to continue breast-feeding for at least 4 weeks, whereas the opposite was true in Colorado and New Mexico. In all states, women with less than or equal to a high school education were significantly less likely to breast-feed for at least 4 weeks than women with more than a high school education. In all states, women receiving Medicaid were significantly less likely than women not receiving Medicaid to breast-feed for at least 4 weeks. In 10 states, women who delivered low birthweight infants were significantly less likely than women who delivered normal birthweight infants to breast-feed for at least 4 weeks. Back Infant Sleep PositionIn 1999, the prevalence of the use of the back sleep position ranged from 35.1% to 74.6% (Table 19). The prevalence was highest in Utah and lowest in Louisiana (Figure 7). Among the 12 states with at least 3 years of data from 1996 to 1999, the use of back positioning significantly increased in every state (Table 20). Statistically significant differences in the use of the back sleep position by age group were observed in seven states (Table 21). Where differences were observed, the use of the back sleep position increased as age increased. In 14 of 15 states where sufficient data were available for black populations, black women were significantly less likely to put their babies to sleep on their backs compared with white women. Adequate data for the other race category were available in 12 states. In eight states (Alaska, Arkansas, Colorado, Illinois, New York, Ohio, Utah, and Washington), black women were less likely to use the back position than women of other race. In New Mexico, white women used the back position significantly less often than women of other race. In five of 13 states where data were reported for Hispanic populations (Colorado, Florida, New Mexico, New York, and Utah), Hispanic women were significantly less likely to place their babies to sleep on their backs than non-Hispanic women. In 13 states, the use of the back sleep position significantly increased as education level of the mother increased. In 10 of the 17 states, women receiving Medicaid reported using the back sleeping position significantly less often than women who were not receiving Medicaid. In three states (Alabama, Illinois, and West Virginia), women who delivered a low birthweight baby were significantly less likely to report using the back position compared with women who delivered a normal birthweight infant . DiscussionUnintended PregnancyMore than one half of all pregnancies in the United States are unintended (18--19). In PRAMS, unintended pregnancies include mistimed pregnancies, defined as those that occur sooner than desired, and unwanted pregnancies, defined as those that are not wanted at any time. Unintended pregnancy is associated with various behaviors that can affect pregnancy outcomes (e.g., late entry into prenatal care and tobacco and alcohol use during pregnancy) (18,20). Unintended pregnancy results in a lost opportunity for preconception care to prepare for an optimal pregnancy (21,22). Unintended pregnancy might also affect birth outcomes, including low birthweight and preterm delivery (18,23). The Healthy People 2000 and Healthy People 2010 objectives address the same goal for reducing unintended pregnancies to no more than 30% (9,24). Approximately one half of all unintended pregnancies end in induced abortion, whereas the other one half result in live births (18,25). PRAMS provides prevalence data only for unintended pregnancies that result in live births. A decreasing trend over time occurred only in North Carolina where data were available from 1997 through 1999. Because PRAMS data underestimate the true prevalence of all unintended pregnancies (including induced abortions), it is unlikely that any of these states will reach the Healthy People 2000 objective. Across states, consistent differences occurred in the prevalence of unintended pregnancy resulting in a live birth by sociodemographic characteristics. Younger women, black women, women with no more than a high school education, and women who received Medicaid were most likely to report an unintended pregnancy. However, even groups with lower risk reported high levels of unintended pregnancy resulting in a live birth. For example, across the 17 states, the prevalence of unintended pregnancy ranged from 23.7% to 37.2% among women aged 25--34 years, and the prevalence ranged from 23.4% to 39.5% among women with more than a high school education. In nine and eight states, respectively, these estimates are greater than the Healthy People 2000 and Healthy People 2010 objectives. PRAMS is the only ongoing, state- and population-based source of pregnancy intention data resulting in live births for the participating states. Similar findings regarding age, race, and education have been reported from national periodic surveys, including the 1988 National Maternal and Infant Health Survey, a nationally representative sample of births, and the National Survey of Family Growth (NSFG), a nationally representative sample of reproductive-aged women. NSFG findings have consistently documented sociodemographic differences over three cycles of surveys (1982, 1988, and 1995) (18,19,25). In addition, the NSFG surveys have reported higher levels of unintended pregnancy among women at the end of their reproductive years, findings that were not observed in the PRAMS data (18,25,26). Differences in these findings might be attributable to a different categorization of age groups (>40 years versus >35 years) or to the inclusion of induced abortions in NSFG reports of unintended pregnancy. Late or No Entry into Prenatal CareBecause of the potential to improve the health of mothers and infants, the American College of Obstetricians and Gynecologists and the American Academy of Pediatrics recommend that all pregnant women receive early (i.e., in the first trimester) and regular prenatal care visits (21). Late or no entry into prenatal care precludes the opportunity for early risk assessment and health promotion activities (22). The prevalence of late or no entry into prenatal care ranged from 16.1% to 29.9% among the 17 states. Although from 1993 to 1999, seven states indicated positive trends toward increasing use of prenatal care in the first trimester, none of the states appear likely to meet the Healthy People objective for at least 90% of pregnant women to begin prenatal care in the first trimester. The same target has been set for the Healthy People 2010 objective (9,24). In addition to monitoring progress toward the Healthy People objectives, states can use these data to address the needs assessment feature of the Title V Block Grant Measurement Performance System, which includes a national core performance measure for entry into prenatal care in the first trimester (10). PRAMS data indicate that the likelihood of beginning prenatal care during the first trimester varies by sociodemographic characteristic. Consistent differences were observed across the majority of states for age, race, education, and Medicaid status. These findings are consistent with other studies on sociodemographic differences in the timing of entry into prenatal care (4,27,28). The observed differences between subgroups might reflect differential access to health-care services and differences in health insurance coverage. Smoking During the Last 3 Months of PregnancyCigarette smoking during pregnancy contributes to multiple adverse outcomes, including spontaneous abortion, ectopic pregnancy, stillbirth, fetal death, low birthweight, preterm delivery, intrauterine growth retardation, placenta previa, abruptio placenta, and preterm premature rupture of the membranes (9,29--31). In utero exposure to tobacco smoke might result in adverse consequences during infancy and early childhood as well. For example, infants whose mothers smoke during pregnancy are at increased risk of SIDS (5,7). The Healthy People 2000 objective for tobacco use during pregnancy was established for no more than 10%, and the Healthy People 2010 objective was set for no more than 1% (9,24). Two states (Florida and Utah) met the Healthy People 2000 objective in 1999. A substantial variation in the prevalence of smoking during the last 3 months of pregnancy occurred across the states (range: 6.2% [Utah] to 27.2% [West Virginia]). Five states reported significant decreases in the prevalence of smoking during the reporting period. National estimates of rates of smoking during pregnancy have declined (1,32); however, the rate of smoking cessation during pregnancy is on the decline. Whereas 39% of women quit smoking during their pregnancies in 1985, only 31% of women quit smoking during their pregnancies in 1991, and 14% of women quit smoking during the first trimester in 1998 (9,33). These data suggest that the declines in smoking during the last 3 months of pregnancy might be attributable to an overall decline in smoking rates among reproductive-aged women rather than to an increase in smoking cessation during pregnancy. PRAMS findings and other studies indicate that smoking during pregnancy varies by age, education, Medicaid status, race, and Hispanic ethnicity (30,32,34). The patterns of cigarette smoking are similar for pregnant and nonpregnant women (2). Thus, identification of nonpregnant as well as pregnant smokers provides an opportunity to reduce smoking rates during pregnancy. Because effective interventions do exist and many women (in particular, those who are pregnant) have regular contact with health-care providers, physicians should obtain a smoking history from all patients and provide smokers with counseling and/or referrals to smoking cessation programs (2,21). As expected, based on previous studies regarding the association between smoking and low birthweight, women who delivered low birthweight infants were more likely to smoke than women who delivered normal birthweight infants in all states. In addition, statistically significant differences were observed in a majority of the states (1,29,30,35). Physical Abuse During PregnancyPhysical abuse against women has gained attention as an important public health problem. The Healthy People 2000 and Healthy People 2010 objectives both address this concern; the Healthy People 2010 objectives identify as a priority physical abuse by current or former intimate partners (9). The American College of Obstetricians and Gynecologists and other professional associations recommend that physicians screen patients for physical abuse and refer them to appropriate community, social, and legal resources (36,37). Physical abuse during pregnancy might cause maternal and infant morbidity (38--40), and prenatal care visits provide an opportunity for intervention that might not otherwise exist (41). In some PRAMS states, child abuse reporting laws apply to the project staff. These states either omit the abuse questions from surveys sent to minors (Illinois and Oklahoma) or include a statement in the informed consent letter that abuse to minors must be reported (Florida, North Carolina, Ohio, and South Carolina). In either case, the true prevalence of physical abuse against pregnant women is likely to be underestimated in these states. Data for the physical abuse indicator were available from 1996 to 1999. No trends occurred in any of the states during this period, which might be partially attributable to a lack of sufficient statistical power to detect changes in estimates that are low. Although not statistically significant, a meaningful though moderate decline is possibly occurring in the prevalence of physical abuse during pregnancy in the three states with the highest reported levels of abuse at the beginning of the period. PRAMS data on the prevalence of physical abuse during pregnancy are similar to previous findings (42). However, when examined by sociodemographic characteristic, some differences were observed. Only Medicaid status was consistently associated with physical abuse during pregnancy across the 17 states. Previous research has demonstrated associations between physical abuse during pregnancy and young age, nonwhite race, less education, and low income (39,43,44). For these associations, PRAMS data provided clear support only for income, for which Medicaid was a proxy. Breast-Feeding Initiation and ContinuationBreast-feeding is promoted by the American Academy of Pediatrics, the Special Supplemental Nutrition Program for Women, Infants, and Children (WIC), and other authorities as the single best way to feed infants (45--47). Breast-feeding is associated with several benefits, including a decreased risk of infectious illness and increased cognitive function for the infant and a reduced risk of ovarian cancer and premenopausal breast cancer for the mother (45,48,49). Healthy People 2000 and 2010 objectives include the initiation of breast-feeding (at least 75% of mothers) and duration of breast-feeding (at least 50% of mothers to continue breast-feeding until their babies are aged 5--6 months and at least 25% of mothers to continue breast-feeding until their babies are aged 1 year) (9,24). Breast-feeding initiation varied substantially among the 17 PRAMS states (range: 48%--89%). However, five states (Alaska, Colorado, New Mexico, Utah, and Washington) achieved the Healthy People 2000 objective for at least 75% of women to breast-feed their infants, and trend data demonstrated that breast-feeding initiation increased in 10 of 12 states. Breast-feeding for at least 4 weeks after delivery ranged from 34.9% to 78.1%. In only nine states, at least 50% of women were still breast-feeding at 4 weeks. This percentage is likely to decrease by the time the infant is aged 6 months, resulting in few states achieving the Healthy People 2000 objective for at least 50% of infants to be breast-fed until this age. However, the data do indicate a positive trend in levels of breast-feeding at 4 weeks for 8 of 12 states with at least 3 years of data. Consistent differences were observed across states in levels of breast-feeding initiation; younger women, women with less education, and women receiving Medicaid were less likely to breast-feed. Black women, non-Hispanic women, and women who delivered a low birthweight infant were less likely to initiate breast-feeding in approximately one half of the states. Similar patterns were observed for breast-feeding for at least 4 weeks after delivery, with the exception of race and Hispanic ethnicity. More consistent racial differences occurred in the category of breast-feeding for at least 4 weeks, with black women less likely to breast-feed for at least 4 weeks than white women in two thirds of the states where data were available for black populations. No consistent pattern of differences was observed by Hispanic ethnicity. National data from the 1995 Ross Laboratories Mothers' Survey have reported findings similar to PRAMS. Both surveys indicated a regional difference in breast-feeding; women in the western United States were more likely to breast-feed than those from other regions of the country. Results from Ross Laboratories Mothers' Survey also indicated that the largest gains in breast-feeding occurred among the sociodemographic groups that traditionally had the lowest rates of breast-feeding (50). Back Infant Sleep PositionInfant sleep position has been identified as a modifiable behavior that can reduce the risk for SIDS (51--53). SIDS is the sudden death of an infant aged <1 year, which remains unexplained after a thorough case investigation, including performance of a complete autopsy, examination of the death scene, and review of the clinical history (53). In 1994, the Back to Sleep Campaign was introduced to promote the use of the back sleep position to reduce the incidence of SIDS. Since that time, the use of the prone sleep position has decreased dramatically and has been accompanied by a similar decrease in the rate of SIDS deaths (54). Although mortality from SIDS declined 38% between 1992 and 1996, it remains the leading cause of death during the postneonatal period (54,55). Back sleep position has been identified as a Healthy People 2010 objective, which calls for at least 70% of healthy full-term infants to be put down to sleep on their backs (9). During 1996--1999, significant increasing trends in the use of the back sleep position occurred in all 12 states for which at least 3 years of data were available, and one state (Utah) has already achieved the Healthy People 2010 objective. These trends mirror data from the National Infant Sleep Position Study (56). Patterns in the use of the infant sleep position emerged across the states by race and education. These findings are similar to those from the National Infant Sleep Position Study, which collected data from nighttime caretakers, of whom 80%--85% were the infants' mothers. The study demonstrated differences in back positioning by race, education, and age (57). LimitationsSeveral limitations exist in the data presented in this report. Because data are self-reported 2--8 months after delivery, responses might be subject to recall bias, particularly for behaviors and experiences that occurred early in the pregnancy and also for the subset of women who experienced pregnancy complications or whose infants experienced health problems. Nondisclosure of sensitive information (e.g., physical abuse) might result in underestimates of certain indicators. Because the population for PRAMS is women who delivered live-born infants, findings are not generalizable to women whose pregnancies did not result in a live birth (i.e., induced or spontaneous abortion, or stillbirth). Thus, the prevalence of some of these risk behaviors among all pregnant women might be higher or lower than reported. PRAMS reports only on unintended pregnancy resulting in a live birth and thus under-estimates the prevalence of all unintended pregnancies, of which a significant proportion end in induced abortion. PRAMS provides population-based data for each participating state, and results are not generalizable to other states or to the United States as a whole. Variations across states in the prevalences of these seven behaviors and experiences might be attributable to population differences in sociodemographic characteristics or to variations in the availability of and access to health-care services. This analysis did not attempt to control for potential confounding variables, nor do the associations imply causality. ConclusionOverall, certain sociodemographic groups of women were at increased risk for behaviors associated with adverse health outcomes. Younger women, black women, women with less education, and women who received Medicaid before or during pregnancy were more likely to report participation in the majority of these undesirable behaviors. One important distinction is the prevalence of smoking during the last 3 months of pregnancy. Where differences were observed, white women were more likely than black women to report smoking. Continuing to monitor these and other maternal behaviors and experiences before, during, and after pregnancy is important. The seven indicators reviewed in this report can all be used to assess progress toward the Healthy People 2010 objectives. At the state level, data have been used to measure performance against the national core performance measure of the Title V Block Grant Measurement Performance System on entry into prenatal care. In addition, several states have state-negotiated performance measures on unintended pregnancy, smoking during the last 3 months of pregnancy, physical abuse by a husband or partner during pregnancy, and back sleep position; PRAMS data are used to assess progress toward these measures. Finally, these state-based data have been used to support the development or evaluation of health promotion programs and to direct policy decisions that can affect the health of mothers and babies. For example, several states have secured funding for family planning programs based on the unintended pregnancy data. Other examples include the use of data on cigarette smoking during pregnancy and on prenatal care counseling about the effects of smoking during pregnancy to guide the development of educational programs for health-care providers. The same strategy has been used to promote domestic violence screening in the health-care setting. These and other examples of the dissemination and translation of PRAMS data support the value of state- and population-based surveillance of maternal behaviors and experiences that affect maternal and infant health. AcknowledgmentsThe PRAMS Working Group: Alabama: Rhonda Stephens, MPH; Alaska: Kathy Perham-Hester, MS, MPH; Arkansas: Gina Redford, MAP; Colorado: Darci Cherry, MPH; Delaware: Tony Ruggiero; Florida: Richard Hopkins, MD, MPH; Georgia: Tonya Johnson; Hawaii: Althea Momi Kamau, MPH; Illinois: Bruce Steiner, MA; Louisiana: Joan Wightkin; Maine: Martha Henson; Maryland: Diana Cheng, MD; Michigan: Yasmina Bouraoui, MPH; Minnesota: Cynthia Turnure; Mississippi: Linda Pendleton; Montana: Jo Ann Walsh; Nebraska: Debbi Barnes-Josiah, PhD; New Jersey: Lakota Kruse; New Mexico: Ssu Weng, MD, MPH; New York State: Ann Radigan-Garcia; New York City: Fabienne Laraque, MD; North Carolina: Paul Buescher, PhD; North Dakota: Sandra Anseth; Ohio: Adriana Pust; Oklahoma: Dick Lorenz, MS; Oregon: Ken Rosenberg, MD, MPH; Rhode Island: Sam Viner-Brown; South Carolina: Kristen Helms, MSPH; Texas: Kamila Bajwa-Mistry; Utah: Lois Bloebaum; Vermont: Peggy Brozicevic; Washington: Linda Lohdefinck; West Virginia: Melissa Baker, MA; CDC PRAMS Team, Program Services and Development Branch, Division of Reproductive Health, National Center for Chronic Disease Prevention and Health Promotion. References
Table 1 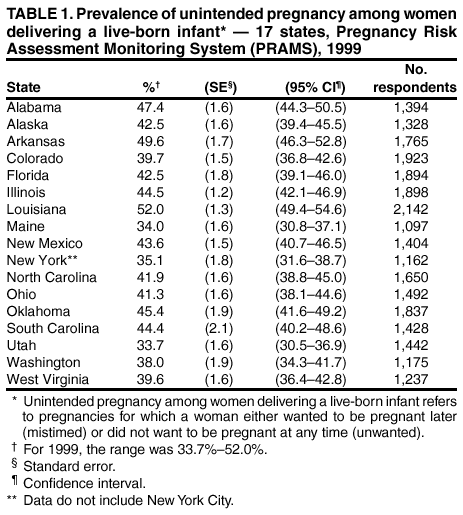 Return to top. Figure 1 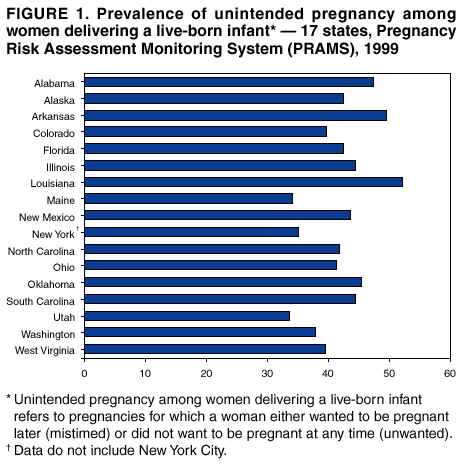 Return to top. Table 2 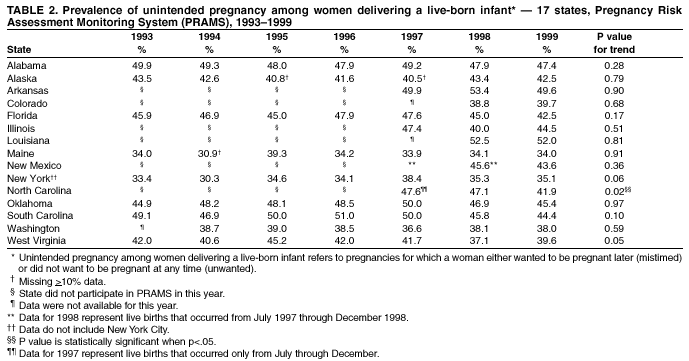 Return to top. Figure 2 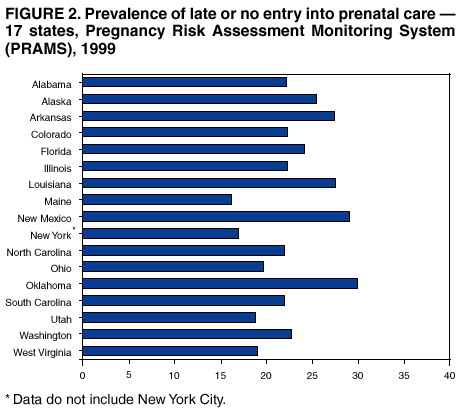 Return to top. Table 3 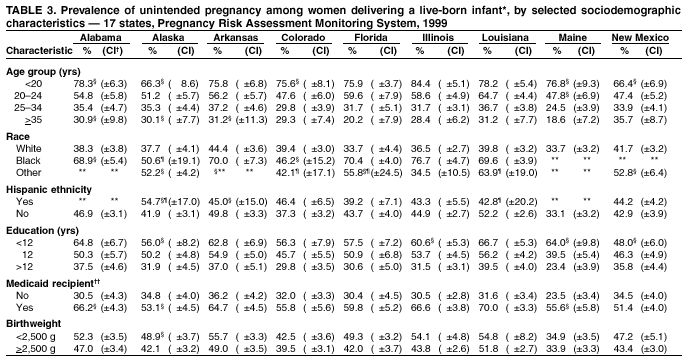 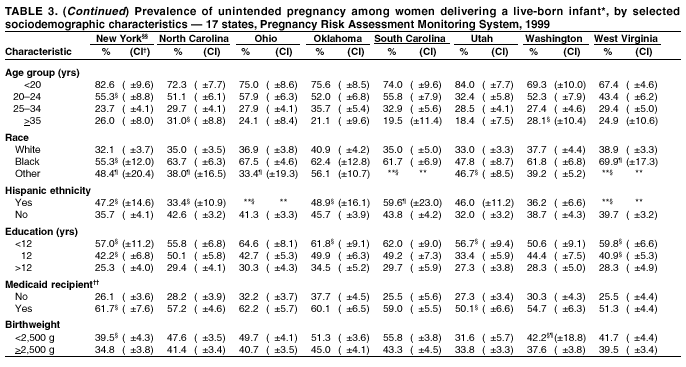  Return to top. Figure 3 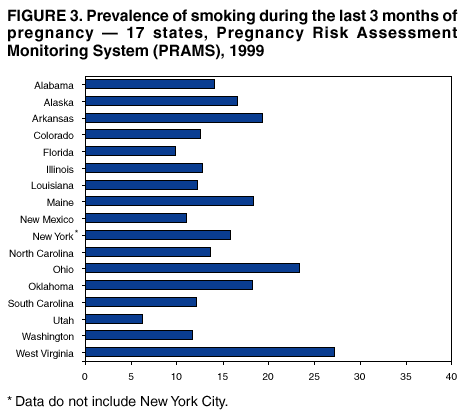 Return to top. Table 4 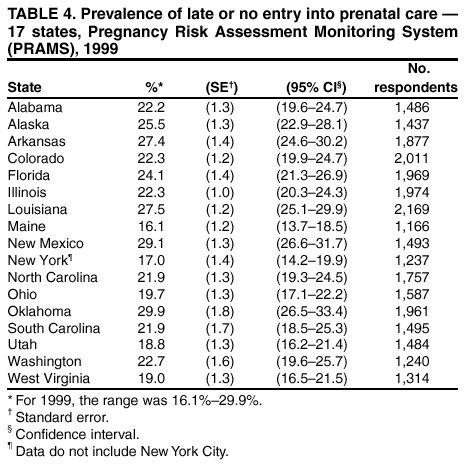 Return to top. Figure 4 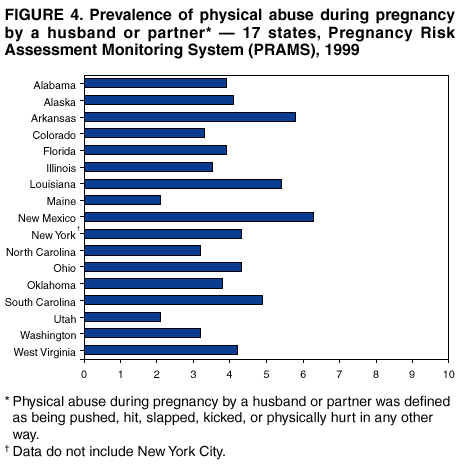 Return to top. Table 5 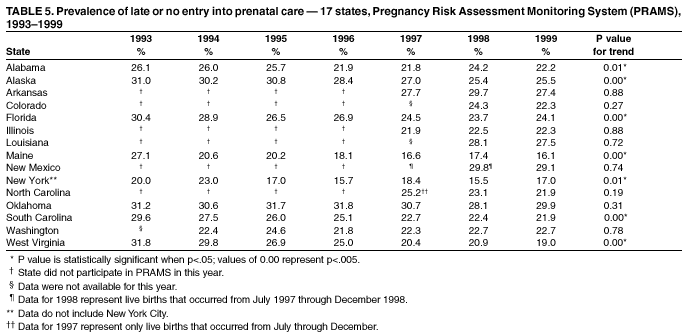 Return to top. Figure 5 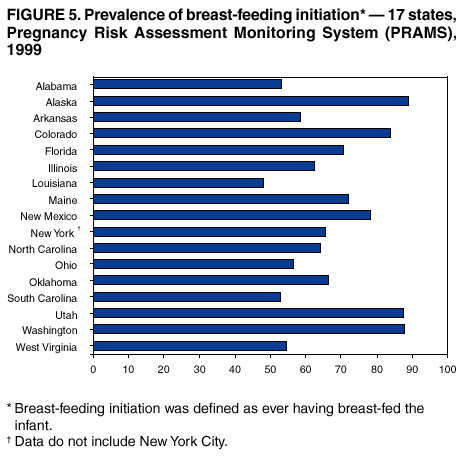 Return to top. Table 6 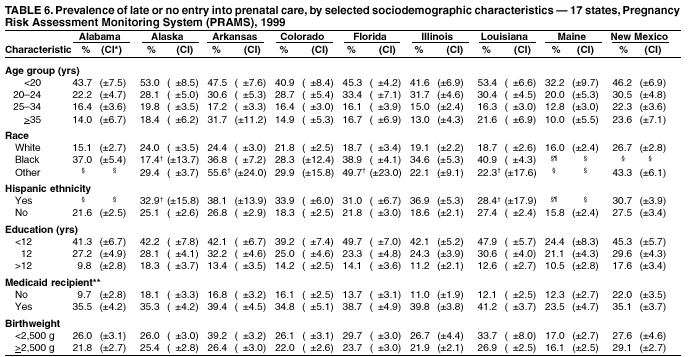 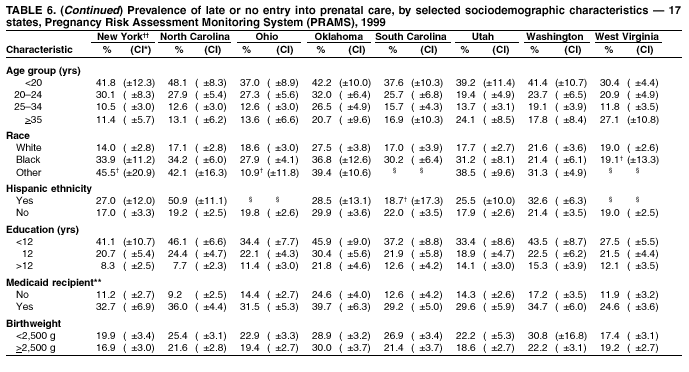  Return to top. Figure 6 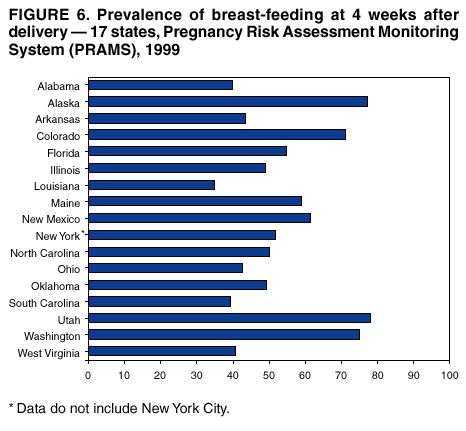 Return to top. Table 7 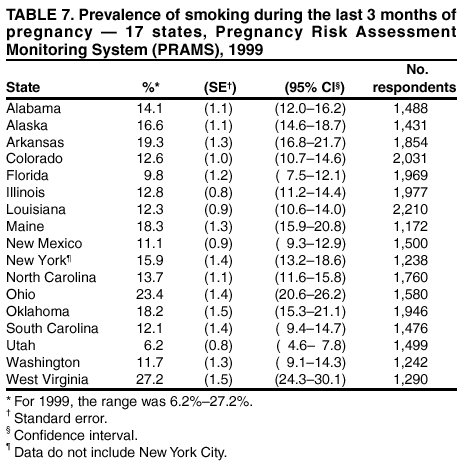 Return to top. Figure 7 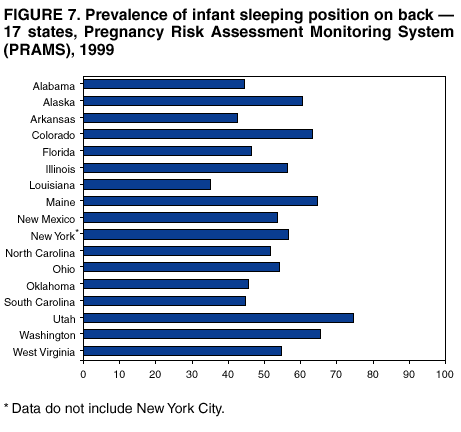 Return to top. Table 8 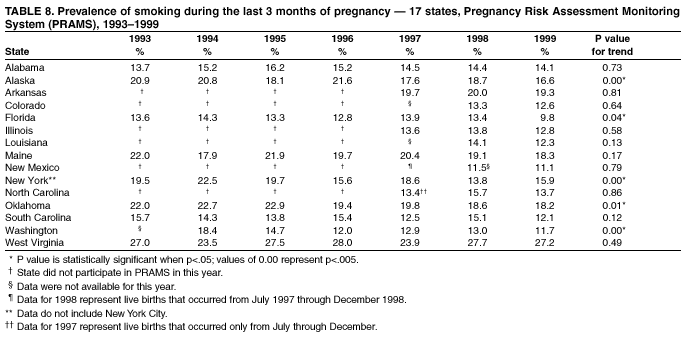 Return to top. Table 9 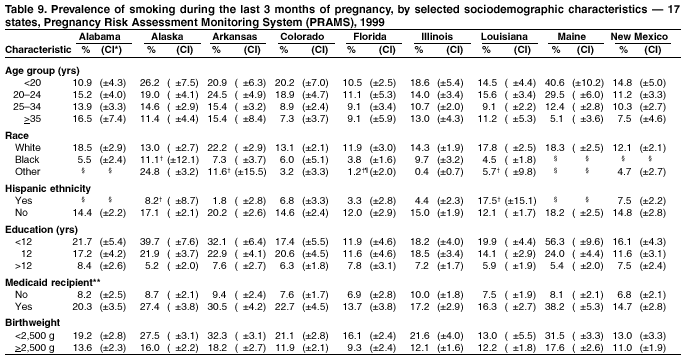 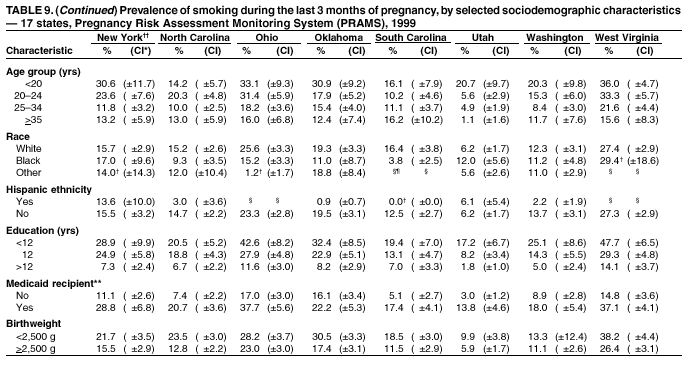 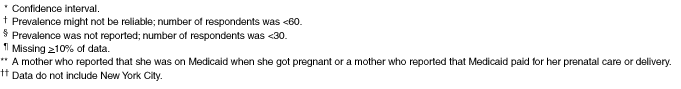 Return to top. Table 10 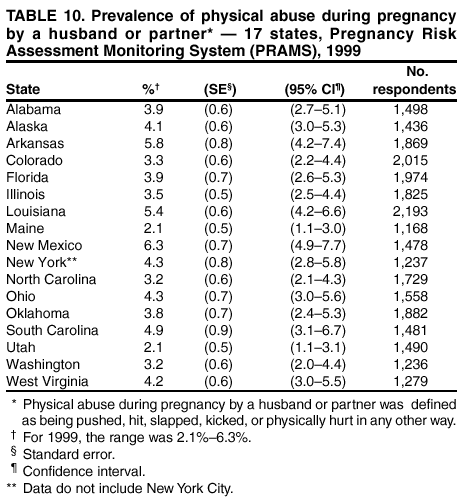 Return to top. Table 11  Return to top. Table 12 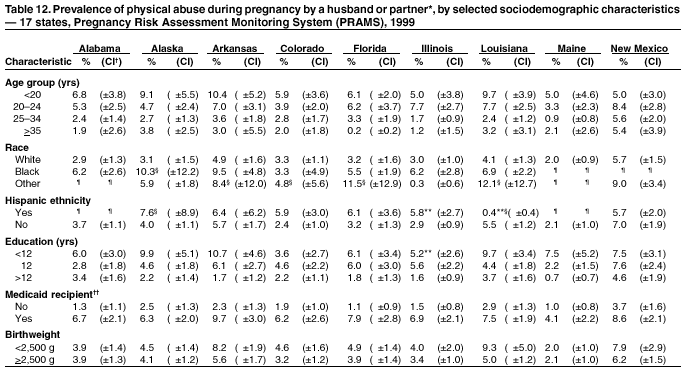 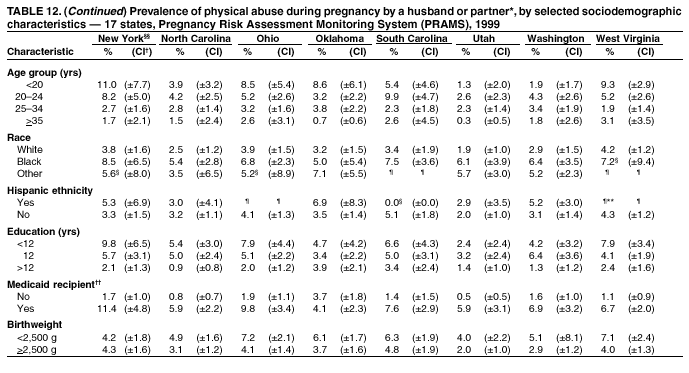  Return to top. Table 13 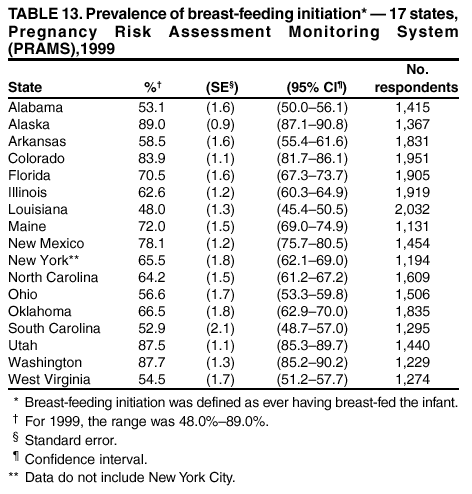 Return to top. Table 14 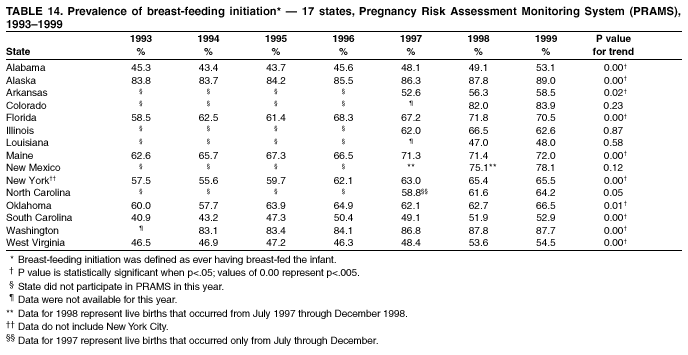 Return to top. Table 15 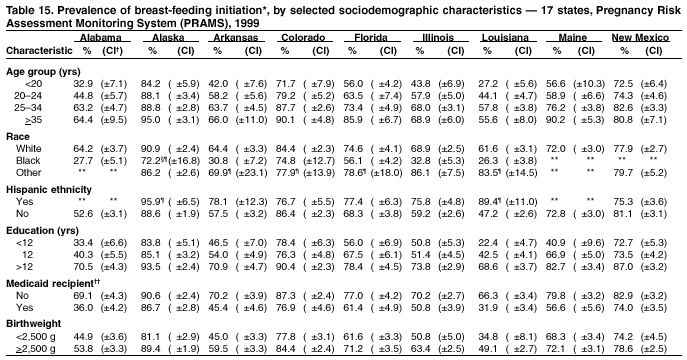 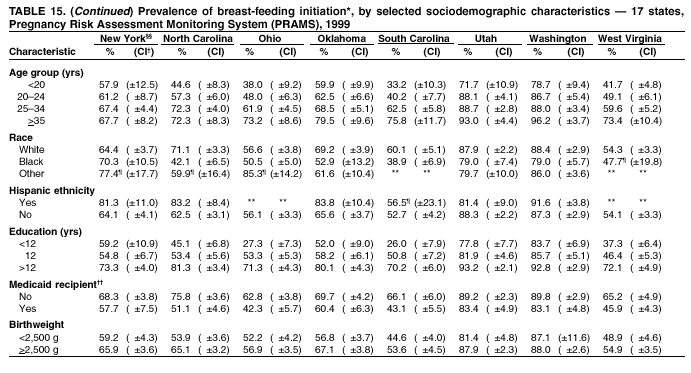 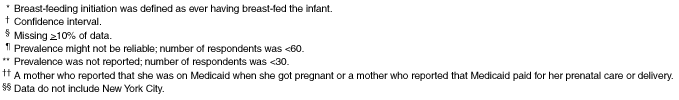 Return to top. Table 16 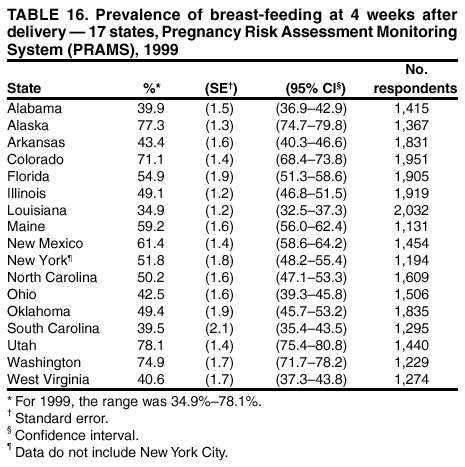 Return to top. Table 17 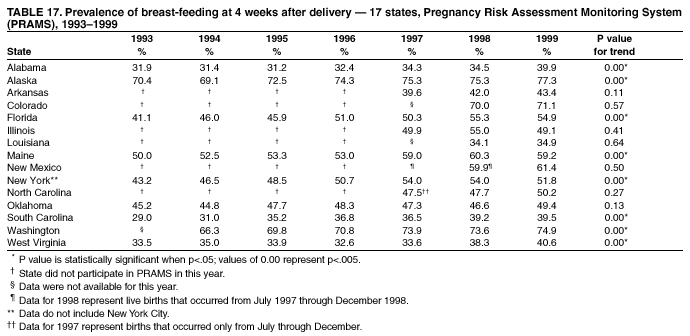 Return to top. Table 18 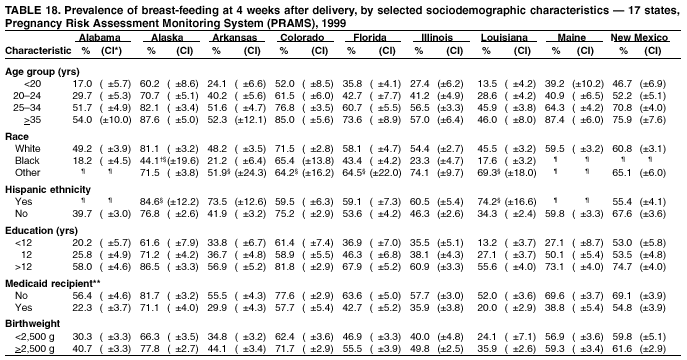 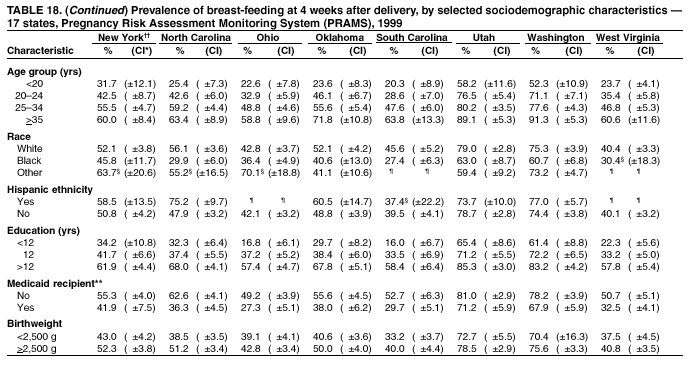  Return to top. Table 19 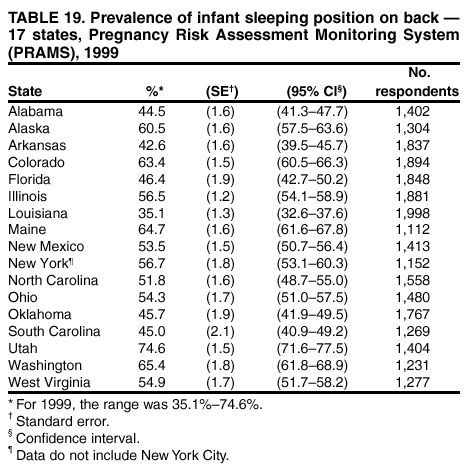 Return to top. Table 20 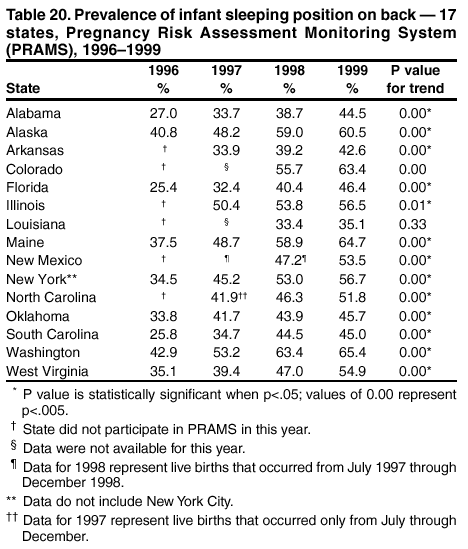 Return to top. Table 21 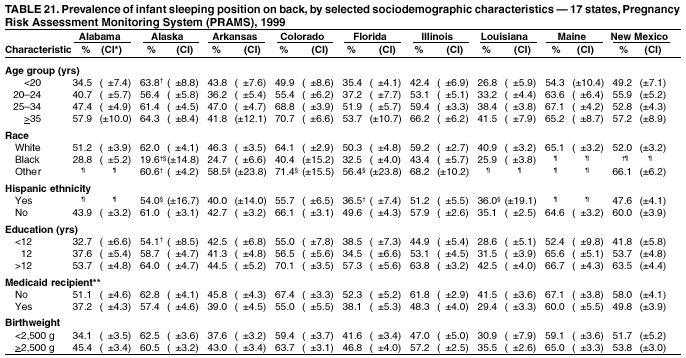 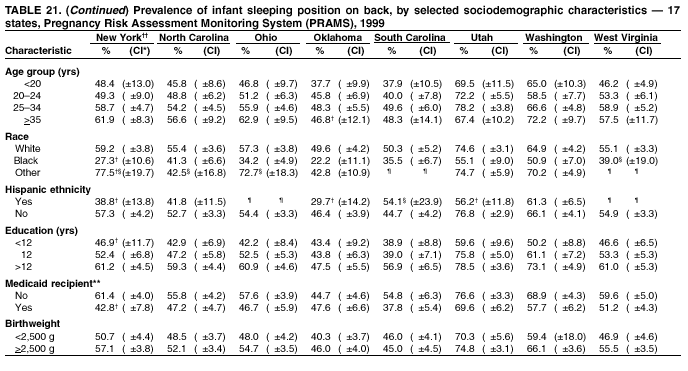  Return to top.
Disclaimer All MMWR HTML versions of articles are electronic conversions from ASCII text into HTML. This conversion may have resulted in character translation or format errors in the HTML version. Users should not rely on this HTML document, but are referred to the electronic PDF version and/or the original MMWR paper copy for the official text, figures, and tables. An original paper copy of this issue can be obtained from the Superintendent of Documents, U.S. Government Printing Office (GPO), Washington, DC 20402-9371; telephone: (202) 512-1800. Contact GPO for current prices. **Questions or messages regarding errors in formatting should be addressed to mmwrq@cdc.gov.Page converted: 4/18/2002 |
|||||||||
This page last reviewed 4/18/2002
|