|
|
|
|
|
|
|
| ||||||||||
|
|
|
|
|
|
|
||||
| ||||||||||
|
|
|
|
|
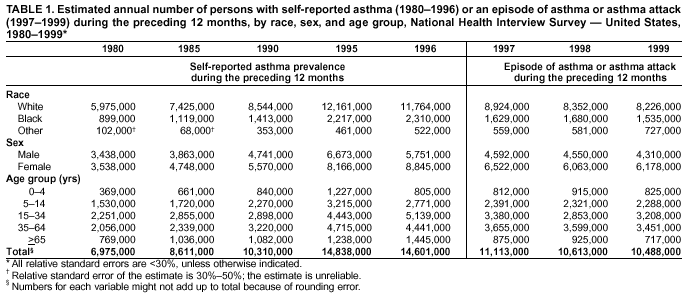
Persons using assistive technology might not be able to fully access information in this file. For assistance, please send e-mail to: mmwrq@cdc.gov. Type 508 Accommodation and the title of the report in the subject line of e-mail. Surveillance for Asthma --- United States, 1980--1999David M. Mannino, M.D. Abstract Problem/Condition: Asthma, a chronic disease occurring among both children and adults, has been the focus of clinical and public health interventions during recent years. In addition, CDC has outlined a strategy to improve the timeliness and geographic specificity of asthma surveillance as part of a comprehensive public health approach to asthma surveillance. Reporting Period Covered: This report presents national data regarding self-reported asthma prevalence, school and work days lost because of asthma, and asthma-associated activity limitations (1980--1996); asthma-associated outpatient visits, asthma-associated hospitalizations, and asthma-associated deaths (1980--1999); asthma-associated emergency department visits (1992--1999); and self-reported asthma episodes or attacks (1997--1999). Description of Systems: CDC's National Center for Health Statistics (NCHS) conducts the National Health Interview Survey annually, which includes questions regarding asthma and asthma-related activity limitations. NCHS collects physician office-visit data in the National Ambulatory Medical Care Survey, emergency department and hospital outpatient data in the National Hospital Ambulatory Medical Care Survey, hospitalization data in the National Hospital Discharge Survey, and death data in the Mortality Component of the National Vital Statistics System. Results: During 1980--1996, asthma prevalence increased. Annual rates of persons reporting asthma episodes or attacks, measured during 1997--1999, were lower than the previously reported asthma prevalence rates, whereas the rates of lifetime asthma, also measured during 1997--1999, were higher than the previously reported rates. Since 1980, the proportion of children and adults with asthma who report activity limitation has remained stable. Since 1995, the rate of outpatient visits and emergency department visits for asthma increased, whereas the rates of hospitalization and death decreased. Blacks continue to have higher rates of asthma emergency department visits, hospitalizations, and deaths than do whites. Interpretation: Since the previous report in 1998 (CDC. Surveillance for Asthma --- United States, 1960--1995. MMWR 1998;47[No. SS-1]:1--28), changes in asthma-associated morbidity and death have been limited. Asthma remains a critical clinical and public health problem. Although data in this report indicate certain early indications of success in current asthma intervention programs (e.g., limited decreases in asthma hospitalization and death rates), the continued presence of substantial racial disparities in these asthma endpoints highlights the need for continued surveillance and targeted interventions. IntroductionAsthma is a prevalent chronic illness in the United States that has been increasing in prevalence since 1980 (1). During 1991--2001, the problem of asthma has been the focus of programs and reports from governmental agencies (e.g., the National Heart Lung and Blood Institute's National Asthma Education and Prevention Program [NAEPP] [2] and the U.S. Department of Health and Human Services' Action Against Asthma report [3]) and nongovernmental commissions (e.g., the Pew Environmental Health Commission's Attack Asthma report [4]). A common feature of these reports and programs is a call for improved asthma surveillance. Asthma is a key component of the Healthy People 2010 objectives (5). Eight objectives address asthma: 24-1, reduce asthma deaths; 24-2, reduce hospitalizations for asthma; 24-3, reduce hospital emergency department visits for asthma; 24-4, reduce activity limitations among persons with asthma; 24-5, reduce the number of school or work days missed by persons with asthma because of their asthma; 24-6, increase the proportion of persons with asthma who receive formal patient education, including information regarding community and self-help resources, as an essential part of the management of their condition; 24-7, increase the proportion of persons with asthma who receive appropriate asthma care according to the NAEPP guidelines; and 24-8, establish in >25 states a surveillance system for tracking asthma deaths, illnesses, disabilities, impact of occupational and environmental factors on asthma, access to medical care, and asthma management (5). In 1998, CDC reported on the morbidity and mortality related to asthma for 1960--1995 (1). The findings from that report included increasing trends of asthma prevalence and mortality, as well as racial and regional disparities in asthma emergency department visits, asthma hospitalizations, and asthma deaths. In addition, CDC outlined a strategy to improve the timeliness and geographic specificity of asthma surveillance as part of a comprehensive public health approach to asthma. Since the publication of the 1998 report, which included data through 1995, progress has been made in implementing this surveillance strategy. This report presents national data regarding self-reported asthma prevalence, school and work days lost because of asthma, and asthma-associated activity limitations (1980--1996); asthma-associated outpatient visits, asthma-associated hospitalizations, and asthma-associated deaths (1980--1999); asthma-associated emergency department visits (1992--1999); and self-reported asthma episodes or attacks (1997--1999). This report also describes progress made toward developing and improving surveillance for asthma at the state and local level. MethodsWe used data from national health surveys conducted by CDC's National Center for Health Statistics (NCHS) to measure asthma prevalence, asthma episodes or attacks, asthma-associated school and work absence days, asthma-associated activity limitation, asthma physician office and hospital outpatient department visits, asthma emergency department visits, asthma hospitalizations, and asthma deaths nationally. For the latter three measures, we determined rates in four regions of the United States,* which are geographic divisions defined by the U.S. Bureau of the Census (Figure 1). We used population estimates from the U.S. Bureau of the Census as denominators for asthma office-visit rates, asthma emergency department visits, asthma hospitalizations, and asthma deaths. We used the civilian, noninstitionalized population of the United States as our denominator for prevalence rates and asthma episode or attack rates. We stratified each population denominator data set by region, sex, race (white, black, and other), and age group (0--4 years, 5--14 years, 15--34 years, 35--64 years, and >65 years). For determination of asthma-associated activity limitation and asthma-associated school absence or work loss, we used two age strata, 5--17 years and >18 years. In this report, we list annual estimates in the tables for selected years (i.e., 1980, 1985, 1990, and 1995--1999) and annual estimates for 1980--1999 in the figures for every measure except asthma-associated activity limitation, school absence, and work loss. For those estimates, we had to group years because the denominator (i.e., persons with asthma) in the surveys was smaller. Our results were age-adjusted to the 2000 U.S. population by using five age groups (i.e. 0--4 years, 5--14 years, 15--34 years, 35--64 years, and >65 years). Regional emergency department data and death data were age-, sex- and race-adjusted. We analyzed all data by using SAS (version 6) (6) and SUDAAN (version 7.5) (7). We used two-tailed t-tests to determine whether the differences between two points in time in asthma prevalence rates, asthma physician office-visit and hospital outpatient department rates, asthma emergency department visit rates, asthma hospitalization rates, and asthma death rates were statistically significant. We used two-tailed t-tests to compare asthma hospitalization rates and asthma emergency department visit rates between regions, racial groups, age groups, and males and females. By using the Bonferroni adjustment technique for multiple comparisons in <5 groups, we considered a familywide p-value of 0.05 as statistically significant. Prevalence and Attacks or EpisodesNCHS conducts the National Health Interview Survey (NHIS) annually among a probability sample of the civilian, noninstitutionalized population of the United States (8). Before 1997, for one-sixth of the NHIS-sampled households (i.e., approximately 20,000 of 120,000 persons), participants were asked whether they had any one of 17 chronic respiratory conditions, including asthma, during the preceding 12 months. Under this design, information regarding asthma among adults might not have been reported by the subjects themselves. For children aged <18 years, a knowledgeable adult family member, usually a parent, acted as a proxy respondent. Asthma prevalence was determined if a positive response was given to the following question: "During the past 12 months, have you had asthma?" Starting in 1997, NHIS collected information regarding asthma for a randomly selected sample child (i.e., by using a proxy respondent) in every household having a child and for a randomly selected adult in each household. Asthma attacks or episodes in the previous year were determined if positive responses were given to the following questions: "Has a doctor or other health professional ever told you that you had asthma?" and "During the past 12 months, have you had an episode of asthma or an asthma attack?" (8,9). We used SUDAAN to determine relative standard errors (RSEs) of the estimates and indicate which estimates had RSEs of <30%, indicating relatively high reliability (7). School and Work Absence Days and Activity LimitationThrough 1996, NHIS provided data regarding days of school and work missed and activity limitations resulting from specific conditions. The number of asthma-associated school absence days in the previous 2 weeks was collected for children aged 6--16 years during 1980--1982, and for those aged 5--17 years during 1985--1996. The number of asthma-associated work absence days for the previous 2 weeks was collected for persons aged >17 years in 1980--1982 and >18 years for 1985--1996. Because NHIS is conducted continuously throughout the year, no seasonal bias exists in the 2-week recall period when that period information is aggregated for the entire annual sample. Survey weights were used to aggregate the number of absence days reported in the 2-week recall period during a 1-year period. We calculated the rate of absence days per person-asthma--year (i.e., person-year among all persons with asthma) and the percentage of those with asthma who had >1 absence days in the previous 2 weeks. Because of the relatively limited number of persons reporting absence days in the previous 2 weeks for each survey year, we used multiple years of data to obtain stable estimates for absence days. Activity limitation questions measured ability to perform age-appropriate activities. The percentage of persons with asthma who reported asthma-associated activity limitation was calculated for children aged 5--17 years and adults aged >18 years who reported being currently employed. Activity limitations were classified into one of four groups: all major activity was limited; certain major activities were limited; other activities were limited; or no activities were limited. For children aged 5--17 years, major activity was defined as school attendance, and for employed adults aged >18 years, as working. Respondents were categorized as limited if they reported limitations in major or other activities and if asthma was identified as the primary or secondary cause of the limitation. Physician Office Visits, Hospital Outpatient Department Visits, and Emergency Department VisitsAmbulatory medical care is the predominant means of providing health-care services in the United States. In this report, we consider both physician office visits and hospital outpatient department visits, the data for which are collected by using different surveys, as office visits; we consider emergency department visits separately. Physician office-visit data were collected through the National Ambulatory Medical Care Survey (NAMCS), which NCHS administered in 1973--1981, 1985, and annually since 1989 (10). Approximately 2,000 physicians participated each year, reporting data regarding approximately 30,000 patient encounters. Hospital outpatient department visit data and emergency department visit data were collected by using the National Hospital Ambulatory Medical Care Survey (NHAMCS), which has been administered annually since 1992 (11). Approximately 500 hospitals are sampled each year, resulting in approximately 30,000 outpatient department encounters and 30,000 emergency department encounters. For both data sets, we identified all patient visits for which asthma (International Classification of Diseases, 9th Revision, code 493) (12) was the first listed diagnosis. Sample weights were used to obtain national estimates of annual outpatient (i.e., physician office and hospital outpatient department) visits and emergency department visits for asthma. We used the RSEs, which are listed with the database documentation, to determine which estimates had RSEs of <30%, indicating relatively high reliability (13). HospitalizationsThe National Hospital Discharge Survey (NHDS), conducted annually by NCHS since 1965, is a national survey of approximately 275,000 patient records from approximately 500 nonfederal general and short-stay specialty hospitals. A hospitalization for asthma was defined as a primary discharge diagnosis of asthma (ICD-9 code 493) (12). Race was missing for 5%--20% of the sample in any given year (14). We excluded these persons from the race-specific rate calculations but included them in all of the other rate calculations. We used published relative standard errors (13) to indicate which estimates had RSEs of <30%, indicating relatively high reliability. MortalityThe Mortality Component of the National Vital Statistics System includes medical conditions and demographic characteristics reported on death certificates (15). We searched for deaths for which asthma was the underlying cause of death (ICD-9 code 493 for 1980--1998 and ICD-10 codes J45--J46 for 1999), (12,16) and calculated standard errors (i.e., the square root of the inverse of the number of deaths) because the number of asthma deaths is limited and annual rates are subject to random variation. The comparability ratio for asthma from ICD-9 to ICD-10 is 0.89, which means that 89% of the deaths classified as being caused by asthma under the ICD-9 classification would be classified as asthma deaths under the ICD-10 classification (15). ResultsPrevalence and Episodes or AttacksThe self- or proxy-reported 12-month prevalence of asthma increased 73.9% during 1980--1996, with an estimated 14.6 million persons (54.6/1,000 population) reporting asthma during the previous 12 months in 1996 (Table 1; Figure 2). Beginning in 1997, the asthma questions on NHIS changed the measures of asthma prevalence (9). Now, two measures are used, both restricted to persons with a medical diagnosis of asthma. The first is referred to as lifetime asthma prevalence, which includes those respondents with a medical diagnosis of asthma at anytime in the their lives. In 1997, a total of 26.7 million persons (96.6/1,000 population) reported a physician diagnosis of asthma during their lifetime, which is substantially higher than the 12-month prevalence measured before 1997 (Figure 2). The second measure is a 12-month attack prevalence, which includes the number of persons with asthma who have had >1 attacks or episodes in the past 12 months. In 1997, the estimated prevalence of persons with asthma episodes or attacks was 11.1 million (40.7/1,000 population), lower than the 12-month prevalence estimated from the question wording used before 1997 (Tables 1,2; Figure 2). A sufficient number of years with the new measures do not yet exist to determine whether the trends in asthma are increasing or decreasing. Both 12-month prevalence (before 1997) and 12-month attack prevalence of asthma (since 1997) were higher among children aged 5--14 years, blacks compared with whites, and females. Neither 12-month prevalence nor episodes or attacks of asthma varied substantially among regions of the United States (data not indicated). Absence Days and Activity LimitationSchool absence days among children and work absence days among adults increased from 1980--82 to 1995--96 (Table 3). During 1980--1996, rates of school absence per child with asthma per year and the percentage of children with asthma who had limited activity because of asthma decreased slightly (4.9%--3.7%). Also not statistically significant, the percentage of children missing >1 days of school in the previous 2 weeks decreased during the same period. Work absence days among adults with asthma demonstrated similar trends to school absence days among children with asthma, except the percentage of adults missing >1 days of work because of asthma in the previous 2 weeks increased slightly during 1990--1996, although the change was not statistically significant. Physician Office and Hospital Outpatient Department VisitsDuring 1980--1999, the number of office visits for asthma as the primary diagnosis increased from 5.9 million to 10.8 million (Table 4; Figure 3). During 1992--1999, this estimate included both physician office visits and hospital outpatient department visits, with the latter category including approximately 1 million visits annually. The demographic pattern in rates of office visits for asthma demonstrated higher rates among blacks, females, and children (Table 5). Office-visit rates did not vary among regions of the country (these data not included in Table 5). Emergency Department VisitsDuring 1992--1999, the number of emergency department visits for asthma increased 36%, varying by region, and the rate of emergency department visits for asthma increased 29% (Tables 6,7; Figure 4). The rates for blacks were >3 times the rates for whites, and the youngest children consistently had the highest rates (Table 7). HospitalizationsThe hospitalization rate for asthma peaked in the mid-1980s and has gradually declined since then (Tables 8,9; Figure 5). The substantial regional differences that were previously described (1) have persisted, as did higher rates among blacks, women, and children. DeathsThe number of deaths and death rates from asthma increased gradually during 1980--1995 (Tables 10,11; Figure 6). Although a determination with certainty cannot be made, data for 1996--1998 indicate that mortality rates are starting to plateau or decrease. The data from 1999 cannot be directly compared with the data from previous years because of the change in the classification system from ICD-9 to ICD-10 (13). As noted in the previous report, disparities persist, with higher mortality rates documented among blacks, women, and the elderly, along with regional differences (Figure 6). DiscussionThe trend of increasing asthma-associated morbidity and mortality that occurred during 1980--1995 (1) has not continued for all measures. During 1995--1998, the rate of both physician office or hospital outpatient visits and emergency department visits for asthma increased, whereas the rate of hospitalization and death decreased. Blacks continued to have higher rates of asthma emergency department visits, hospitalizations, and deaths than did whites. Although 12-month asthma prevalence increased during 1980--1996, annual rates of asthma episodes or attacks among persons with a medical diagnosis of asthma, measured during 1997--1999, are lower than the 12-month asthma prevalence determined previously. The corresponding measures of lifetime asthma prevalence, also measured during 1997--1999, were higher than the 12-month asthma prevalence. New in this report is the estimated morbidity of asthma as determined by missed days of school and work. During 1980--1996, the number of asthma-associated work absence days and school absence days caused by asthma have increased >50%, from 6.2 to 14.0 million for work absence days and from 6.6 to 14.0 million for school absence days. This corresponds to the increase in prevalence, because the school absence days per child with asthma and the work absence days per adult with asthma have not changed during this period. The data in this report are useful for health departments and researchers as a comparison with the morbidity and mortality attributable to asthma among the populations they study. Populations with asthma morbidity higher than the national values might require targeted intervention programs. Although these data address Healthy People 2010 goals, certain ones (e.g., objective 24-6, increase the proportion of persons with asthma who receive formal patient education, including information regarding community and self-help resources, as an essential part of the management of their condition and objective 24-7, increase the proportion of persons with asthma who receive appropriate asthma care [5], according to the NAEPP guidelines) will require different surveys. In our previous report, we noted such limitations as a lack of data (other than death data) at the state or local level and the timeliness of these data. Although these barriers still exist, progress is being made. In 2000, the Behavioral Risk Factor Surveillance System (BRFSS), an ongoing random-digit--dialed telephone survey used in all 50 states, the District of Columbia, Guam, Puerto Rico, and the Virgin Islands, added two questions regarding asthma prevalence to the core survey. These data indicate variation in prevalence among the participating sites. Lifetime asthma prevalence varied from a low of 8.0% in Louisiana to a high of 15.9% in Puerto Rico. Current asthma prevalence varied from a low of 5.0% in Louisiana to a high of 8.9% in Maine (17). In addition, local health departments have been successful in using existing data to determine patterns in asthma morbidity and, subsequently, target interventions (18). New methods are being developed for asthma surveillance, including determining incident cases of asthma by using such sites as emergency departments to capture information regarding persons with asthma and to gain a better understanding of the factors related to asthma deaths (4). In 2000, CDC funded a program to implement asthma surveillance and interventions in hospital emergency departments and to evaluate the surveillance and effectiveness of these interventions in reducing subsequent asthma hospitalizations and emergency department visits. Michigan State University and the University of South Carolina have been awarded cooperative agreements for a 3-year period to work with selected hospital emergency departments serving diverse populations. A second CDC initiative begins planning for population-based surveillance for asthma incidence. Asthma surveillance sites will be population-based centers designed to assess the public health impact of asthma, to determine asthma incidence, and to identify population-based risk factors associated with asthma onset. A third CDC initiative demonstrates the feasibility of a rapid asthma death notification system among persons aged 2--34 years. This will include investigations of the asthma-associated deaths identified and will describe the circumstances of these deaths to determine whether and how such deaths could have been prevented. Diagnosing asthma remains challenging. Although the clinical definition of asthma is the presence of variable airflow obstruction that reverses either spontaneously or with treatment, differentiating asthma from other chronic obstructive lung diseases remains difficult, chiefly among preschool and older adult populations. Using surveys (e.g., those in this report) has additional limitations. For example, the majority of the asthma estimates contained in this report are dependent on physicians accurately diagnosing and documenting asthma in patient records, with the potential for either underestimates or overestimates of cases. Estimates of asthma prevalence, in addition, require the subjects to recall the physician's diagnosis and are subject to similar biases. The Council of State and Territorial Epidemiologists has developed a case definition for asthma for use in epidemiologic studies of asthma and asthma surveillance that provides definition uniformity (19). Asthma remains a key public health problem in the United States. This report does not indicate dramatic changes in asthma morbidity or mortality since our 1998 report (1), although the downward trend in asthma hospitalizations and asthma mortality might indicate early successes by asthma intervention programs since 1991 (2). A gradual but consistent upward trend occurred in 12-month asthma prevalence during 1980--1996; however, the major changes in question wording in 1997 make forming conclusions regarding the trend since that time impossible. Although a numeric increase has occurred in the numbers and rates of physician office or hospital outpatient department visits and emergency department visits, these increases are accounted for by the increase in prevalence. Opportunities to improve our understanding of this disease and decrease its substantial morbidity in the United States remain. Public health programs must continue to provide scientifically validated programs to improve provider and patient adherence to published guidelines for treating asthma. References
* Northeast: Connecticut, Maine, Massachusetts, New Hampshire, New Jersey, New York, Pennsylvania, Rhode Island, and Vermont. Midwest: Illinois, Indiana, Iowa, Kansas, Michigan, Minnesota, Missouri, Nebraska, North Dakota, Ohio, South Dakota, and Wisconsin. South: Alabama, Arkansas, Delaware, District of Columbia, Florida, Georgia, Kentucky, Louisiana, Maryland, Mississippi, North Carolina, Oklahoma, South Carolina, Tennessee, Texas, Virginia, and West Virginia. West: Alaska, Arizona, California, Colorado, Hawaii, Idaho, Montana, Nevada, New Mexico, Oregon, Utah, Washington, and Wyoming.
Disclaimer All MMWR HTML versions of articles are electronic conversions from ASCII text into HTML. This conversion may have resulted in character translation or format errors in the HTML version. Users should not rely on this HTML document, but are referred to the electronic PDF version and/or the original MMWR paper copy for the official text, figures, and tables. An original paper copy of this issue can be obtained from the Superintendent of Documents, U.S. Government Printing Office (GPO), Washington, DC 20402-9371; telephone: (202) 512-1800. Contact GPO for current prices. **Questions or messages regarding errors in formatting should be addressed to mmwrq@cdc.gov.Page converted: 3/13/2002 |
|||||||||
This page last reviewed 3/13/2002
|