 |
|
|
|
|
|
|
| ||||||||||
|
|
|
|
|
|
|
||||
| ||||||||||
|
|
|
|
|
Persons using assistive technology might not be able to fully access information in this file. For assistance, please send e-mail to: mmwrq@cdc.gov. Type 508 Accommodation and the title of the report in the subject line of e-mail. Methodology of the Youth Risk Behavior Surveillance SystemPrepared by Nancy D. Brener, Ph.D.,1 The material in this report originated in the National Center for Chronic Disease Prevention and Health Promotion, George A. Mensah, M.D., Acting Director; and the Division of Adolescent and School Health, Howell Wechsler, Ed.D., Acting Director. Corresponding preparer: Nancy D. Brener, Ph.D., Research Psychologist, Surveillance and Evaluation Research Branch, CDC/NCCDPHP/DASH, 1600 Clifton Rd., NE, MS K-33, Atlanta, GA 30333; Telephone: 770-488-6184; Fax: 770-488-6156; E-mail: nad1@cdc.gov. Summary CDC developed the Youth Risk Behavior Surveillance System (YRBSS) to monitor six categories of priority health-risk behaviors among youth -- behaviors that contribute to unintentional injuries and violence; tobacco use; alcohol and other drug use; sexual behaviors that contribute to unintended pregnancy and sexually transmitted diseases, including human immunodeficiency virus (HIV) infection; unhealthy dietary behaviors; and physical inactivity -- plus overweight. These risk behaviors contribute markedly to the leading causes of death, disability, and social problems among youth and adults in the United States. YRBSS includes a national school-based survey conducted by CDC as well as state, territorial, and local school-based surveys conducted by education and health agencies. In these surveys, conducted biennially since 1991, representative samples of students in grades 9--12 are drawn. In 2003, a total of 15,214 students completed the national survey, and 32 states and 20 school districts also obtained data representative of their jurisdiction. Although multiple publications have described certain methodologic features of YRBSS, no report has included a comprehensive description of the system and its methodology. This report describes the background and rationale for YRBSS and includes a detailed description of the methodologic features of the system, including its questionnaire; operational procedures; sampling, weighting, and response rates; data-collection protocols; data-processing procedures; reports and publications; and data quality. YRBSS is evolving to meet the needs of CDC and other users of the data. Background and RationaleIn 1987, CDC developed a program to provide fiscal and technical assistance to state* and local education agencies for effective human immunodeficiency virus (HIV) prevention programs for youth. Since 1992, CDC has funded education agencies to also provide additional broad-based programs, often referred to as coordinated school health programs. The effectiveness of these programs is partially determined by their ability to positively influence behaviors that increase the risk for HIV infection and that are associated with the leading causes of death and disability among youth and adults in the United States. The advent of these programs underscored the need for quality and comprehensive data regarding the health-risk behaviors of youth. During the late 1980s and early 1990s, HIV prevention programs and coordinated school health programs frequently were developed without empirical information regarding 1) the prevalence of key behaviors that most influence health and 2) how those behaviors were distributed among subgroups of students. In the United States during the late 1980s, only a limited number of health-related school-based surveys existed. Monitoring the Future: A Continuing Study of the Lifestyles and Values of Youth had been ongoing since 1975 (1). It measured drug use and related determinants in a national sample of 12th grade students. In 1987, the one-time National Adolescent Student Health Survey was administered to a nationally representative sample of 8th and 10th grade students and measured consumer health, alcohol and other drug use, injury prevention, nutrition, knowledge and attitudes regarding sexually transmitted diseases (STDs) and acquired immunodeficiency syndrome (AIDS), attempted suicide, and violence-related behaviors (2). Multiple smaller school-based surveys also had been conducted and focused on nutrition, tobacco use, or exercise (3). However, surveys conducted only on a national level, one-time surveys, and categorical surveys could not meet the needs of state and local education agencies designing ongoing HIV prevention and coordinated school health programs. Therefore, CDC developed the Youth Risk Behavior Surveillance System (YRBSS) to monitor priority health-risk behaviors that contribute substantially to the leading causes of death, disability, and social problems among youth and adults in the United States. YRBSS includes biennial national, state, and local school-based surveys of representative samples of students in grades 9--12. ComponentsThe national Youth Risk Behavior Survey (YRBS) provides data representative of U.S. high school students. The state and local surveys provide data representative of high school students in states and school districts that receive funding from CDC through cooperative agreements. All 50 state education agencies, seven territorial education agencies, and 24 local education agencies are eligible to receive funding to conduct YRBS. Although this report focuses on the national, state, and local school-based surveys, YRBSS also includes other national and special population surveys. In 1992, CDC conducted the first of these additional national surveys. A Youth Risk Behavior Supplement was added to the 1992 National Health Interview Survey (NHIS) (4). The NHIS and Youth Risk Behavior Supplement, conducted among a national probability sample of households, was designed to provide information regarding the demographic characteristics of households where young persons reside. Data were obtained from 10,645 persons aged 12--21 years, including youth attending school as well as those not attending school. School-aged youth who were not attending school were oversampled. The questionnaire was administered through individual portable cassette players with earphones; respondents listened to the questions and marked their answers on a standardized answer sheet. This method helped to compensate for reading problems among respondents, helped to ensure privacy during household administration, and allowed youth to avoid disclosing their responses to an interviewer. In 1995, CDC conducted the National College Health Risk Behavior Survey to determine the prevalence of health-risk behaviors among college students (5). The questionnaire was mailed to respondents. Students who did not respond initially were contacted by mail and telephone to encourage participation. Questionnaires were received from a representative sample of 4,609 undergraduate students enrolled in 92 public and private, 2- and 4-year colleges and universities. In 1998, CDC conducted the National Alternative High School Youth Risk Behavior Survey to measure priority health-risk behaviors among a nationally representative sample of 9th--12th grade students who were attending alternative high schools (6). The alternative high schools included in the sampling frame for this survey serve approximately 280,000 students who are at high risk for failing or dropping out of regular high school or who have been expelled from regular high school because of illegal activity or behavioral problems. In 115 schools, a total of 8,918 students completed questionnaires. Special population surveys have been conducted periodically. An example of special population surveys are those conducted among American Indian youth. CDC provides technical assistance to the Bureau of Indian Affairs (BIA) and the Navajo Nation to conduct YRBS. Since 1994, BIA periodically has conducted surveys of American Indian youth attending middle and high schools funded by BIA. Since 1997, the Navajo Nation periodically has conducted surveys in schools on Navajo reservations and schools having high Navajo enrollment in border towns. Purposes of YRBSSYRBSS has multiple purposes. The system was designed to determine the prevalence of health-risk behaviors among high school students; assess whether these behaviors increase, decrease, or stay the same over time; and examine the co-occurrence of health-risk behaviors. The decision to focus YRBSS almost exclusively on health-risk behaviors, rather than the determinants of these behaviors (e.g., knowledge, attitudes, beliefs, or protective factors), was made as the surveillance system was being developed. This decision was based on direct, well documented connections between specific health-risk behaviors and specific health outcomes that are independent of subgroup membership. Multiple behaviors that are measured (e.g., alcohol and other drug use and sexual behaviors) also are associated with educational and social outcomes, including absenteeism, poor school achievement, and dropping out of school (7). Another purpose of YRBSS is to provide comparable national, state, and local data as well as comparable data among subpopulations of youth (e.g., racial/ethnic groups). YRBSS also was designed to monitor progress toward achieving national health objectives for 2000 (8) and 2010 (9) (Table 1) as well as other program indicators (e.g., CDC's HIV Prevention Strategic Plan) (10). Multiple publications have described methodologic features of YRBSS. In 1993, CDC authored a special issue of Public Health Reports that described the rationale of YRBSS, the development of the original questionnaire, and operation of the 1990 and 1991 surveys (11). In addition, YRBSS results have been published biennially in CDC's Morbidity and Mortality Weekly Report (MMWR) Surveillance Summaries since 1993; these publications include brief descriptions of sample designs and data-collection protocols (12--17). Studies in which the reliability and other psychometric properties of the YRBS questionnaire are assessed also have been published (18--22). However, no document has provided a comprehensive description of the system and its methodology. Therefore, the purpose of this report is to provide a detailed description of the methodologic features of YRBSS, including its questionnaire; operational procedures; sampling, weighting, and response rates; data-collection protocols; data-processing procedures; reports and publications; and data quality. QuestionnaireInitial Questionnaire DevelopmentTo determine which risk behaviors YRBSS would assess, CDC first reviewed the leading causes of morbidity and mortality among youth and adults. In 1988, a total of 68% of all deaths among persons aged 1--24 years were from only four causes: motor-vehicle crashes (31%), other unintentional injuries (14%), homicide (13%), and suicide (10%). These percentages have changed only minimally since the original review (23,24). Alcohol use is a factor in approximately one half of the deaths from motor-vehicle crashes, homicides, and suicides (25), and alcohol and other drug use also contributes to key social problems not reflected in morbidity and mortality statistics, including family dysfunction, crime, school dropout, and lost economic productivity (26). In 1988, substantial morbidity and social problems also resulted from >1 million pregnancies occurring among adolescents (27) and the estimated 12 million cases of STDs among persons aged 15--29-years (28). Although rates of pregnancy and STDs among adolescents have decreased since 1988 (29,30), pregnancy and STDs, including HIV infection, remain critical public health problems for youth. Among adults aged >25 years, approximately two thirds of all deaths in 1988 resulted from cardiovascular disease (41%) and cancer (23%), and since 1988, these values have not changed substantially (23,24). The 1988 review as well as similar reviews conducted in 2004 indicate that virtually all behaviors contributing to the leading causes of morbidity and mortality can be placed into six categories: behaviors that contribute to unintentional injuries and violence; tobacco use; alcohol and other drug use; sexual behaviors that contribute to unintended pregnancies and STDs, including HIV infection; unhealthy dietary behaviors; and physical inactivity. These behaviors frequently are interrelated and often are established during youth and extend into adulthood. In 1989, federal agencies that have responsibilities for improving or monitoring the incidence and prevalence of behavioral risks in each of the six categories were asked to appoint a panel chairperson for a YRBSS steering committee. In August 1989, CDC and steering committee members convened a 2-day workshop to delineate priority behaviors and devise questions to measure those behaviors. A panel was established for each risk behavior category and included scientific experts from other federal agencies, nonfederal scientists, survey research specialists from CDC's National Center for Health Statistics (NCHS), and staff from CDC's National Center for Chronic Disease Prevention and Health Promotion, Division of Adolescent and School Health. Because YRBSS was designed to be implemented primarily through school-based surveys, a representative of the Society of State Directors of Health, Physical Education, and Recreation was included on each panel. Because students would have a single class period of approximately 45 minutes to complete a proposed questionnaire covering all six categories of behavior, each panel was asked to identify only the highest priority behaviors from its area and to recommend a limited number of questions to measure the prevalence of those behaviors. The first version of the questionnaire was completed during October 1989 and was reviewed by representatives from the education agency of each state, the District of Columbia, four U.S. territories, and 16 local education agencies funded by CDC at that time. Survey research specialists from NCHS also provided comments and suggestions. A second version of the questionnaire was used during spring 1990 to generate data from a national sample as well as 25 state and nine district samples of students in grades 9--12. In addition, the second version also was sent to the Questionnaire Design Research Laboratory at NCHS for laboratory and field testing with high school students. After NCHS staff examined student responses to the questionnaire, they made recommendations for improving the wording of questions, setting recall periods, and identifying response categories. During October 1990, a third version of the YRBS questionnaire was completed. The questionnaire was similar to the one used during spring 1990, but it was revised to take into account 1) data collected by CDC and state and local education agencies during spring 1990, 2) information from NCHS's laboratory and field tests, and 3) input from YRBSS steering committee members and representatives of each state and the 16 local education agencies. It also included questions for measuring the national health objectives (8). During spring 1991, a total of 26 states and 11 districts conducted YRBS by using this questionnaire, and CDC used it to conduct a national survey. In 1991, CDC determined that because behavioral change in populations typically occurs gradually, biennial surveys would be sufficient to measure health-risk behaviors among students. YRBS has since been conducted every odd year at the national, state, and local levels. Questionnaire Characteristics and RevisionsBefore each biennial survey, sites (states and districts) and CDC work together to revise the questionnaire to reflect site and national priorities. For example, CDC added 10 questions to the 1993 questionnaire to measure a National Education Goal for safe, disciplined, and drug-free schools (31). In consultation with sites, CDC also made minor changes to the 1995 and 1997 questionnaires. In 1997, CDC undertook an in-depth, systematic review of the questionnaire. The review was motivated by multiple factors, including a goal for YRBSS to measure national health objectives for 2010 that were being developed at that time. The purpose of the review and subsequent revision process was to ensure that the questionnaire would provide the most effective assessment of the most critical priority health-risk behaviors among young persons. To guide the decision-making process, CDC solicited input from content experts from CDC and academia as well as from representatives from other federal agencies; state and local education agencies; state health departments; and national organizations, foundations, and institutes. On the basis of input from approximately 800 persons, CDC developed a proposed set of questionnaire revisions, which were sent to all state and local education agencies for further input. In addition to considering the amount of support from sites for the proposed revisions, CDC considered multiple factors in making final decisions regarding the questionnaire, including 1) input from the original reviewers, 2) whether the question measured a health-risk behavior practiced by youth, 3) whether data on the topic were available from other sources, 4) the relationship of the behavior to the leading causes of morbidity and mortality among youth and adults, and 5) whether effective interventions existed that could be used to modify the behavior. As a result of this process, CDC created the 1999 YRBS questionnaire by adding 16 new questions, deleting 11 questions, and making substantial wording changes to 14 questions. For example, two questions that assess self-reported height and weight were added in recognition of increasing concerns regarding obesity. As a result, YRBSS now includes national, state, and local estimates of body mass index (BMI) calculated from self-reported data. In 2000 and 2002, CDC, in consultation with all sites, made minor modifications to the 1999 version of the questionnaire to create the 2001 and 2003 questionnaires. In 2004, CDC also made additional minor changes to the questionnaire to create the version that will be used in 2005. This questionnaire includes four items that assess demographic information; 20 items related to unintentional injuries and violence; 11, tobacco use; 18, alcohol and other drug use; seven, sexual behavior; 16, body weight and dietary behaviors; seven, physical activity; and four, other health-related topics. This questionnaire and the rationale for the inclusion of each item are available at www.cdc.gov/yrbs. CDC provides sites that conduct YRBS with the questionnaire for that year as a computer-scannable booklet. To meet their needs, sites may modify this questionnaire within certain parameters: 1) two thirds of the questions from the standard YRBS questionnaire must remain unchanged; 2) questions are limited to eight mutually exclusive response options; and 3) skip patterns,† grid formats, and fill-in-the-blank formats cannot be used. Sites that modify the questionnaire receive from CDC a camera-ready copy of the questionnaire and scannable answer sheets. Sites that use these scannable answer sheets must retain the height and weight questions as items six and seven and cannot use questionnaires that include >99 items. For sites that want to modify their questionnaire, CDC also provides a list of optional questions for consideration. This list has been available to sites since 1999 and includes items that have been on previous versions of the national, state, or local YRBS questionnaires as well as items designed to address topics of key interest to CDC or the sites. By using these optional questions, sites can obtain data comparable to those from the national YRBS or from other sites that use these questions. For the national YRBS, the questionnaire that CDC provides to the sites is used but the national questionnaire also includes 5--8 additional questions. These questions, which are included on the optional questions list, typically cover health-related topics that do not fit in the six categories of behavior (e.g., oral health and sun protection). All YRBS questionnaires are self-administered, and students record their responses on a computer-scannable booklet or answer sheet. Skip patterns are not included in the questionnaires to help ensure that similar amounts of time are required to complete the questionnaire, regardless of each student's risk behavior status. This technique also prevents students from detecting on other answer sheets and booklets a pattern of blank responses that might identify the risk behaviors of other students.
Questionnaire Reliability and ValidityCDC has conducted two test-retest reliability studies of the national YRBS questionnaire, one in 1992 and one in 2000. In the first study, the 1991 version of the questionnaire was administered to a convenience sample of 1,679 students in grades 7--12. The questionnaire was administered on two occasions, 14 days apart (18). Approximately three fourths of the items were rated as having a substantial or higher reliability (kappa = 61%--100%), and no statistically significant differences were observed between the prevalence estimates for the first and second times that the questionnaire was administered. The responses of 7th grade students were less consistent than those of students in higher grades, indicating that the questionnaire is best suited for students in grades >8. In the second study, the 1999 version of the questionnaire was administered to a convenience sample of 4,619 high school students. The questionnaire was administered on two occasions, approximately 2 weeks apart (20). Approximately one of five items (22%) had significantly different prevalence estimates for the first and second times that the questionnaire was administered. Ten items (14%) had both kappas <61% and significantly different time-1 and time-2 prevalence estimates, indicating that the reliability of these items is questionable. Certain items (e.g., an item related to injury during physical activity) have been revised for or deleted from later versions of the questionnaire. Although no study has been conducted to assess the validity of all self-reported behaviors that are included on the YRBS questionnaire, in 2003 CDC conducted a review of existing empirical literature to assess cognitive and situational factors that might affect the validity of adolescent self-reporting of behaviors measured by the YRBS questionnaire (32). In this review, CDC determined that, although self-reports of these types of behaviors are affected by both cognitive and situational factors, these factors do not threaten the validity of self-reports of each type of behavior equally. In addition, each type of behavior differs in the extent to which it can be validated by an objective measure. For example, reports of tobacco use are influenced by both cognitive and situational factors and can be validated by biochemical measures (e.g., cotinine). Reports of sexual behavior also can be influenced by both cognitive and situational factors, but no universal standard exists to validate the behavior. Reports of physical activity, in contrast, are influenced substantially by cognitive factors but to a lesser degree by situational ones. Such reports can be validated by mechanical or electronic monitors (e.g., heart rate monitors). Understanding the differences in factors that threaten the validity of self-reporting of different types of behavior can assist policymakers in interpreting data and researchers in designing measures that minimize such threats. In 2000, CDC also conducted a study to assess the validity of the two YRBS questions regarding self-reported height and weight (19). In that study, 2,965 high school students completed the 1999 version of the YRBS questionnaire on two occasions approximately 2 weeks apart. After completing the questionnaire, the students were weighed and had their height measured. Self-reported height, weight, and BMI calculated from these values were substantially reliable, but on average, students in the study overreported their height by 2.7 inches and underreported their weight by 3.5 pounds, which indicates that YRBSS probably underestimates the prevalence of overweight in adolescent populations. Operational ProceduresThe national YRBS is conducted from February through May of each odd-numbered year. All except a few sites also conduct their survey during this period; certain sites conduct their YRBS during the fall or during even-numbered years. Separate samples and operational procedures are used in the national survey and state and local surveys. The national sample is not an aggregation of the state and local surveys, and state or local estimates cannot be obtained from the national survey. In certain instances, a school is selected as part of the national sample as well as a state or local sample. Similarly, a school might be selected as part of both a state and a local sample. When schools are selected as part of two samples, the field work is only conducted once to minimize the burden on the school and eliminate duplication of efforts. The data from the school are then merged with both datasets during data processing. State and Local SurveysBefore 2003, CDC funded state and local education agencies for HIV prevention or coordinated school health programs, and sites could choose to conduct YRBS with a portion of these cooperative agreement funds. Since the 2003 surveys, sites have applied specifically for cooperative agreement funds to conduct YRBS. Surveys are conducted by state and local education agencies or by state health departments, often with the assistance of survey contractors. In 2003, a total of 20 states, two territories, and six districts hired contractors to assist with administering surveys, and in 13 states and two districts, the health department was the lead agency for survey administration. Certain states coordinate YRBS with multiple other surveys (e.g., the Youth Tobacco Survey [YTS] and a Safe and Drug-Free Schools and Communities Act survey) or with a single survey (e.g., YTS) to reduce the burden on schools and students and to save resources. The coordination is typically done by sampling double or triple the number of schools or double or triple the number of classrooms. Doubling the number of schools sampled produces two nonoverlapping samples of schools. The samples can be used during the same or separate semesters, and schools can be assured that they will be asked to participate in only one survey. This approach is most useful in states that have numerous high schools and in states where at least one of the two surveys is considered controversial or previously has not been conducted successfully. Doubling the number of classes increases the burden within sampled schools but minimizes the number of schools asked to participate. When the number of classes is doubled, both surveys are administered simultaneously. This approach is useful in states with few high schools and in states where both surveys have been conducted successfully. Regardless of the type of coordination selected, the key CDC division and office (i.e., Division of Adolescent and School Health and Office on Smoking and Health) and the sponsoring state agencies work together to plan and implement the coordination. In 2003, a total of 11 states used coordinated samples to conduct their YRBS and YTS. State and local agencies always conduct their YRBS among samples of high school students. In addition, certain sites choose to conduct YRBS among middle school students, by using a modified questionnaire designed specifically for the reading and comprehension skills of this age group. In 2003, a total of eight states, three territories, and eight districts conducted a middle school YRBS. Certain sites also choose to conduct a YRBS among alternative school students or those in juvenile justice facilities. In 2003, a total of four states and three districts conducted YRBS in one of these settings. Technical Assistance Through a series of contracts with Westat, CDC has provided increasingly comprehensive technical assistance to sites conducting YRBS. When the first contract was awarded in 1988, technical assistance was limited and driven primarily by site-generated questions. Technical assistance has expanded to cover the entire survey process and is a continual and proactive system. CDC and Westat help sites plan surveys, identify methods to obtain clearance, select schools and classes, obtain parental permission, plan for survey administration, prepare data for analysis, and report survey results. Technical assistance is available through different modes, including written materials (e.g., the YRBS Handbook [33]), monthly electronic newsletters, a toll-free telephone number, e-mail, and in-person site visits. During the 2003 YRBS cycle (September 2002--April 2004), >2,300 contacts were made between sites and Westat or CDC. Approximately 25% of these technical assistance requests were of a general nature (e.g., how to obtain YRBS-related materials); 22% were related to sampling; 10% each, questionnaire modifications, questionnaire administration, and weighting; 8%, data processing; and 15%, other concerns, including reports, scanning, and clearance. Technical assistance also is available through the Survey Technical Assistance Internet site. Sites use this password-protected Internet site to request materials (e.g., questionnaire booklets and answer sheets), download references and supporting documents (e.g., the YRBS Handbook and sample parental permission forms), and check the status of their data (e.g., the date that their data file was sent to CDC). By using the Internet site, sites can access contact information for CDC and Westat staff and can send e-mail inquiries for further assistance. During the 2003 YRBS cycle, the Internet site received 1,054 "hits" from site representatives. The Internet site also provides CDC and Westat staff with reports to support survey management. For example, CDC and Westat can use the Internet site to track when questionnaires are received from each site and to check the status of data processing. Since 1992, CDC and Westat have conducted biennially a 3-day training for survey coordinators and contractors who either are new or who have not had YRBS successfully conducted in their site. The training comprises both lectures and hands-on skill-building activities and covers all aspects of the survey process, including planning the survey, obtaining clearance, selecting schools and classes, obtaining parental permission, administering surveys, and preparing data for analysis. CDC and Westat also provide technical assistance with sample selection. Sites obtain their sampling frame, which is a list of schools in the jurisdiction of the site, along with enrollment information for grades 9--12 from state or local agencies or from Westat. Because the sampling frame often is based on data from the previous school year, sites need to update their frame by deleting closed schools and adding newly opened schools. After the site updates the frame, Westat uses computer software called PCSample to help draw probability samples of schools and classes. In 1989, CDC and Westat developed PCSample to help sites draw systematic random samples of schools with probability proportional to enrollment size. At the time, no user-friendly, commercially available software was available for this purpose, and PCSample remains a unique example of this type of software. By using information regarding expected school and student response rates, absenteeism, desired sample size, and school enrollment, PCSample selects a school sample. For each school, PCSample generates a worksheet with a class sampling interval that is used to randomly select classes in participating schools. The worksheets are sent to each site planning YRBS. Although PCSample was developed for YRBS, the software is used for other school-based surveys (e.g., CDC's YTS, Global YTS, and Global School-Based Student Health Survey). National SurveySince 1990, the national school-based survey has been conducted under contract with Macro International (ORC MacroSM). With CDC oversight, the contractor is responsible for sample design and sample selection. After the schools have been selected, the contractor also is responsible for obtaining the appropriate state-, district-, and school-level clearances to conduct the survey in those schools. The contractor selects classes and works with selected schools to schedule data collection and obtain parental permission. In addition, the contractor 1) hires and trains data collectors to follow a common protocol to administer the questionnaires in the schools; 2) coordinates data collection; 3) weights the data; and 4) prepares the data for analysis. Sampling, Weighting, and Response RatesState and Local SurveysEach state and local school-based YRBS employs a two-stage, cluster sample design to produce representative samples of students in grades 9--12 in their jurisdiction. Samples are selected by using PCSample. All except a few state and local samples include only public schools, and each local sample includes only schools in the funded school district (e.g., San Diego Unified School District) rather than in the entire city (e.g., greater San Diego area). In the first sampling stage in all except a few states and districts, schools are selected with probability proportional to school enrollment size. In the second sampling stage, intact classes of a required subject or intact classes during a required period (e.g., second period) are selected randomly. All students in sampled classes are eligible to participate. Certain states and districts modify these procedures to meet their individual needs. For example, in a given state or district, all schools, rather than a sample of schools, might be selected to participate. State and local surveys that have a scientifically selected sample, appropriate documentation, and an overall response rate >60% are weighted. The overall response rate reflects the school response rate multiplied by the student response rate. These three criteria are used to ensure that the data from those surveys can be considered representative of students in grades 9--12 in that jurisdiction. A weight is applied to each record to adjust for student nonresponse and the distribution of students by grade, sex, and race/ethnicity in each jurisdiction. Therefore, weighted estimates are representative of all students in grades 9--12 attending schools in each jurisdiction. Surveys that do not have an overall response rate of >60% and appropriate documentation are not weighted. Unweighted data represent only the students participating in the survey. The number of weighted and unweighted state and local surveys conducted as part of YRBSS since 1991 are presented in this report (Table 2). Since 1991, not only has the number of participating sites increased, but the number and percentage of weighted sites also have increased. In 2003, a total of 32 states and 20 districts had weighted data; 11 states and two districts had unweighted data. In addition, in 2003, in sites with weighted data, the student sample sizes for the state and local YRBS ranged from 968 to 9,320. School response rates ranged from 67% to 100%, student response rates ranged from 60% to 94%, and overall response rates ranged from 60% to 90%. National School-Based SurveyThe national YRBS uses a three-stage, cluster sample design to obtain a nationally representative sample of students in grades 9--12 in the United States. The target population comprises all public and private high school students in the 50 states and the District of Columbia. U.S. territories are excluded from the sampling frame. Sample sizes from the national YRBS are designed to produce estimates that are accurate within ±5% at 95% confidence. Overall estimates as well as estimates for sex, grade, race/ethnicity, grade by sex, and race/ethnicity by sex subgroups meet this standard. Estimates for grade by race/ethnicity subgroups are accurate within ±5% at 90% confidence. The first-stage sampling frame for each national survey includes primary sampling units (PSUs) consisting of large-sized counties or groups of smaller, adjacent counties. Since the 1999 sample, PSUs large enough to be selected with certainty are divided into sub-PSU units. Schools are then sorted by size and assigned in rotation to the newly created sub-PSU units. PSUs are selected from 16 strata categorized according to the metropolitan statistical area (MSA) status and the percentages of black and Hispanic students in PSUs. PSUs are classified as urban if they are in one of the 54 largest MSAs in the United States; otherwise, they are considered rural. PSUs are selected with probability proportional to school enrollment size for PSUs. In the second stage of sampling, schools are selected from PSUs. A list of public and private schools in PSUs is formed by merging data from the Quality Education Database (34) and the Common Core of Data from the National Center for Education Statistics (35). These databases also include enrollment figures. Schools with all four high school grades (9--12) are considered whole schools. Schools with any other set of grades are considered fragment schools and are combined with other schools (whole or fragment) to form a cluster school that includes all four grades. The cluster school is treated as a single school during school selection. Schools are divided into two groups on the basis of enrollment. Schools that have an estimated enrollment of >25 students for each grade are considered large, and schools that have an estimated enrollment of <25 students for any grade are considered small. Approximately one fourth of PSUs are selected for small school sampling. For each of these PSUs, one small school is drawn with probability proportional to size, considering only small schools within that PSU. Three large schools are then selected from all sampled PSUs with probability proportional to school enrollment size. To enable a separate analysis of data for black and Hispanic students, three strategies are used to achieve oversampling of these students: 1) larger sampling rates are used to select PSUs that are in high-black and high-Hispanic strata; 2) a modified measure of size is used that increases the probability of selecting schools that have a disproportionately high minority enrollment; and 3) two classes per grade, rather than one, are selected in high-minority schools. The final stage of sampling consists of randomly selecting, in each chosen school and in each of grades 9--12, one or two entire classes. Examples of classes include homerooms or classes of a required discipline (e.g., English and social studies). All students in sampled classes are eligible to participate. A weight based on student sex, race/ethnicity, and school grade is applied to each record to adjust for student nonresponse and oversampling of black and Hispanic students. To avoid inflated sampling variances, weights exceeding a criterion value are trimmed and distributed among untrimmed weights, by using an iterative process (36). The final, overall weights are scaled so that the weighted count of students equals the total sample size and so that the weighted proportions of students in each grade match national population projections for each survey year. Therefore, weighted estimates are representative of all 9th--12th grade students who are attending public and private schools in the United States. Sampled schools, classes, and students who refuse to participate in the survey are not replaced. Sampling without replacement maintains the integrity of the sample design and helps avoid the introduction of unmeasurable bias into the sample. Response rates and total sample sizes for the national school-based surveys conducted from 1991 through 2003 are presented in this report (Table 3). Data-Collection ProtocolsData-collection procedures are similar for national, state, and local surveys. Local procedures for obtaining parental permission are followed before administering YRBS in any school. Certain schools use active permission, in which parents must send back to the school a signed form indicating their approval before their child can participate. Other schools use passive permission, in which parents send back a signed form only if they do not want their child to participate in the survey. In the 2003 state and local surveys, three of 43 participating states used statewide active permission procedures, and five of 22 districts used districtwide active permission. Multiple individual schools within other sites also used active permission. In the 2003 national YRBS, 38% of schools used active permission, and 62% used passive permission. For the national survey and the majority of state and local surveys, trained data collectors travel to each participating school to administer the questionnaires to students. These data collectors read a standardized script to participating students. The script includes an introduction to the survey. Data collectors also record information regarding schools and classrooms (e.g., grade level of classes sampled and number of students enrolled in a selected class). This information is used later in the survey process to verify sample selection and to weight data. In certain state and local surveys, the questionnaires are sent to the school, and teachers of the selected classes administer the survey to their class by using the standardized script. The school then sends the completed questionnaires and accompanying documentation to the state or local agency conducting the survey. Survey procedures for the national, state, and local surveys are designed to protect student privacy by allowing for anonymous and voluntary participation. In all surveys, students complete the self-administered questionnaire during one class period and record their responses directly in a computer-scannable booklet or on an answer sheet. To the extent possible, students' desks are spread throughout the classroom to minimize the chance that students will see each others' responses. Students also are encouraged to use an extra sheet of paper or an envelope, provided by the data collector, to cover their responses as they complete the questionnaire. In the national survey, and in certain state and local surveys, when students complete the questionnaire, they are asked to seal their questionnaire booklet or answer sheet in an envelope before placing it in a box. In the national survey, students who are absent on the day of data collection still can complete questionnaires if their privacy can be maintained. These make-up data-collection efforts sometimes are administered by the data collector; however, if the data collector cannot administer the questionnaire, school personnel can perform this task. Allowing students who were absent on the day of data collection to take the survey at a later date increases student response rates. In addition, because frequently absent students are more likely to engage in health-risk behaviors than students who are not frequently absent (37), these procedures help provide data that are representative of all high school students. In the 2003 national YRBS, questionnaires from 664 students (5% of all participating students) were completed during a make-up data collection. Data-Processing ProceduresState and Local SurveysTo take advantage of the expertise at CDC and Westat and to provide a system of checks and balances, data processing for state and local surveys is a collaborative effort between the two organizations. All except a few sites send completed questionnaires or answer sheets to Westat, where they are scanned and a raw electronic dataset is constructed. Certain sites scan their answer sheets and send the raw electronic dataset to Westat. Westat sends all raw datasets to CDC, where editing for out-of-range responses, logical consistency, and missing data occurs. The data cleaning and editing process is performed with Visual Basic® (38) and SAS® (39) programs. The processing system accommodates questionnaires in which questions have been deleted or added by the sites. For the 2003 YRBS, 225 logical edits were performed on each questionnaire. Responses that conflict in logical terms are both set to missing, and data are not imputed. For example, if a student responds to one question that he or she has never smoked but then responds to a subsequent question that he or she has smoked two cigarettes in the previous 30 days, the processing system sets both responses to missing. Neither response is assumed to be the correct response. Questionnaires with <20 valid responses remaining after editing are deleted from the dataset. In 2003, the number of completed questionnaires in the state surveys that failed quality-control checks and were excluded from analysis ranged from 0 to 86, with a median of four. In the local surveys, the range was 0--35, with a median of eight. Edited data are sent to Westat for weighting. If response rates are sufficient, documentation is appropriate, and the site followed sampling protocols correctly, Westat weights the data according to the procedures previously described in this report and sends the weights to CDC, where the weights are merged onto the edited data file. National SurveyData processing for the national survey is similar to that performed for the state and local surveys. ORC Macro scans all completed questionnaires from the national survey and sends a SAS dataset to CDC. To maintain consistency with the data processing used for the state and local surveys, CDC then converts this dataset to one that can be entered into the processing system used for the state and local surveys. The national dataset is treated as though it were a state or local site. Data are edited by using the same procedures described previously. In 2003, a total of 26 questionnaires in the national survey failed quality-control checks and were excluded from analysis. Edited data are then sent to ORC Macro, where statisticians weight the data according to the procedures described previously. ORC Macro then sends the weights to CDC, where the weights are merged onto the data file. Reports and PublicationsReportsCDC generates a report for the national survey and for each participating site. The reports are generated with Visual Basic programs that control SAS, SUDAAN® (40), Microsoft® Excel (41), Microsoft® Word (42), PowerPoint® (43), and Crystal Reports® (44) applications. Each report includes tables and graphs that provide prevalence estimates for each question asked by a site, including site-added questions. Results are organized by sex, age, grade, and race/ethnicity. The national report and reports for sites with weighted data include 95% confidence intervals. To help ensure the reliability of the estimates and protect the anonymity of respondents, subgroup results are not reported if <100 students are in a given subgroup. The reports also include sampling information and technical documentation detailing how data were processed, edited, and tabulated. Each site also receives a CD-ROM that has the data in multiple data file formats (e.g., SAS, SPSS® (45), and ASCII) to allow sites to perform subsequent analyses. Sites use the CDC-generated report to create their own fact sheets, summaries, full reports, and web-based materials. They combine the results of their YRBS with other data sources (e.g., vital statistics and educational policy information) to create materials that meet their needs. Sites, national nongovernmental organizations, CDC, and other federal agencies use YRBS data for multiple purposes. YRBS data make key contributions to public health surveillance by documenting the prevalence of priority health-risk behaviors among youth. YRBS data also are used to 1) create awareness of the level of risk among youth, 2) supplement staff development programs for teachers and school administrators, 3) set and monitor program goals (e.g., Healthy People 2010), 4) develop health education programs, 5) support health-related legislation, and 6) seek funding for new initiatives (46). PublicationsFrom September 1991 through April 1992, results from the national YRBS conducted in 1990 were published for the first time in 12 reports in CDC's MMWR (47--58). One of these reports also included state and local data (50). From June through December 1992, results from the national YRBS conducted in 1991 were published for the first time in five MMWR reports (59--63) and in a Public Health Reports supplement (64); results from the 1991 state and local surveys were published for the first time in four of the five MMWR reports (60--63). Beginning with the 1993 surveys, data from the national, state, and local surveys have been published together for the first time in MMWR Surveillance Summaries (12--17). Each MMWR Surveillance Summary includes a brief introduction and description of methods, followed by data for each behavior measured by YRBS. State and local data are presented by sex. Since 2003, only states and districts with weighted data are included. National data are presented by sex, race/ethnicity, and school grade. Since the 1999 cycle, information also has been provided regarding trends over time. In addition to providing descriptive information regarding the prevalence of health-risk behaviors among youth, YRBSS also provides researchers with data for secondary analyses. These analyses have resulted in the publication of reports in both the MMWR Weekly and peer-reviewed journals. Certain analyses provide data regarding trends over time (65--67); other analyses provide detailed information regarding a single category of risk behaviors (e.g., tobacco use) (68). In addition, certain reports focus on the interrelationship of risk behaviors (69) or the relationship between risk behaviors and demographic characteristics of adolescents (70). Although for the majority of these analyses, data from the national school-based survey are used, for other analyses, data from the national household-based survey (70), the National College Health Risk Behavior Survey (71), the National Alternative High School Youth Risk Behavior Survey (72), and state-based surveys (73) are used. A list ofYRBSS publications by CDC authors, published since 1999, is available at http://www.cdc.gov/nccdphp/dash/yrbs/YRBSS_publications.htm. Researchers outside CDC also publish reports by using YRBS data. In 2004, CDC reviewed the MEDLINE® (National Library of Medicine, National Institute of Health, Bethesda, Maryland. Available at http://www.ncbi.nlm.nih.gov/PubMed.), PsycINFO, and Web of Science® (Thomson Scientific, Philadelphia, Pennsylvania. Available at http://www.isinet.com/products/citation/wos.) databases and documented approximately 130 scientific publications that have been published since 1990 (articles, book chapters, and dissertations) and were written by non-CDC authors. Publications based on studies in which researchers created their own questionnaires by using selected items or groups of items from the YRBS questionnaire are not included in the previous figure. YRBS data also are cited extensively in the press, including magazines, newspapers, and broadcast news. Internet SiteCDC maintains an Internet site that includes information regarding YRBSS (http://www.cdc.gov/yrbss). The Internet site includes a Portable Document Format (PDF) file of MMWR Surveillance Summaries, fact sheets that include summary results for each site, a map of participating sites, and an interactive database called Youth Online. Youth Online allows users to view detailed survey results, by site, question, demographic variables, and survey year. Only weighted data are included, and results can be presented as tables or graphs. Youth Online also allows users to compare results from national, state, and local surveys and examine trends over time. The YRBS Internet site also includes data files and documentation for all national surveys conducted since 1991. When these files are downloaded, researchers can conduct their own analyses of the national data. Researchers can contact the sites directly to request state and local data. Data QualityFrom the inception of YRBSS, CDC has been committed to ensuring that the data are the highest quality. High quality data begins with high quality questionnaire items. As described previously, the original questionnaire was subjected to laboratory and field testing. CDC also has conducted reliability and validity testing of the 1991 and 1999 versions of the questionnaires. In addition, in 1999, when CDC changed the YRBS question that assesses race/ethnicity to comply with new standards established by the Office of Management and Budget (74), CDC conducted a study to assess the effect of the new race/ethnicity question on reported race/ethnicity. The study indicated that the revised wording had only a minimal effect on reported race/ethnicity and that trend analyses that included white, black, and Hispanic subgroups were not affected (22). Another aspect of data quality is the level of nonresponse to questions. For the 2003 national YRBS, nonresponse attributed to blank responses, invalid responses, out-of-range responses, and responses that did not meet edit criteria ranged from 0.4% for the question that assesses respondent age to 15.5% for the question that assesses injurious suicide attempt. For two thirds of all questions, the nonresponse rate was <5%, and for 11% of all questions, the nonresponse rate was <1%. To further ensure data quality, surveys are administered by using standardized procedures. To determine how using different procedures can affect survey results, CDC conducted two methodologic studies. In the first study, conducted in 2002, CDC examined how varying honesty appeals,§ the wording of questions, and data-editing protocols -- while holding population, setting, questionnaire context, and mode of administration constant -- affected prevalence estimates (75). The study indicated that different honesty appeals and data-editing protocols do not have a statistically significant effect on prevalence estimates. In addition, the study indicated that, although differences in the wording of questions can create statistically significant differences in certain prevalence estimates, no particular type of wording consistently produced higher or lower estimates. In the second study, conducted in 2004, CDC examined how varying the mode and setting of survey administration might affect prevalence estimates. In this study, the standard paper-and-pencil method of survey administration was compared with computer-assisted self-interviewing (CASI). Researchers determined from previous studies that, in household settings, adolescents are more likely to report sensitive behaviors when using CASI than when using paper-and-pencil questionnaires (76,77), but this effect has not been demonstrated in school settings (78,79). In the 2004 study, CDC also compared whether prevalence estimates varied by where the questionnaire was administered, in schools or in students' homes. Researchers who have compared the results of surveys administered in school versus in household settings typically have determined that students are more likely to report sensitive behaviors in school-based settings (21,80,81). However, in these studies, students were not randomly assigned to setting. In one study in which random assignment to setting was used, these effects were not observed (82). The CDC study is the first in which both mode and setting were systematically varied, while holding constant population, questionnaire context, wording of questions, and data-editing protocols. This study is also the first one in which random assignment to condition was used. Results from this study should be available in 2005. LimitationsYRBSS has multiple limitations. First, all YRBS data are self-reported, and the extent of underreporting or overreporting of behaviors cannot be determined, although measures described in this report demonstrate that the data are of acceptable quality. Second, the national, state, and local school-based survey data apply only to youth who attend school and, therefore, are not representative of all persons in this age group. Nationwide, of persons aged 16--17 years, approximately 6% were not enrolled in a high school program and had not completed high school (83). The NHIS and Youth Risk Behavior Supplement conducted in 1992 demonstrated that out-of-school youth are more likely than youth attending school to engage in the majority of health-risk behaviors (84). Third, because local parental permission procedures are observed in the school-based surveys, procedures are not consistent across sites. However, in a 2004 study, CDC demonstrated that the type of parental permission typically does not affect prevalence estimates as long as student response rates remain high (85). Fourth, state-level data are not available for all 50 states. Fifth, when response rates are insufficient to permit weighting, state and local data represent only those students who participated in the survey and are not generalizable to the entire jurisdiction. Sixth, whereas YRBSS is designed to produce information to help assess the effect of broad national, state, and local policies and programs, it was not designed to evaluate the effectiveness of specific interventions (e.g., a professional development program, school curriculum, or media campaign). Finally, YRBSS only addresses behaviors that contribute to the leading causes of morbidity and mortality among youth and adults. However, despite this limited scope, school and community interventions should focus not only on behaviors but also on the determinants of those behaviors. Future DirectionsAs with any public health surveillance system, YRBSS is constantly evolving to meet the needs of CDC and other users of the data. As described previously in this report, the questionnaire is revised before each biennial cycle, and new survey populations periodically have been added to the system since its inception. In the future, additional substate sampling and analysis might be possible, similar to the Selected Metropolitan/Micropolitan Area Risk Trends that are part of the Behavioral Risk Factor Surveillance System (86). Finally, technologic improvements might lead to CASI-based data collection if methodologic studies (e.g., the CDC study described previously) can demonstrate that such data collection is feasible in schools and has a limited effect on prevalence estimates. References
* State refers to the 50 United States as well as seven U.S. territories (Guam, Marshall Islands, Northern Mariana Islands, Palau, Puerto Rico, Republic of Micronesia, and the U.S. Virgin Islands). † Skip patterns occur when a particular response to one question indicates to the respondents that they should not answer >1 subsequent question. § Honesty appeals, typically part of questionnaire introductions, ask respondents to be truthful when self-reporting behaviors. Table 1 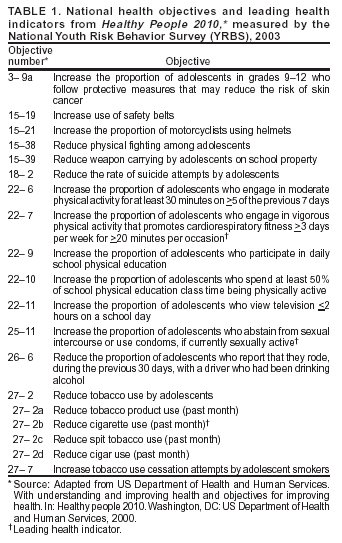 Return to top. Table 2 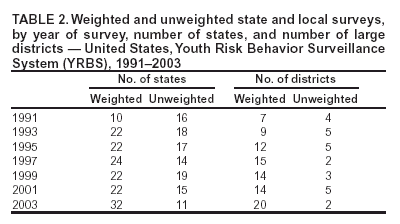 Return to top. Table 3 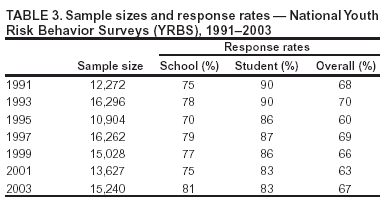 Return to top.
Disclaimer All MMWR HTML versions of articles are electronic conversions from ASCII text into HTML. This conversion may have resulted in character translation or format errors in the HTML version. Users should not rely on this HTML document, but are referred to the electronic PDF version and/or the original MMWR paper copy for the official text, figures, and tables. An original paper copy of this issue can be obtained from the Superintendent of Documents, U.S. Government Printing Office (GPO), Washington, DC 20402-9371; telephone: (202) 512-1800. Contact GPO for current prices. **Questions or messages regarding errors in formatting should be addressed to mmwrq@cdc.gov.Page converted: 9/13/2004 |
|||||||||
This page last reviewed 9/13/2004
|