
Persons using assistive technology might not be able to fully access information in this file. For assistance, please send e-mail to: mmwrq@cdc.gov. Type 508 Accommodation and the title of the report in the subject line of e-mail.
Coal Workers' Pneumoconiosis-Related Years of Potential Life Lost Before Age 65 Years --- United States, 1968--2006
Coal workers' pneumoconiosis (CWP) is a preventable, slowly progressive parenchymal lung disease caused by inhalation and deposition of coal mine dust in the lungs. The incidence and rate of CWP progression is related to the amount of respirable coal dust to which miners were exposed during their working lifetime (1). Early pneumoconiosis can be asymptomatic, but advanced disease often leads to disability and premature death (1,2). To characterize the impact of premature mortality attributed to CWP in the United States, CDC's National Institute for Occupational Safety and Health (NIOSH) analyzed annual underlying cause of death data from 1968--2006, the most recent years for which complete data were available. Years of potential life lost before age 65 years (YPLL), and mean YPLL were calculated using standard methodology. This report describes the results of that analysis, which indicate that during 1968--2006, a total of 22,625 YPLL were attributed to CWP (mean per decedent: 5.7). Annual YPLL attributed to CWP decreased 91.2%, from an average of 1,484 YPLL per year during 1968--1972 to 154 per year during 2002--2006. However, annual YPLL from CWP have been increasing since 2002, from 135 in that year to 169 YPLL in 2006, suggesting a need for strengthening CWP prevention measures. CDC intends to maintain surveillance of CWP deaths to determine future trends and promote safer work environments.
NIOSH maintains a mortality surveillance system for work-related respiratory diseases.* Data are drawn from CDC's National Center for Health Statistics (NCHS) multiple cause-of-death data files, which include all deaths in the United States since 1968. YPLL and mean YPLL (3) were calculated using mortality data for 5-year age groups. For this analysis, decedents for whom the International Classification of Diseases (ICD) code for CWP was listed as the underlying† cause of death were identified from 1968--2006 mortality data.§ Deaths with the ICD-10 underlying cause of death coded as J65 (pneumoconiosis associated with tuberculosis) were included if code J60 (coal workers' pneumoconiosis) also was recorded on the death certificate.¶ Because CWP results solely from >10 years of occupational exposure (1,2), only deaths of persons aged ≥25 years were considered. A simple linear regression model was used for time-trend analysis of YPLL (using 5-year moving averages).
During 1968--2006, CWP was identified as the underlying cause of death for 28,912 decedents aged ≥25 years. Of these, 3,983 (13.8%) were aged 25--64 years, including four (0.1%) aged 25--34 years, 40 (1.0%) aged 35--44 years, 494 (12.4%) aged 45--54 years, and 3,445 (86.5%) aged 55--64 years, accounting for 22,625 YPLL (mean per decedent: 5.7). Among CWP decedents aged 25--64 years, 3,954 (99.3%) were male and 3,891 (97.7%) were white, accounting for 22,283 (98.5%) and 21,893 (96.8%) YPLL, respectively (Table). The mean YPLL per decedent was greatest for the few females (11.8) and blacks (8.1).
Overall, CWP deaths among U.S. residents aged ≥25 years declined 73%, from an average of 1,106.2 per year during 1968--1972 to 300.0 per year during 2002--2006 (regression trend, p<0.001). Age-adjusted death rates among residents aged 25--64 years declined 96%, from 1.78 per million in 1968 to 0.07 in 2006; age-adjusted death rates among residents aged ≥65 years declined 84%, from 6.24 per million in 1968 to 1.02 in 2006 (Figure 1).
CWP-attributable YPLL varied annually, from a high of 1,768 (mean per decedent: 6.0) in 1970 to a low of 66 (mean per decedent: 5.5) in 2001 (Figure 2). YPLL increased from 66 in 2001 to 198 in 2005, and then declined to 169 in 2006. Overall, YPLL decreased 91%, from an average of 1,484.2 per year during 1968--1972 to 153.8 per year during 2002--2006 (regression trend, p<0.001). The mean YPLL per decedent increased 47%, from 5.3 per decedent during 1968--1972 to 7.8 during 2002--2006 (regression trend, p<0.001). During 1968--2006, CWP deaths in Pennsylvania (2,845; 15,420 YPLL), West Virginia (281; 1,640 YPLL), Virginia (191; 1,314 YPLL), Kentucky (209; 1,273 YPLL), and Ohio (91; 543 YPLL) accounted for 90.8% of all decedents aged 25--64 years with CWP as the underlying cause of death and 89.2% of the total YPLL attributed to CWP (Table).
Reported by: JM Mazurek, MD, AS Laney, PhD, JM Wood, MS, Div of Respiratory Disease Studies, National Institute for Occupational Safety and Health, CDC.
Editorial Note:
Age-adjusted CWP death rates have declined dramatically during the past 38 years (1968--2006) in the United States, and annual CWP-attributable YPLL before age 65 years also have decreased, from a high of nearly 1,800 in 1970 to a low of 66 in 2001. However, the findings in this report indicate that YPLL before age 65 years have been increasing since 2002. This is consistent with the observed increase in the percentage of underground coal miners identified with CWP, in particular among younger workers (2,4). In addition, the mean YPLL per decedent has been increasing since the early 1990s, and, like annual YPLL, has increased more sharply since 2002. Continuing surveillance of CWP deaths is needed to ascertain whether these trends will continue and to promote safer work environments.
One cause of the increased YPLL in recent years might be greater exposure of workers to coal dust. Inadequate enforcement standards (i.e., exposure limits that are too high) and unrepresentative dust measurements (i.e., dust levels reported for enforcement purposes that do not reflect individual exposure) might contribute to the continued occurrence of CWP-attributable YPLL (2). Additionally, increased coal production per shift** (5) can make dust suppression more difficult. Technology advances aimed at improving the health of coal workers in the United States, including improvements in ventilation systems and the development of dust suppression devices, might not be keeping pace with technology advances that have increased production (6). Larger, more powerful machines generate larger quantities of dust in shorter periods, potentially exposing workers to higher concentrations of dust (7). Among coal mine dust samples collected by Mine Safety and Health Administration inspectors during 1995--2003, 24.6% exceeded the NIOSH recommended exposure limit of 1.0 mg/m3 for respirable coal dust (4). Dust hazards also might increase when workers cut into quartz-bearing rock in thin-seam underground mines, which creates maintenance problems for the machine and dust control systems, and is associated with high exposure to silica dust (1,2).
In addition, the total number of hours worked in underground coal mines increased 25.6%, from an annual average of 1,671 per miner during 1978--1982 to 2,099 per miner during 2003--2007 (5). Increased hours of work can result in increased inhaled dust, which might exceed the lungs' ability to remove dust. CWP survival decreases with increasing dust exposure (1). Finally, another cause of increased CWP-attributable YPLL could be missed opportunities by miners for early disease screening, which could exacerbate disease progression (1,2).
The findings in this report are subject to at least five limitations. First, this report used a death certificate--based definition of CWP as the underlying cause of death. Because some deaths from CWP might have been attributed to other diseases (e.g., unspecified pneumoconiosis or silicosis) instead of to CWP, the findings in this report likely underestimate deaths and YPLL attributable to CWP. Second, complete work histories are not listed on death certificates, and the relevance of the reported usual industry and occupation to actual hazardous exposures could not be verified. Although no studies have examined the accuracy of usual industry and occupation information on death certificates specifically for CWP decedents, research suggests a generally good agreement of this information compared with that from other sources (8). Third, the state issuing a death certificate is not always the state in which the decedent's coal dust exposure occurred. Fourth, although women and blacks appeared to die earlier from CWP than men and other races, this observation was based on a small percentage of overall deaths. However, a similar effect has been observed for silicosis deaths (9). Finally, ICD cause-of-death codes used in this analysis changed twice during 1968--2005. Slight differences exist in the ICD coding for CWP between the 8th and 9th revisions. In the 9th and 10th revisions, the rubric for code 500 is "coal workers' pneumoconiosis," whereas the 8th revision used "anthracosilicosis." The overall effect of this change is unclear but might have resulted in an increase in the number of cases between the 8th and 9th revisions (i.e., between 1978 and 1979).
The continuing occurrence of fatal cases of CWP (CWP-attributable YPLL) underscores the need for increased efforts to prevent this disease. In 2006, NIOSH published the results of a collaborative study designed to verify the performance of the personal respirable dust monitor in laboratory and underground coal mine environments. The monitor was shown to be acceptable to miners and accurate, precise, and durable in providing continuous exposure information previously not available to coal miners and coal mine operators. Use of the monitor can assist in rapid action to correct adverse conditions (10).
CDC continues to conduct surveillance for CWP deaths to follow future trends and to identify problems. Guidance for persons concerned about exposure to coal mine dust, and for health-care providers about working with potentially exposed patients, is available at http://www.cdc.gov/niosh/topics/pneumoconioses.
Acknowledgments
This report is based, in part, on contributions by EL Petsonk, MD, West Virginia University, and MD Attfield, PhD, National Institute for Occupational Safety and Health, CDC.
References
- Attfield M, Wagner GR. Coal. In: Harber P, Schenker MB, Balmes JR, eds. Occupational and environmental respiratory disease. St. Louis, MO: Mosby; 1996:362--72.
- CDC. Advanced pneumoconiosis among working underground coal miners---eastern Kentucky and southwestern Virginia, 2006. MMWR 2007;56:652--5.
- Wise RP, Livengood JR, Berkelman RL, Goodman RA. Methodological alternatives for measuring premature mortality. Am J Prev Med 1988;4:268--73.
- CDC. Work-related lung disease surveillance report 2007. Cincinnati, OH: US Department of Health and Human Services, CDC; 2008. DHHS (NIOSH) publication no. 2008-143a. Available at http://www.cdc.gov/niosh/docs/2008-143. Accessed December 17, 2009
- Mine Safety and Health Administration. Mining industry accident, injuries, employment, and production statistics. All coal mining data. Arlington, VA: US Department of Labor, Mine Safety and Health Administration; 2008. Available at http://www.msha.gov/accinj/bothcl.htm. Accessed December 17, 2009.
- Chekan GJ, Rider JP, Listak JM, Colinet JF, Potts JD. Impact of air velocity and support advance on shield-generated dust. 2009 SME Annual Meeting and Exhibit, February 22--25, Denver, Colorado, preprint 09-087. Littleton, CO: Society for Mining, Metallurgy, and Exploration; 2009:1--5. Available at http://www.cdc.gov/niosh/mining/pubs/pdfs/ioava.pdf. Accessed December 17, 2009.
- Suttill KR. Surface-mine loaders get bigger, stronger, smarter, and faster---engineering enhancements and increased versatility improve performance. Eng Min J 1988;189:56--61.
- Steenland K, Beaumont J. The accuracy of occupation and industry data on death certificates. J Occup Med 1984;26:288--296.
- Mazurek JM, Attfield MD. Silicosis mortality among young adults in the United States, 1968--2004. Am J Ind Med. 2008;51:568--78.
- Volkwein JC, Vinson RP, Page SJ, et al. Laboratory and field performance of a continuously measuring personal respirable dust monitor. Pittsburgh, PA: US Department of Health and Human Services, CDC; 2006. DHHS (NIOSH) publication no. 2006-145. Available at http://www.cdc.gov/niosh/mining/pubs/pdfs/2006-145.pdf. Accessed December 17, 2009.
* Information available at http://webappa.cdc.gov/ords/norms.html.
† Underlying cause of death is defined as "the disease or injury which initiated the train of morbid events leading directly to death, or the circumstances of the accident or violence which produced the fatal injury," in accordance with ICD guidance. Additional information available at http://www.cdc.gov/nchs/injury/injury_mortality.htm.
§ ICDA-8 code 515.1 (anthracosilicosis) for years 1968--1978, ICD-9 code 500 (coal workers' pneumoconiosis) for years 1979--1998, and ICD-10 code J60 (coal workers' pneumoconiosis) for years 1999--2006.
¶ Multiple cause-of-death data code-field "entity axis" includes information on all of the diseases, injuries, or medical complications, and the location (part, line, and sequence) of the information recorded on each death certificate. Data available at http://www.cdc.gov/nchs/about/major/dvs/mcd/msb.htm.
** Previously, NIOSH examined industry and occupation data for the 4,893 CWP deaths that occurred during 1990--1999, the most recent year for which such data are available. After 1999, coding information for industry and occupation were no longer available. Among all industries reported, the greatest significant proportionate mortality ratio (PMR) was found for coal mining (53.2; 95% confidence interval [CI] = 51.5--54.9), and among all occupations reported, the greatest significant PMR was for mining machine operators (51.7; CI = 50.0--53.4) (5).
|
What is already known on this topic? Coal workers' pneumoconiosis (CWP) is an occupational lung disease that can lead to disability and premature mortality but is preventable through appropriate control of coal mine dust exposures. What is added by this report? The annual years of potential life lost before age 65 years (YPLL) attributed to CWP decreased 91.2%, from an average of 1,484 YPLL per year during 1968--1972 to 154 per year during 2002--2006; however, both YPLL and mean YPLL per decedent have been increasing since 2002, from 135 to 169 YPLL in 2006 and from 4.9 in 2002 to 9.4 YPLL in 2006. What are the implications for public health practice? Prevention and elimination efforts for CWP should be strengthened, and surveillance for CWP deaths should continue to follow future trends. |
FIGURE 1. Age-adjusted death rates* (per million) for decedents aged ≥25 years with coal workers' pneumoconiosis as the underlying cause of death --- United States, 1968--2006
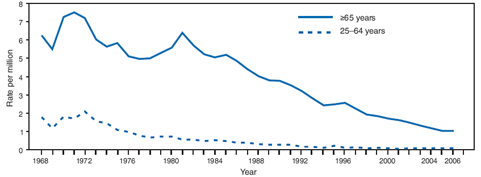
* Based on annual multiple cause-of-death data, National Center for Health Statistics, CDC.
Alternative Text: The figure above shows age-adjusted death rates (per million) for decedents aged ≥25 years with coal workers' pneumoconiosis as the underlying cause of death in the United States from 1968-2006. Overall, CWP deaths among U.S. residents aged ≥25 years declined 73%, from an average of 1,106.2 per year during 1968-1972 to 300.0 per year during 2002-2006. Age-adjusted death rates among residents aged 25-64 years declined 96%, from 1.78 per million in 1968 to 0.07 in 2006; age-adjusted death rates among residents aged ≥65 years declined 84%, from 6.24 per million in 1968 to 1.02 in 2006.
FIGURE 2. Years of potential life lost (YPLL) before age 65 years and mean YPLL per decedent* for decedents aged ≥25 years with coal workers' pneumoconiosis as the underlying cause of death --- United States, 1968--2006
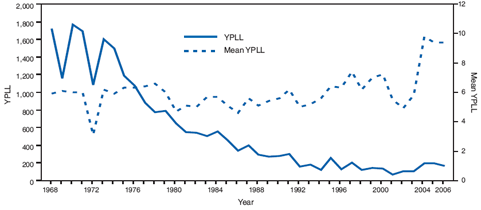
* Based on annual underlying cause of death obtained from multiple cause-of-death data files, National Center for Health Statistics, CDC.
Alternative Text: The figure above shows years of potential life lost (YPLL) before age 65 years and mean YPLL per decedent for decedents aged ≥25 years with coal workers' pneumoconiosis as the underlying cause of death in the United States from 1968-2006. CWP-attributable YPLL varied annually, from a high of 1,768 (mean per decedent: 6.0) in 1970 to a low of 66 (mean per decedent: 5.5) in 2001. YPLL increased from 66 in 2001 to 198 in 2005, and then declined to 169 in 2006. Overall, YPLL decreased 91%, from an average of 1,484.2 per year during 1968-1972 to 153.8 per year during 2002-2006. The mean YPLL per decedent increased 47%, from 5.3 per decedent during 1968-1972 to7.8 during 2002-2006.
Use of trade names and commercial sources is for identification only and does not imply endorsement by the U.S. Department of
Health and Human Services. |
All MMWR HTML versions of articles are electronic conversions from typeset documents. This conversion might result in character translation or format errors in the HTML version. Users are referred to the electronic PDF version (http://www.cdc.gov/mmwr) and/or the original MMWR paper copy for printable versions of official text, figures, and tables. An original paper copy of this issue can be obtained from the Superintendent of Documents, U.S. Government Printing Office (GPO), Washington, DC 20402-9371; telephone: (202) 512-1800. Contact GPO for current prices.
**Questions or messages regarding errors in formatting should be addressed to mmwrq@cdc.gov.Date last reviewed: 12/23/2009