Persons using assistive technology might not be able to fully access information in this file. For assistance, please send e-mail to: mmwrq@cdc.gov. Type 508 Accommodation and the title of the report in the subject line of e-mail.
Update: Influenza Activity --- United States, April--August 2009
On September 10, this report was posted as an MMWR Early Release on the MMWR website (http://www.cdc.gov/mmwr).
The first 2009 pandemic influenza A (H1N1) virus infections were identified in the United States in April 2009 (1). By August, the cumulative number of infections in the United States was estimated to be at least 1 million.* This report provides an overview of influenza activity during April--August 2009 and recommendations for the upcoming 2009--10 influenza season. Pandemic H1N1 influenza activity peaked in the United States during May and June and declined during July and early August. However, levels of influenza activity remained above normal for summer months, and focal outbreaks were reported throughout the summer. During the last 2 weeks of August, pandemic H1N1 influenza activity increased in certain areas of the United States. Clinicians and public health officials should be aware that these recent increases might signal an early start to the 2009--10 influenza season, with pandemic H1N1 influenza viruses predominating at least initially.
In the United States, CDC's National Influenza Surveillance System consists of nine different systems that monitor influenza viruses and the geographic spread and level of influenza activity. In addition to these ongoing systems, in April 2009, in response to the emergence and spread of the pandemic H1N1 virus, the states and CDC implemented line-listed reporting for cases of pandemic H1N1. In May, this system transitioned to include aggregate counts of pandemic H1N1 influenza cases, hospitalizations, and deaths. On July 24, CDC recommended that states discontinue reporting of individual confirmed and probable cases of pandemic H1N1 virus infection but to continue to provide aggregate reports of influenza-associated hospitalizations and deaths. From mid-April to August 30, a total of 9,079 hospitalizations and 593 deaths associated with laboratory-confirmed 2009 pandemic influenza A (H1N1) virus infections were reported to CDC.
World Health Organization and National Respiratory and Enteric Virus Surveillance System collaborating laboratories located in all 50 states and the District of Columbia report to CDC the number of respiratory specimens tested for influenza and the number positive by influenza type and subtype. Since May 3, the majority of influenza viruses identified have been pandemic H1N1 influenza A viruses. As of September 4, all of the influenza A H1N1 viruses characterized at CDC have been related antigenically to the reference strain chosen for the influenza A (H1N1) monovalent vaccine: A/California/7/2009(H1N1)pdm. Of 1,372 pandemic H1N1 viruses tested for antiviral resistance at CDC from ill persons in the United States, 1,364 (99.4%) have been susceptible to oseltamivir. All eight pandemic H1N1 viruses found to be resistant to oseltamivir were obtained from persons taking oseltamivir for treatment or prophylaxis at the time of specimen collection. All viruses tested have been susceptible to zanamivir, and all have been resistant to amantadine and rimantadine.
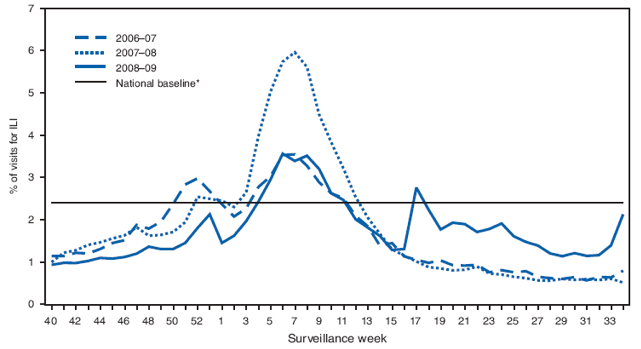
Outpatient visits to health-care providers for influenza-like illness (ILI) are monitored in the United States through the Outpatient Influenza-like Illness Surveillance Network (ILINet). Visits to health-care providers were highest in February during the 2008--09 influenza season, but rose again in May 2009 after the 2009 H1N1 virus emerged (Figure 1). Visits to health-care providers for ILI were higher than usual in the summer and increased during the last 2 weeks of August. During that period, the proportion of outpatient visits for ILI in Department of Health and Human Services Region IV (Alabama, Florida, Georgia, Kentucky, Mississippi, North Carolina, South Carolina, and Tennessee) increased to a level usually seen only during peak winter periods.
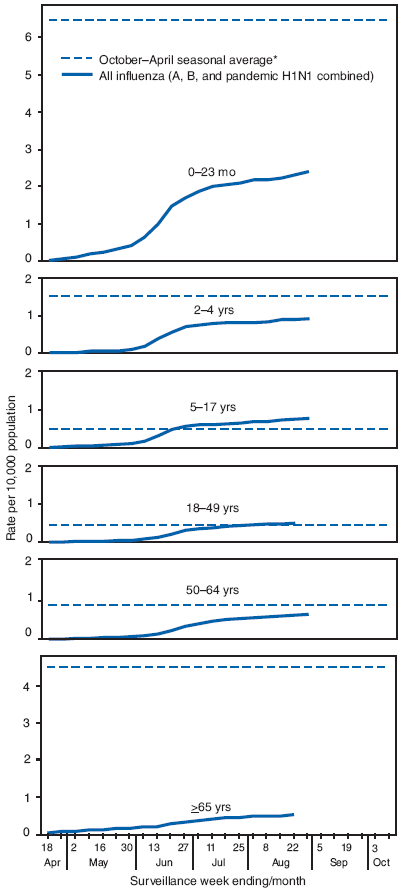
Laboratory-confirmed influenza-associated hospitalizations are monitored in two population-based surveillance networks: the New Vaccine Surveillance Network and the Emerging Infections Program. Total influenza hospitalization rates by age group for adults and children during April--August generally were similar to or lower than seasonal influenza hospitalization rates but were higher than usual for that period. (Figure 2).
Data from the 122 Cities Mortality Reporting System indicate that the proportion of deaths attributed to pneumonia and influenza was within the bounds of what is expected in the summer and did not exceed the epidemic threshold for 2 or more consecutive weeks at any time during April--August. However, 47 pediatric deaths associated with laboratory-confirmed pandemic H1N1 influenza occurred during April 26--August 29 and were reported to CDC.
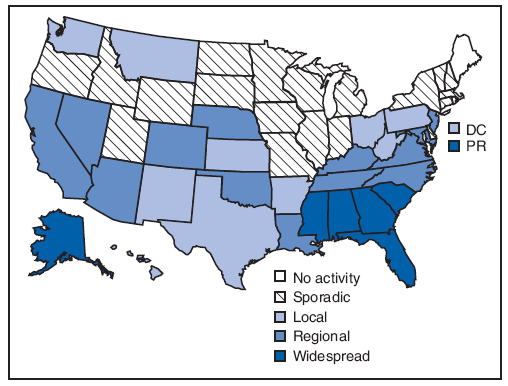
Six states (Alabama, Alaska, Florida, Georgia, Mississippi, and South Carolina) and Puerto Rico reported widespread influenza activity for the most recent reporting week (August 23--29) (Figure 3). Any widespread influenza activity in August is uncommon. Thirteen additional states reported regional influenza activity.
Reported by: L Finelli, DrPH, L Brammer, MPH, L Blanton, MPH, S Epperson, MPH, R Dhara, MPH, A Fowlkes, MPH, D Mustaquim, MPH, L Kamimoto, MD, K Kniss, MPH, A Klimov, PhD, L Gubareva, PhD, A Fry, MD, A Fiore, MD, D Jernigan, MD, J Bresee, MD, Influenza Div; D Swerdlow, MD, National Center for Immunization and Respiratory Diseases, CDC.
Editorial Note:
Influenza activity during April--August 2009 was higher than expected for this period in all surveillance systems except for the 122 Cities Mortality Reporting System, and 2009 pandemic influenza A (H1N1) virus has continued to circulate as the predominant influenza virus. During the last 2 weeks of August, influenza activity increased in the southeastern United States to levels of ILI usually seen during winter seasonal influenza peaks. This increase might signal that other areas of the country also will have early influenza activity during the 2009--10 influenza season. Physicians, businesses, schools, and others are reminded that the timing and severity of influenza activity can be unpredictable, but that increased influenza activity resulting from pandemic H1N1, in addition to the usual seasonal influenza viruses, is expected this season. Changes in geographic spread of the virus will be monitored and reported weekly in the online FluView report.† Regular updates will be published in MMWR during the season as well. Additional guidance for this influenza season also is available online.§
CDC recently issued updated guidance to schools, universities, child care and early education programs, and businesses regarding methods to limit the spread of influenza in each of these settings (2--4). These guidance documents stress actions that will limit exposure to potentially infectious persons, such as the recommendation to stay home when ill and the separation of ill persons from well persons. CDC also updated recommendations for the amount of time a person with ILI should remain at home and away from school and work (5). CDC currently recommends that persons with ILI stay home for 24 hours after they are free from fever (100°F[37.8°C]) without taking fever-reducing medications. In addition, strict adherence to respiratory etiquette and hand hygiene should be stressed in school and work settings and in other settings where close contact between persons can occur.
Updated guidance on the use of influenza antiviral medications was issued by CDC on September 8 (6). Early treatment of all persons with severe illness from suspected or confirmed influenza, including those who are hospitalized, is recommended. In addition, this guidance recommends the early evaluation and treatment of persons with suspected influenza who are at greater risk for influenza-associated complications.¶ However, most healthy children, adolescents, and adults with uncomplicated influenza-like illness do not require antiviral treatment. Approximately 97% of all influenza viruses currently circulating in the United States are pandemic H1N1 viruses that are sensitive to oseltamivir or zanamivir. Thus, CDC recommends either oseltamivir or zanamivir for treatment or chemoprophylaxis for influenza when use of antiviral medications is indicated. Clinical judgment always is an important component of treatment decision-making for persons who present with suspected influenza. When treatment is given, efforts to ensure that treatment is started as early as possible after symptom onset are critical.
The best means to prevent influenza illness is vaccination. CDC continues to recommend vaccination against seasonal influenza viruses, especially for all children, persons aged ≥50 years, and persons at greater risk for influenza complications (7). Seasonal influenza vaccines are widely available now. Vaccines against the pandemic H1N1 influenza virus are expected to be available by mid-October and will be administered as separate vaccinations. The pandemic H1N1 monovalent vaccine is being prepared by the same manufacturers as the seasonal influenza vaccine. Many persons will be recommended to receive both the seasonal influenza vaccine and the pandemic H1N1 vaccine. During the early phase of vaccine availability, the number of pandemic H1N1 vaccine doses will not be enough to vaccinate the entire U.S. population. The Advisory Committee on Immunization Safety has recommended that immunization programs focus initially on providing protection for persons who are at greater risk for infection or influenza complications, including pregnant women, household contacts and caregivers for children aged <6 months, health-care and emergency medical services personnel, all persons aged 6 months--24 years, and persons aged 25--64 years who have health conditions associated with greater risk for medical complications from influenza (8).
The Council of State and Territorial Epidemiologists and CDC have developed new case definitions for aggregate reporting of influenza-associated hospitalizations and deaths for the 2009--10 influenza season. These new case definitions will be implemented for the week ending September 5 (surveillance week 35). For aggregate reporting purposes, the 2008--09 influenza season was closed out on August 30; the total aggregate numbers of hospitalizations and deaths associated with pandemic H1N1 were reported on September 4. The first week of reporting influenza-associated hospitalizations and deaths for the 2009--10 season will include both seasonal and pandemic H1N1--associated hospitalizations and deaths, and will be reported on September 11.
References
- CDC. Swine influenza A (H1N1) infection in two children---southern California, March--April 2009. MMWR 2009;58:400--2.
- CDC. CDC guidance for state and local public health officials and school administrators for school (K-12) responses to influenza during the 2009--2010 school year. Atlanta, GA: CDC; August 31, 2009. Available at http://www.cdc.gov/h1n1flu/schools/schoolguidance.htm.
- CDC. CDC guidance for responses to influenza for institutions of higher education during the 2009--2010 academic year. Atlanta, GA: CDC; August 26, 2009. Available at http://www.cdc.gov/h1n1flu/institutions/guidance.
- CDC. CDC guidance on helping child care and early childhood programs respond to influenza during the 2009--2010 influenza season. Atlanta, GA: CDC; September 4, 2009. Available at http://www.cdc.gov/h1n1flu/childcare/guidance.htm.
- CDC. CDC recommendations for the amount of time persons with influenza-like illness should be away from others. Atlanta, GA: CDC; August 5, 2009. Available at http://www.cdc.gov/h1n1flu/guidance/exclusion.htm.
- CDC. Updated interim recommendations for the use of antiviral medications in the treatment and prevention of influenza for the 2009--2010 season. Atlanta, GA: CDC; September 8, 2009. Available at http://www.cdc.gov/h1n1flu/recommendations.htm.
- CDC. Prevention and control of seasonal influenza with vaccines: recommendations of the advisory committee on immunization practices (ACIP), 2009. MMWR 2009;58(No. RR-8).
- CDC. Novel H1N1 vaccination recommendations. Atlanta, GA: CDC; July 30, 2009. Available at http://www.cdc.gov/h1n1flu/vaccination/acip.htm.