
Persons using assistive technology might not be able to fully access information in this file. For assistance, please send e-mail to: mmwrq@cdc.gov. Type 508 Accommodation and the title of the report in the subject line of e-mail.
Malignant Mesothelioma Mortality --- United States, 1999--2005
Malignant mesothelioma is a fatal cancer primarily associated with exposure to asbestos. The latency period between first exposure to asbestos and clinical disease usually is 20--40 years (1). Although asbestos is no longer mined in the United States, the mineral is still imported, and a substantial amount of asbestos remaining in buildings eventually will be removed, either during remediation or demolition. Currently, an estimated 1.3 million construction and general industry workers potentially are being exposed to asbestos (2). To characterize mortality attributed to mesothelioma, CDC's National Institute for Occupational Safety and Health (NIOSH) analyzed annual multiple-cause-of-death records for 1999--2005, the most recent years for which complete data are available.* For those years, a total of 18,068 deaths of persons with malignant mesothelioma were reported, increasing from 2,482 deaths in 1999 to 2,704 in 2005, but the annual death rate was stable (14.1 per million in 1999 and 14.0 in 2005). Maintenance, renovation, or demolition activities that might disturb asbestos should be performed with precautions that sufficiently prevent exposures for workers and the public. In addition, physicians should document the occupational history of all suspected and confirmed mesothelioma cases.
Asbestos was used in a wide variety of construction and manufacturing applications through most of the 20th century. In the United States, asbestos use peaked at 803,000 metric tons in 1973 and then declined to approximately 1,700 metric tons in 2007 (Figure 1) (3).
For this report, malignant mesothelioma deaths were identified for 1999--2005 from death certificates and included any deaths for which International Classification of Diseases, 10th Revision (ICD-10) codes† for malignant mesothelioma were listed in the multiple-cause-of-death mortality data entity axis.§ Because mesothelioma predominantly is associated with occupational exposure and has a long latency, the analysis was restricted to deaths of persons aged ≥25 years. The annual death rate per 1 million persons aged ≥25 years was calculated using the July 1 population estimates for each year provided by the U.S. Census Bureau. Overall death rates were calculated based on the 2002 census population.
During 1999--2005, a total of 18,068 malignant mesothelioma deaths were reported in the United States; 14,591 (80.8%) occurred among males and 17,180 (95.1%) among whites (Table). Mesothelioma deaths were classified as mesothelioma of pleura (1,572; 8.7%), peritoneum (657; 3.6%), other anatomical site (2,605; 14.4%), and unspecified anatomical site (13,454; 74.5%).¶ Mortality increased with age, with the greatest number of decedents aged ≥75 years; 311 deaths (1.7%) occurred in persons aged ≤44 years. From 1999 to 2005, the total number of malignant mesothelioma deaths increased 8.9%, from 2,482 in 1999 to 2,704 in 2005, but the annual death rate was stable (14.1 per million population in 1999 versus 14.0 in 2005). The death rate for males was 4.5 times that for females (23.2 versus 5.1 per million). During 1999--2005, the state death rate was greater than the national rate (13.8 per million population per year) in 26 states; in six states the rate exceeded 20 per million per year (Figure 2): Maine (173 deaths; rate: 27.5), Wyoming (50; 22.2), West Virginia (182; 21.0), Pennsylvania (1,210; 20.8), New Jersey (814; 20.2), and Washington (558; 20.1).
Reported by: KM Bang, PhD, JM Mazurek, MD, E Storey, MD, MD Attfield, PhD, PL Schleiff, MS, JM Wood, MS, Div of Respiratory Disease Studies, JT Wassell, PhD, Div of Safety Research, National Institute for Occupational Safety and Health, CDC.
Editorial Note:
Despite regulatory actions and the sharp decline in use of asbestos, potential exposure to asbestos continues, but most deaths from mesothelioma in the United States derive from exposures decades ago. Because mesothelioma manifests 20--40 years after first exposure, the number of mesothelioma deaths will likely peak by 2010 (4). The analysis described in this report indicates that the annual number of mesothelioma deaths is still increasing, and future cases will continue to reflect the extensive past use of asbestos. New cases also might result through occupational and environmental exposure to asbestos during remediation and demolition of existing asbestos in buildings if controls are insufficient to protect workers and the surrounding community.
The annual number of mesothelioma cases increased significantly from the late 1970s through the mid-1990s (4). Projections indicate that the number of mesothelioma cases involving males peaked during 2000--2004 at more than 2,000 cases and should be declining, with an expected return to background levels by 2055. The number of mesothelioma cases involving females (approximately 560 in 2003) is projected to increase slightly over time as a function of population size and shifting age distribution (4).
Previously, NIOSH examined industry and occupation data for 541 of the 2,482 mesothelioma deaths that occurred in 1999, the most recent year for which such data are available. After 1999, coding information for industry and occupation were no longer available. Of 130 industries reported, significant proportionate mortality ratios (PMRs) were found for ship and boat building and repairing (6.0; 95% confidence interval [CI] = 2.4--12.3); industrial and miscellaneous chemicals (4.8; CI = 2.9--7.5); petroleum refining (3.8; CI 1.2--8.9); electric light and power (3.1; CI = 1.5--5.7); and construction (1.6; CI = 1.2--1.9). Of 163 occupations reported, significant PMRs were found for plumbers, pipefitters, and steamfitters (4.8; CI = 2.8--7.5); mechanical engineers (3.0; CI = 1.1--6.6); electricians (2.4; CI = 1.3--4.2); and elementary school teachers (2.1; CI = 1.1--3.6) (5).
Over the decades, the Occupational Safety and Health Administration (OSHA) and the Environmental Protection Agency have taken various regulatory actions to control occupational exposure to asbestos (6). OSHA established a permissible exposure limit (PEL) for asbestos in 1971. This standard set the PEL at 12 fibers per cubic centimeter (f/cc) of air.** This initial PEL was reduced to 5 f/cc in 1972, 2 f/cc in 1976, 0.2 f/cc in 1986, and 0.1 f/cc in 1994 (7). Inspection data for 1979--2003 show a general decline in asbestos exposure levels and in the percentage of samples exceeding designated occupational exposure limits in construction, manufacturing, mining, and other industries (5). However, in 2003, 20% of air samples collected in the construction industry exceeded the OSHA PEL (5).
The findings in this report are subject to at least three limitations. First, death certificates do not include information on exposure to asbestos or a specific work history. This limits identification of industries and occupations associated with mesothelioma. Second, the state of residence issuing death certificate might not always be the state in which the decedent's exposures occurred, which might affect state death rates. Finally, some mesothelioma cases might be misdiagnosed and assigned less specific ICD codes (e.g., ICD-10 code C76, malignant neoplasm of other and ill-defined sites), and consequently not be captured in this analysis (8).
Although asbestos has been eliminated in the manufacture of many products, it is still being imported (approximately 1,730 metric tons in 2007) and used in the United States (3) in various construction and transportation products (6). Ensuring a future decrease in mesothelioma mortality requires meticulous control of exposures to asbestos and other materials that might cause mesothelioma. Recent studies suggest that carbon nanotubes (fiber-shaped nanoparticles), which are increasingly being used in manufacturing (9), might share the carcinogenic mechanism postulated for asbestos and induce mesothelioma (10), underscoring the need for documentation of occupational history in future cases. Capturing occupational history information for mesothelioma cases is important to identify industries and occupations placing workers at risk for this lethal disease.
Acknowledgments
This report is based, in part, on contributions from G Syamlal, MBBS, and D Sharp, MD, National Institute for Occupational Safety and Health, CDC.
References
- Lanphear BP, Buncher CR. Latent period for malignant mesothelioma of occupational origin. J Occup Med 1992;34:718--21.
- Occupational Safety and Health Administration. Safety and health topics: asbestos; 2009. Available at http://www.osha.gov/SLTC/asbestos.
- Kelly TD, Matos GR. Historical statistics for mineral and material commodities in the United States. US Geological Survey data series 140. Reston, VA: US Department of the Interior, US Geological Survey; 2005. Available at http://minerals.usgs.gov/ds/2005/140.
- Price B, Ware A. Mesothelioma trends in the United States: an update based on surveillance, epidemiology, and end results program data for 1973 through 2003. Am J Epidemiol 2004;159:107--12.
- CDC. Work-related lung disease surveillance report 2007. Cincinnati, OH: US Department of Health and Human Services, CDC, National Institute for Occupational Safety and Health; 2008. Available at http://www.cdc.gov/niosh/docs/2008-143.
- Environmental Protection Agency. EPA asbestos materials bans: clarification. Washington, DC: Environmental Protection Agency; 1999. Available at http://www.epa.gov/oppt/asbestos/pubs/asbbans2.pdf.
- Martonik JF, Nash E, Grossman E. The history of OSHA's asbestos rule makings and some distinctive approaches that they introduced for regulating occupational exposure to toxic substances. AIHAJ 2001;62:208--17.
- Gordon GJ, Jensen RV, Hsiao LL, et al. Translation of microarray data into clinically relevant cancer diagnostic tests using gene expression ratios in lung cancer and mesothelioma. Cancer Res 2002;62:4963--7.
- CDC. Approaches to safe nanotechnology. Managing the health and safety concerns associated with engineered nanomaterials. Cincinnati, OH: US Department of Health and Human Services, CDC, National Institute for Occupational Safety and Health; 2009. Available at http://www.cdc.gov/niosh/docs/2009-125/pdfs/2009-125.pdf.
- Takagi A, Hirose A, Nishimura T, et al. Induction of mesothelioma in p53+/- mouse by intraperitoneal application of multi-wall carbon nanotube. J Toxicol Sci 2008;33:105--16.
* Since 1968, CDC's National Center for Health Statistics (NCHS) has compiled multiple-cause-of-death data annually from death certificates in the United States. CDC's NIOSH extracts information on deaths from occupationally related respiratory diseases and conditions from the NCHS data and stores the information in the National Occupational Respiratory Mortality System, available at http://webappa.cdc.gov/ords/norms.html.
† Codes C45.0 (mesothelioma of pleura), C45.1 (mesothelioma of peritoneum), C45.2 (mesothelioma of pericardium), C45.7 (mesothelioma of other sites), and C45.9 (mesothelioma, unspecified).
§ Entity axis includes information on all of the diseases, injuries, or medical complications, and the location (part, line, and sequence) of the information recorded on each certificate. Detail record layouts available at http://www.cdc.gov/nchs/about/major/dvs/mcd/msb.htm.
¶ The sum of individual site death totals is greater than the total number of deaths because some decedents have more than one site of mesothelioma listed on their death certificates.
** As an 8-hour time-weighted average based on the 1968 American Conference of Government Industrial Hygienists threshold limit value.
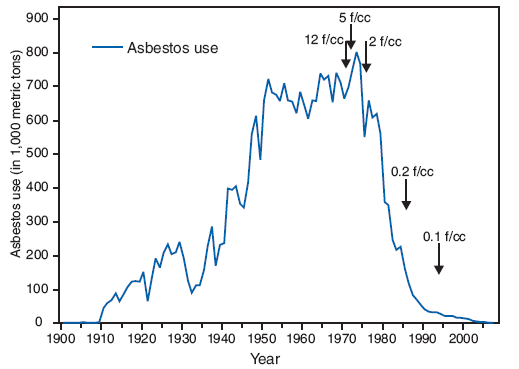
The figure above shows the amount of asbestos use, in thousands of metric tons, and the Occupational Safety and Health permissible asbsestos exposure limits in the United States during 1900–2007. Asbestos use increased from 1,000 metric tons in 1900 to a peak of 803,000 metric tons in 1973, then decreased to approximately 1,700 metric tons in 2007.
Permissible asbestos exposure limits were 12 fibers per cubic centimeter in 1971, 5 fibers in 1972, 2 fibers in 1976, 0.2 fibers in 1986, and 0.1 fibers in 1994.* Arrows indicate year when the Occupational Safety and Health Administration permissible exposure limits were put in place (12 fibers per cubic centimeter [f/cc] in 1971, 5 f/cc in 1972, 2 f/cc in 1976, 0.2 f/cc in 1986, and 0.1 f/cc in 1994).
FIGURE 2. Malignant mesothelioma death rate per 1 million population,* by state --- United States, 1999--2005
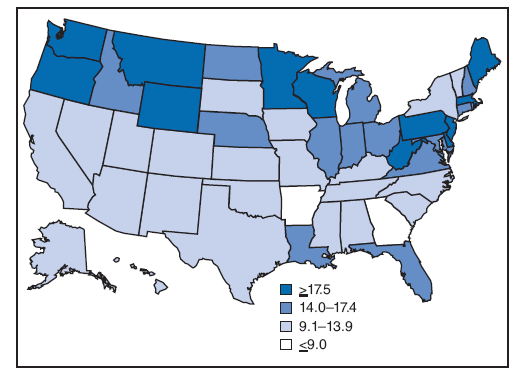
The figure above shows a map of the United States and indicates the malignant mesothelioma death rate per 1 million population for each state during 1999–2005. The state death rate was greater than the national rate of 13.8 per million population per year in 26 states; in six states (Maine, New Jersey, Pennsylvania, Washington, Wyoming, and West Virginia) the rate exceeded 20 per million per year.
* Decedents for whom the International Classification of Diseases, 10th Revision codes C45.0 (mesothelioma of pleura), C45.1 (mesothelioma of peritoneum), C45.2 (mesothelioma of pericardium), C45.7 (mesothelioma of other sites), or C45.9 (mesothelioma, unspecified) were listed on death certificates were identified using CDC mortality data for 1999--2005.
Use of trade names and commercial sources is for identification only and does not imply endorsement by the U.S. Department of
Health and Human Services. |
All MMWR HTML versions of articles are electronic conversions from typeset documents. This conversion might result in character translation or format errors in the HTML version. Users are referred to the electronic PDF version (http://www.cdc.gov/mmwr) and/or the original MMWR paper copy for printable versions of official text, figures, and tables. An original paper copy of this issue can be obtained from the Superintendent of Documents, U.S. Government Printing Office (GPO), Washington, DC 20402-9371; telephone: (202) 512-1800. Contact GPO for current prices.
**Questions or messages regarding errors in formatting should be addressed to mmwrq@cdc.gov.Date last reviewed: 4/22/2009