
Persons using assistive technology might not be able to fully access information in this file. For assistance, please send e-mail to: mmwrq@cdc.gov. Type 508 Accommodation and the title of the report in the subject line of e-mail.
Notifiable Diseases/Deaths in Selected Cities Weekly Information
Table I Summary of provisional cases of selected notifiable diseases, United States, cumulative, week ending April 11, 2009 (14th Week)
Figure I Selected notifiable disease reports, United States, comparison of provisional 4-week totals ending April 11, 2009, with historical data
Table II Provisional cases of selected notifiable diseases, United States, weeks ending April 11, 2009 and April 5, 2008 (14th Week)
Table III Deaths in 122 U.S. cities, week ending April 11, 2009 (14th Week)
|
TABLE I. (Continued) Provisional cases of infrequently reported notifiable diseases (<1,000 cases reported during the preceding year) --- United States, week ending April 11, 2009 (14th week)* |
|||||||||
|---|---|---|---|---|---|---|---|---|---|
|
-: No reported cases. N: Not notifiable. Cum: Cumulative year-to-date counts. * Incidence data for reporting year 2008 and 2009 are provisional, whereas data for 2004, 2005, 2006, and 2007 are finalized. † Calculated by summing the incidence counts for the current week, the 2 weeks preceding the current week, and the 2 weeks following the current week, for a total of 5 preceding years. Additional information is available at http://www.cdc.gov/epo/dphsi/phs/files/5yearweeklyaverage.pdf. § Not notifiable in all states. Data from states where the condition is not notifiable are excluded from this table, except starting in 2007 for the domestic arboviral diseases and influenza-associated pediatric mortality, and in 2003 for SARS-CoV. Reporting exceptions are available at http://www.cdc.gov/epo/dphsi/phs/infdis.htm. ¶ Includes both neuroinvasive and nonneuroinvasive. Updated weekly from reports to the Division of Vector-Borne Infectious Diseases, National Center for Zoonotic, Vector-Borne, and Enteric Diseases (ArboNET Surveillance). Data for West Nile virus are available in Table II. ** The names of the reporting categories changed in 2008 as a result of revisions to the case definitions. Cases reported prior to 2008 were reported in the categories: Ehrlichiosis, human monocytic (analogous to E. chaffeensis); Ehrlichiosis, human granulocytic (analogous to Anaplasma phagocytophilum), and Ehrlichiosis, unspecified, or other agent (which included cases unable to be clearly placed in other categories, as well as possible cases of E. ewingii). †† Data for H. influenzae (all ages, all serotypes) are available in Table II. §§ Updated monthly from reports to the Division of HIV/AIDS Prevention, National Center for HIV/AIDS, Viral Hepatitis, STD, and TB Prevention. Implementation of HIV reporting influences the number of cases reported. Updates of pediatric HIV data have been temporarily suspended until upgrading of the national HIV/AIDS surveillance data management system is completed. Data for HIV/AIDS, when available, are displayed in Table IV, which appears quarterly. ¶¶ Updated weekly from reports to the Influenza Division, National Center for Immunization and Respiratory Diseases. Fifty-three influenza-associated pediatric deaths occurring during the 2008-09 influenza season have been reported. *** The one measles case reported for the current week was imported. ††† Data for meningococcal disease (all serogroups) are available in Table II. §§§ In 2008, Q fever acute and chronic reporting categories were recognized as a result of revisions to the Q fever case definition. Prior to that time, case counts were not differentiated with respect to acute and chronic Q fever cases. ¶¶¶ No rubella cases were reported for the current week. **** Updated weekly from reports to the Division of Viral and Rickettsial Diseases, National Center for Zoonotic, Vector-Borne, and Enteric Diseases. |
Figure I. Selected notifiable disease reports, United States, comparison of provisional 4-week totals April 11, 2009, with historical data
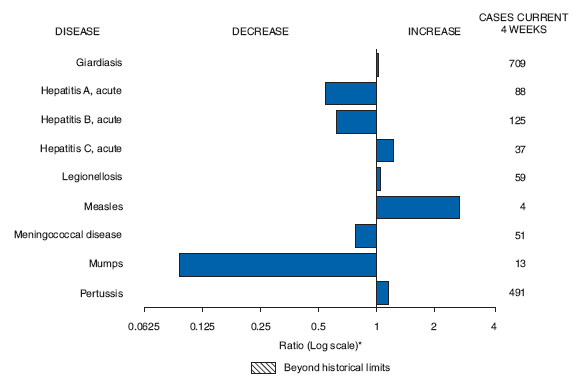
* Ratio of current 4-week total to mean of 15 4-week totals (from previous, comparable, and subsequent 4-week periods for the past 5 years). The point where the hatched area begins is based on the mean and two standard deviations of these 4-week totals.
|
TABLE II. (Continued) Provisional cases of selected notifiable diseases, United States, weeks ending April 11, 2009, and April 5, 2008 (14th week)* |
|||||||||||||||
|---|---|---|---|---|---|---|---|---|---|---|---|---|---|---|---|
|
Reporting area |
Giardiasis |
Gonorrhea |
Haemophilus influenzae, invasive |
||||||||||||
|
Current week |
Previous |
Cum |
Cum |
Current week |
Previous |
Cum |
Cum |
Current week |
Previous |
Cum 2009 |
Cum 2008 |
||||
|
Med |
Max |
Med |
Max |
Med |
Max |
||||||||||
|
United States |
203 |
313 |
632 |
3,576 |
3,794 |
2,327 |
5,829 |
6,842 |
62,951 |
84,769 |
41 |
47 |
109 |
718 |
854 |
|
New England |
9 |
28 |
65 |
292 |
349 |
89 |
100 |
301 |
1,327 |
1,263 |
- |
3 |
17 |
45 |
46 |
|
Connecticut |
- |
6 |
14 |
60 |
81 |
15 |
50 |
275 |
560 |
455 |
- |
0 |
11 |
10 |
1 |
|
Maine§ |
- |
4 |
12 |
49 |
32 |
9 |
2 |
7 |
43 |
24 |
- |
0 |
2 |
5 |
5 |
|
Massachusetts |
8 |
11 |
27 |
117 |
154 |
57 |
38 |
113 |
596 |
653 |
- |
1 |
5 |
26 |
31 |
|
New Hampshire |
- |
3 |
11 |
21 |
28 |
2 |
2 |
6 |
30 |
27 |
- |
0 |
2 |
2 |
5 |
|
Rhode Island§ |
- |
1 |
8 |
11 |
21 |
6 |
5 |
16 |
87 |
94 |
- |
0 |
7 |
1 |
1 |
|
Vermont§ |
1 |
3 |
15 |
34 |
33 |
- |
1 |
3 |
11 |
10 |
- |
0 |
3 |
1 |
3 |
|
Mid. Atlantic |
28 |
61 |
118 |
621 |
747 |
424 |
608 |
1,149 |
7,775 |
8,249 |
8 |
10 |
25 |
132 |
160 |
|
New Jersey |
- |
8 |
20 |
- |
132 |
- |
87 |
144 |
839 |
1,591 |
- |
1 |
7 |
10 |
29 |
|
New York (Upstate) |
18 |
23 |
76 |
283 |
233 |
119 |
116 |
666 |
1,495 |
1,498 |
5 |
3 |
20 |
42 |
38 |
|
New York City |
1 |
15 |
30 |
173 |
203 |
214 |
208 |
584 |
3,053 |
2,124 |
- |
2 |
4 |
16 |
31 |
|
Pennsylvania |
9 |
16 |
46 |
165 |
179 |
91 |
200 |
267 |
2,388 |
3,036 |
3 |
4 |
10 |
64 |
62 |
|
E.N. Central |
29 |
49 |
88 |
498 |
575 |
380 |
1,175 |
1,579 |
11,267 |
18,353 |
3 |
7 |
18 |
76 |
146 |
|
Illinois |
- |
11 |
32 |
62 |
154 |
- |
364 |
480 |
2,670 |
5,104 |
- |
2 |
7 |
20 |
48 |
|
Indiana |
N |
0 |
7 |
N |
N |
130 |
146 |
254 |
1,890 |
2,343 |
- |
1 |
13 |
10 |
31 |
|
Michigan |
2 |
12 |
22 |
131 |
122 |
179 |
312 |
657 |
4,057 |
4,538 |
- |
1 |
2 |
7 |
7 |
|
Ohio |
23 |
17 |
31 |
210 |
213 |
26 |
264 |
531 |
1,518 |
4,683 |
2 |
2 |
6 |
32 |
49 |
|
Wisconsin |
4 |
9 |
20 |
95 |
86 |
45 |
78 |
141 |
1,132 |
1,685 |
1 |
0 |
2 |
7 |
11 |
|
W.N. Central |
54 |
26 |
143 |
319 |
369 |
144 |
315 |
391 |
3,694 |
4,493 |
3 |
3 |
14 |
50 |
62 |
|
Iowa |
3 |
6 |
18 |
63 |
68 |
- |
28 |
53 |
327 |
415 |
- |
0 |
1 |
- |
1 |
|
Kansas |
5 |
3 |
11 |
34 |
26 |
34 |
45 |
83 |
652 |
565 |
1 |
0 |
4 |
7 |
6 |
|
Minnesota |
43 |
0 |
106 |
45 |
115 |
- |
54 |
78 |
438 |
914 |
- |
0 |
10 |
11 |
11 |
|
Missouri |
3 |
8 |
22 |
122 |
95 |
85 |
146 |
193 |
1,807 |
2,124 |
2 |
1 |
4 |
21 |
32 |
|
Nebraska§ |
- |
4 |
10 |
34 |
41 |
20 |
27 |
50 |
364 |
372 |
- |
0 |
2 |
8 |
8 |
|
North Dakota |
- |
0 |
4 |
3 |
8 |
- |
2 |
7 |
6 |
33 |
- |
0 |
3 |
3 |
4 |
|
South Dakota |
- |
2 |
11 |
18 |
16 |
5 |
8 |
20 |
100 |
70 |
- |
0 |
0 |
- |
- |
|
S. Atlantic |
37 |
60 |
108 |
876 |
588 |
656 |
1,277 |
1,722 |
12,892 |
18,957 |
14 |
12 |
24 |
217 |
243 |
|
Delaware |
- |
1 |
3 |
5 |
11 |
9 |
17 |
35 |
223 |
329 |
- |
0 |
2 |
1 |
2 |
|
District of Columbia |
- |
0 |
5 |
- |
10 |
- |
57 |
101 |
774 |
568 |
- |
0 |
2 |
- |
4 |
|
Florida |
31 |
31 |
57 |
497 |
273 |
329 |
428 |
518 |
5,671 |
6,343 |
8 |
4 |
9 |
84 |
57 |
|
Georgia |
- |
9 |
63 |
186 |
136 |
2 |
237 |
484 |
1,013 |
3,564 |
3 |
2 |
9 |
49 |
58 |
|
Maryland§ |
5 |
5 |
10 |
62 |
51 |
132 |
114 |
210 |
1,491 |
1,656 |
2 |
1 |
5 |
29 |
44 |
|
North Carolina |
N |
0 |
0 |
N |
N |
- |
0 |
203 |
- |
1,269 |
- |
1 |
6 |
19 |
23 |
|
South Carolina§ |
1 |
2 |
9 |
28 |
29 |
- |
175 |
325 |
1,852 |
2,694 |
1 |
1 |
7 |
13 |
16 |
|
Virginia§ |
- |
8 |
31 |
87 |
60 |
180 |
181 |
321 |
1,719 |
2,304 |
- |
1 |
5 |
11 |
31 |
|
West Virginia |
- |
1 |
5 |
11 |
18 |
4 |
12 |
26 |
149 |
230 |
- |
0 |
3 |
11 |
8 |
|
E.S. Central |
4 |
8 |
22 |
76 |
107 |
168 |
549 |
771 |
6,798 |
7,847 |
3 |
3 |
6 |
41 |
51 |
|
Alabama§ |
2 |
4 |
12 |
40 |
61 |
- |
174 |
216 |
1,607 |
2,786 |
2 |
0 |
2 |
11 |
6 |
|
Kentucky |
N |
0 |
0 |
N |
N |
16 |
88 |
153 |
914 |
1,060 |
- |
0 |
2 |
2 |
4 |
|
Mississippi |
N |
0 |
0 |
N |
N |
- |
143 |
253 |
1,984 |
1,763 |
- |
0 |
1 |
- |
8 |
|
Tennessee§ |
2 |
4 |
13 |
36 |
46 |
152 |
165 |
301 |
2,293 |
2,238 |
1 |
2 |
5 |
28 |
33 |
|
W.S. Central |
3 |
7 |
21 |
65 |
64 |
93 |
952 |
1,300 |
10,217 |
13,578 |
3 |
2 |
17 |
30 |
37 |
|
Arkansas§ |
- |
2 |
8 |
17 |
26 |
75 |
84 |
167 |
1,186 |
1,284 |
- |
0 |
2 |
3 |
1 |
|
Louisiana |
- |
2 |
10 |
27 |
24 |
1 |
165 |
410 |
1,520 |
2,462 |
- |
0 |
1 |
4 |
3 |
|
Oklahoma |
3 |
3 |
11 |
21 |
14 |
17 |
69 |
142 |
570 |
1,300 |
3 |
1 |
16 |
23 |
29 |
|
Texas§ |
N |
0 |
0 |
N |
N |
- |
605 |
728 |
6,941 |
8,532 |
- |
0 |
1 |
- |
4 |
|
Mountain |
16 |
27 |
62 |
272 |
320 |
83 |
195 |
339 |
1,684 |
3,033 |
4 |
4 |
10 |
88 |
70 |
|
Arizona |
4 |
3 |
8 |
44 |
30 |
27 |
63 |
84 |
567 |
962 |
1 |
0 |
6 |
36 |
- |
|
Colorado |
7 |
10 |
27 |
89 |
111 |
- |
55 |
101 |
205 |
774 |
1 |
1 |
5 |
22 |
25 |
|
Idaho§ |
3 |
3 |
14 |
28 |
34 |
3 |
3 |
13 |
27 |
55 |
- |
0 |
4 |
1 |
1 |
|
Montana§ |
- |
2 |
9 |
24 |
21 |
- |
2 |
6 |
24 |
26 |
- |
0 |
1 |
1 |
1 |
|
Nevada§ |
1 |
1 |
8 |
13 |
29 |
17 |
34 |
129 |
528 |
710 |
1 |
0 |
2 |
8 |
6 |
|
New Mexico§ |
- |
1 |
8 |
16 |
30 |
34 |
23 |
48 |
262 |
332 |
- |
1 |
2 |
9 |
16 |
|
Utah |
1 |
7 |
18 |
44 |
55 |
- |
6 |
19 |
52 |
159 |
1 |
0 |
2 |
11 |
21 |
|
Wyoming§ |
- |
0 |
3 |
14 |
10 |
2 |
2 |
9 |
19 |
15 |
- |
0 |
2 |
- |
- |
|
Pacific |
23 |
56 |
152 |
557 |
675 |
290 |
577 |
672 |
7,297 |
8,996 |
3 |
2 |
6 |
39 |
39 |
|
Alaska |
1 |
2 |
10 |
18 |
21 |
14 |
12 |
24 |
192 |
131 |
- |
0 |
2 |
3 |
4 |
|
California |
15 |
35 |
59 |
404 |
488 |
213 |
476 |
575 |
5,958 |
7,369 |
- |
0 |
3 |
7 |
13 |
|
Hawaii |
- |
0 |
4 |
2 |
8 |
8 |
12 |
21 |
147 |
155 |
- |
0 |
2 |
11 |
5 |
|
Oregon§ |
1 |
7 |
18 |
73 |
117 |
11 |
23 |
48 |
304 |
394 |
1 |
1 |
4 |
15 |
17 |
|
Washington |
6 |
8 |
99 |
60 |
41 |
44 |
55 |
82 |
696 |
947 |
2 |
0 |
2 |
3 |
- |
|
American Samoa |
- |
0 |
0 |
- |
- |
- |
0 |
1 |
- |
2 |
- |
0 |
0 |
- |
- |
|
C.N.M.I. |
- |
- |
- |
- |
- |
- |
- |
- |
- |
- |
- |
- |
- |
- |
- |
|
Guam |
- |
0 |
0 |
- |
- |
- |
1 |
15 |
- |
18 |
- |
0 |
0 |
- |
- |
|
Puerto Rico |
- |
3 |
15 |
25 |
36 |
3 |
5 |
22 |
51 |
65 |
- |
0 |
1 |
- |
- |
|
U.S. Virgin Islands |
- |
0 |
0 |
- |
- |
- |
2 |
6 |
12 |
33 |
N |
0 |
0 |
N |
N |
|
C.N.M.I.: Commonwealth of Northern Mariana Islands. U: Unavailable. -: No reported cases. N: Not notifiable. Cum: Cumulative year-to-date counts. Med: Median. Max: Maximum. * Incidence data for reporting year 2008 and 2009 are provisional. † Data for H. influenzae (age <5 yrs for serotype b, nonserotype b, and unknown serotype) are available in Table I. § Contains data reported through the National Electronic Disease Surveillance System (NEDSS). |
|||||||||||||||
|
TABLE II. (Continued) Provisional cases of selected notifiable diseases, United States, weeks ending April 11, 2009, and April 5, 2008 (14th week)* |
|||||||||||||||
|---|---|---|---|---|---|---|---|---|---|---|---|---|---|---|---|
|
Reporting area |
Hepatitis (viral, acute), by type† |
Legionellosis |
|||||||||||||
|
A |
B |
||||||||||||||
|
Current week |
Previous |
Cum 2009 |
Cum 2008 |
Current week |
Previous |
Cum 2009 |
Cum 2008 |
Current week |
Previous |
Cum 2009 |
Cum 2008 |
||||
|
Med |
Max |
Med |
Max |
Med |
Max |
||||||||||
|
United States |
22 |
41 |
74 |
438 |
667 |
24 |
71 |
147 |
821 |
938 |
17 |
51 |
149 |
371 |
493 |
|
New England |
- |
2 |
8 |
24 |
41 |
- |
1 |
4 |
7 |
24 |
- |
2 |
18 |
13 |
22 |
|
Connecticut |
- |
0 |
4 |
7 |
7 |
- |
0 |
2 |
3 |
9 |
- |
0 |
5 |
5 |
4 |
|
Maine§ |
- |
0 |
5 |
1 |
3 |
- |
0 |
2 |
3 |
4 |
- |
0 |
2 |
- |
1 |
|
Massachusetts |
- |
1 |
3 |
12 |
23 |
- |
0 |
2 |
- |
7 |
- |
1 |
7 |
6 |
7 |
|
New Hampshire |
- |
0 |
2 |
1 |
1 |
- |
0 |
2 |
1 |
2 |
- |
0 |
5 |
- |
4 |
|
Rhode Island§ |
- |
0 |
2 |
3 |
7 |
- |
0 |
1 |
- |
1 |
- |
0 |
14 |
1 |
3 |
|
Vermont§ |
- |
0 |
1 |
- |
- |
- |
0 |
1 |
- |
1 |
- |
0 |
1 |
1 |
3 |
|
Mid. Atlantic |
3 |
5 |
12 |
52 |
95 |
1 |
7 |
17 |
58 |
131 |
6 |
15 |
59 |
95 |
105 |
|
New Jersey |
- |
1 |
5 |
5 |
22 |
- |
1 |
5 |
3 |
45 |
- |
2 |
14 |
6 |
13 |
|
New York (Upstate) |
1 |
1 |
4 |
13 |
18 |
1 |
1 |
11 |
18 |
14 |
5 |
5 |
24 |
38 |
23 |
|
New York City |
- |
2 |
6 |
14 |
27 |
- |
1 |
6 |
9 |
24 |
- |
1 |
12 |
5 |
14 |
|
Pennsylvania |
2 |
1 |
4 |
20 |
28 |
- |
3 |
8 |
28 |
48 |
1 |
6 |
33 |
46 |
55 |
|
E.N. Central |
1 |
6 |
16 |
51 |
97 |
2 |
9 |
18 |
98 |
125 |
2 |
8 |
41 |
67 |
128 |
|
Illinois |
- |
2 |
10 |
9 |
29 |
- |
2 |
7 |
12 |
33 |
- |
1 |
13 |
- |
20 |
|
Indiana |
- |
0 |
4 |
3 |
5 |
1 |
1 |
7 |
13 |
9 |
- |
1 |
6 |
6 |
9 |
|
Michigan |
- |
2 |
5 |
19 |
45 |
1 |
3 |
8 |
33 |
44 |
- |
2 |
16 |
14 |
35 |
|
Ohio |
1 |
1 |
4 |
15 |
9 |
- |
2 |
14 |
40 |
33 |
2 |
3 |
18 |
44 |
60 |
|
Wisconsin |
- |
0 |
3 |
5 |
9 |
- |
0 |
0 |
- |
6 |
- |
0 |
3 |
3 |
4 |
|
W.N. Central |
- |
3 |
15 |
23 |
79 |
2 |
2 |
15 |
46 |
17 |
- |
2 |
8 |
4 |
24 |
|
Iowa |
- |
1 |
7 |
- |
34 |
- |
0 |
3 |
6 |
7 |
- |
0 |
2 |
2 |
5 |
|
Kansas |
- |
0 |
3 |
2 |
5 |
- |
0 |
3 |
- |
3 |
- |
0 |
1 |
1 |
1 |
|
Minnesota |
- |
0 |
12 |
5 |
9 |
- |
0 |
11 |
6 |
- |
- |
0 |
4 |
- |
2 |
|
Missouri |
- |
1 |
3 |
10 |
9 |
- |
1 |
5 |
24 |
6 |
- |
0 |
7 |
- |
9 |
|
Nebraska§ |
- |
0 |
5 |
6 |
21 |
2 |
0 |
3 |
9 |
1 |
- |
0 |
3 |
- |
6 |
|
North Dakota |
- |
0 |
1 |
- |
- |
- |
0 |
1 |
- |
- |
- |
0 |
1 |
1 |
- |
|
South Dakota |
- |
0 |
1 |
- |
1 |
- |
0 |
1 |
1 |
- |
- |
0 |
1 |
- |
1 |
|
S. Atlantic |
10 |
7 |
16 |
120 |
89 |
9 |
19 |
34 |
292 |
243 |
5 |
9 |
22 |
94 |
94 |
|
Delaware |
- |
0 |
1 |
- |
1 |
- |
0 |
2 |
8 |
7 |
- |
0 |
2 |
- |
1 |
|
District of Columbia |
U |
0 |
0 |
U |
U |
U |
0 |
0 |
U |
U |
- |
0 |
2 |
- |
3 |
|
Florida |
6 |
3 |
8 |
65 |
41 |
3 |
7 |
11 |
95 |
87 |
3 |
3 |
7 |
43 |
40 |
|
Georgia |
2 |
1 |
4 |
18 |
12 |
1 |
3 |
8 |
37 |
36 |
- |
1 |
5 |
17 |
10 |
|
Maryland§ |
- |
1 |
4 |
13 |
11 |
- |
2 |
5 |
30 |
26 |
2 |
2 |
10 |
16 |
19 |
|
North Carolina |
- |
0 |
9 |
12 |
9 |
3 |
0 |
19 |
90 |
24 |
- |
0 |
7 |
13 |
5 |
|
South Carolina§ |
2 |
0 |
3 |
7 |
2 |
- |
1 |
4 |
4 |
24 |
- |
0 |
2 |
1 |
2 |
|
Virginia§ |
- |
1 |
6 |
5 |
10 |
1 |
2 |
10 |
13 |
23 |
- |
1 |
5 |
4 |
11 |
|
West Virginia |
- |
0 |
1 |
- |
3 |
1 |
1 |
6 |
15 |
16 |
- |
0 |
3 |
- |
3 |
|
E.S. Central |
- |
1 |
9 |
8 |
9 |
4 |
8 |
13 |
87 |
102 |
- |
2 |
10 |
18 |
23 |
|
Alabama§ |
- |
0 |
2 |
1 |
1 |
- |
2 |
7 |
29 |
27 |
- |
0 |
2 |
2 |
2 |
|
Kentucky |
- |
0 |
3 |
1 |
4 |
2 |
2 |
7 |
21 |
28 |
- |
1 |
4 |
8 |
13 |
|
Mississippi |
- |
0 |
2 |
4 |
- |
- |
1 |
3 |
5 |
12 |
- |
0 |
1 |
- |
- |
|
Tennessee§ |
- |
0 |
6 |
2 |
4 |
2 |
3 |
8 |
32 |
35 |
- |
0 |
5 |
8 |
8 |
|
W.S. Central |
- |
4 |
15 |
32 |
62 |
4 |
12 |
56 |
117 |
193 |
3 |
2 |
17 |
15 |
11 |
|
Arkansas§ |
- |
0 |
1 |
1 |
1 |
- |
0 |
4 |
2 |
10 |
- |
0 |
2 |
- |
- |
|
Louisiana |
- |
0 |
2 |
2 |
4 |
- |
1 |
4 |
9 |
24 |
- |
0 |
2 |
1 |
1 |
|
Oklahoma |
- |
0 |
5 |
1 |
3 |
2 |
2 |
10 |
26 |
17 |
- |
0 |
6 |
1 |
- |
|
Texas§ |
- |
4 |
11 |
28 |
54 |
2 |
8 |
45 |
80 |
142 |
3 |
1 |
16 |
13 |
10 |
|
Mountain |
2 |
2 |
6 |
35 |
37 |
- |
2 |
8 |
35 |
25 |
- |
2 |
8 |
23 |
27 |
|
Arizona |
- |
0 |
6 |
18 |
- |
- |
0 |
3 |
14 |
- |
- |
0 |
2 |
8 |
7 |
|
Colorado |
1 |
0 |
2 |
5 |
11 |
- |
0 |
3 |
7 |
6 |
- |
0 |
2 |
1 |
3 |
|
Idaho§ |
- |
0 |
3 |
- |
8 |
- |
0 |
2 |
1 |
2 |
- |
0 |
1 |
- |
1 |
|
Montana§ |
- |
0 |
1 |
2 |
- |
- |
0 |
1 |
- |
- |
- |
0 |
2 |
4 |
2 |
|
Nevada§ |
1 |
0 |
3 |
5 |
2 |
- |
1 |
3 |
6 |
12 |
- |
0 |
2 |
5 |
4 |
|
New Mexico§ |
- |
0 |
1 |
2 |
11 |
- |
0 |
2 |
4 |
4 |
- |
0 |
2 |
- |
3 |
|
Utah |
- |
0 |
2 |
3 |
2 |
- |
0 |
3 |
3 |
1 |
- |
0 |
2 |
5 |
7 |
|
Wyoming§ |
- |
0 |
0 |
- |
3 |
- |
0 |
1 |
- |
- |
- |
0 |
0 |
- |
- |
|
Pacific |
6 |
8 |
25 |
93 |
158 |
2 |
7 |
42 |
81 |
78 |
1 |
4 |
10 |
42 |
59 |
|
Alaska |
- |
0 |
1 |
2 |
1 |
- |
0 |
1 |
1 |
2 |
- |
0 |
1 |
2 |
- |
|
California |
2 |
7 |
25 |
72 |
125 |
2 |
5 |
28 |
64 |
56 |
1 |
3 |
8 |
33 |
50 |
|
Hawaii |
- |
0 |
2 |
2 |
3 |
- |
0 |
1 |
1 |
3 |
- |
0 |
1 |
1 |
2 |
|
Oregon§ |
- |
0 |
2 |
6 |
12 |
- |
1 |
3 |
8 |
9 |
- |
0 |
2 |
3 |
4 |
|
Washington |
4 |
0 |
7 |
11 |
17 |
- |
1 |
14 |
7 |
8 |
- |
0 |
4 |
3 |
3 |
|
American Samoa |
- |
0 |
0 |
- |
- |
- |
0 |
0 |
- |
- |
N |
0 |
0 |
N |
N |
|
C.N.M.I. |
- |
- |
- |
- |
- |
- |
- |
- |
- |
- |
- |
- |
- |
- |
- |
|
Guam |
- |
0 |
0 |
- |
- |
- |
0 |
0 |
- |
- |
- |
0 |
0 |
- |
- |
|
Puerto Rico |
- |
0 |
4 |
6 |
7 |
- |
0 |
5 |
1 |
14 |
- |
0 |
0 |
- |
- |
|
U.S. Virgin Islands |
- |
0 |
0 |
- |
- |
- |
0 |
0 |
- |
- |
- |
0 |
0 |
- |
- |
|
C.N.M.I.: Commonwealth of Northern Mariana Islands. U: Unavailable. -: No reported cases. N: Not notifiable. Cum: Cumulative year-to-date counts. Med: Median. Max: Maximum. * Incidence data for reporting year 2008 and 2009 are provisional. † Data for acute hepatitis C, viral are available in Table I. § Contains data reported through the National Electronic Disease Surveillance System (NEDSS). |
|||||||||||||||
|
TABLE II. (Continued) Provisional cases of selected notifiable diseases, United States, weeks ending April 11, 2009, and April 5, 2008 (14th week)* |
|||||||||||||||
|---|---|---|---|---|---|---|---|---|---|---|---|---|---|---|---|
|
Reporting area |
Lyme disease |
Malaria |
Meningococcal disease, invasive† |
||||||||||||
|
Current week |
Previous |
Cum 2009 |
Cum 2008 |
Current week |
Previous |
Cum 2009 |
Cum 2008 |
Current week |
Previous |
Cum 2009 |
Cum 2008 |
||||
|
Med |
Max |
Med |
Max |
Med |
Max |
||||||||||
|
United States |
77 |
530 |
1,689 |
1,619 |
2,217 |
8 |
24 |
49 |
220 |
191 |
12 |
18 |
42 |
275 |
429 |
|
New England |
4 |
89 |
550 |
181 |
485 |
- |
1 |
6 |
7 |
8 |
- |
0 |
4 |
13 |
14 |
|
Connecticut |
- |
0 |
0 |
- |
- |
- |
0 |
3 |
- |
- |
- |
0 |
1 |
1 |
1 |
|
Maine§ |
3 |
5 |
73 |
32 |
37 |
- |
0 |
0 |
- |
1 |
- |
0 |
1 |
1 |
1 |
|
Massachusetts |
1 |
39 |
375 |
67 |
268 |
- |
0 |
4 |
6 |
5 |
- |
0 |
3 |
8 |
12 |
|
New Hampshire |
- |
17 |
143 |
55 |
75 |
- |
0 |
2 |
- |
1 |
- |
0 |
1 |
1 |
- |
|
Rhode Island§ |
- |
0 |
74 |
5 |
98 |
- |
0 |
1 |
- |
1 |
- |
0 |
1 |
1 |
- |
|
Vermont§ |
- |
4 |
41 |
22 |
7 |
- |
0 |
1 |
1 |
- |
- |
0 |
1 |
1 |
- |
|
Mid. Atlantic |
52 |
270 |
1,395 |
825 |
1,097 |
- |
5 |
16 |
42 |
48 |
1 |
2 |
5 |
23 |
47 |
|
New Jersey |
- |
36 |
220 |
171 |
319 |
- |
1 |
4 |
- |
7 |
- |
0 |
1 |
1 |
8 |
|
New York (Upstate) |
26 |
99 |
1,332 |
328 |
125 |
- |
1 |
10 |
14 |
4 |
1 |
0 |
2 |
5 |
15 |
|
New York City |
- |
4 |
36 |
- |
41 |
- |
3 |
10 |
22 |
30 |
- |
0 |
2 |
3 |
6 |
|
Pennsylvania |
26 |
97 |
519 |
326 |
612 |
- |
1 |
3 |
6 |
7 |
- |
1 |
4 |
14 |
18 |
|
E.N. Central |
3 |
11 |
147 |
29 |
74 |
1 |
3 |
7 |
27 |
37 |
1 |
3 |
8 |
47 |
70 |
|
Illinois |
- |
0 |
13 |
- |
3 |
- |
1 |
5 |
8 |
18 |
- |
1 |
6 |
6 |
27 |
|
Indiana |
- |
0 |
8 |
1 |
- |
- |
0 |
2 |
5 |
1 |
- |
0 |
4 |
10 |
10 |
|
Michigan |
1 |
1 |
10 |
3 |
4 |
- |
0 |
2 |
4 |
6 |
- |
0 |
3 |
8 |
11 |
|
Ohio |
- |
0 |
6 |
2 |
3 |
1 |
0 |
2 |
10 |
11 |
1 |
1 |
4 |
17 |
14 |
|
Wisconsin |
2 |
8 |
129 |
23 |
64 |
- |
0 |
3 |
- |
1 |
- |
0 |
2 |
6 |
8 |
|
W.N. Central |
10 |
9 |
236 |
33 |
9 |
- |
1 |
10 |
6 |
6 |
- |
2 |
7 |
22 |
40 |
|
Iowa |
- |
1 |
9 |
4 |
8 |
- |
0 |
3 |
1 |
- |
- |
0 |
2 |
1 |
8 |
|
Kansas |
- |
0 |
4 |
2 |
1 |
- |
0 |
2 |
1 |
- |
- |
0 |
2 |
6 |
1 |
|
Minnesota |
10 |
6 |
226 |
26 |
- |
- |
0 |
8 |
1 |
1 |
- |
0 |
4 |
5 |
15 |
|
Missouri |
- |
0 |
1 |
- |
- |
- |
0 |
3 |
3 |
1 |
- |
0 |
2 |
8 |
11 |
|
Nebraska§ |
- |
0 |
2 |
- |
- |
- |
0 |
1 |
- |
4 |
- |
0 |
1 |
2 |
4 |
|
North Dakota |
- |
0 |
10 |
- |
- |
- |
0 |
0 |
- |
- |
- |
0 |
1 |
- |
- |
|
South Dakota |
- |
0 |
1 |
1 |
- |
- |
0 |
0 |
- |
- |
- |
0 |
1 |
- |
1 |
|
S. Atlantic |
6 |
75 |
224 |
488 |
493 |
4 |
6 |
15 |
93 |
48 |
3 |
3 |
9 |
53 |
56 |
|
Delaware |
1 |
12 |
36 |
85 |
122 |
- |
0 |
1 |
1 |
1 |
- |
0 |
1 |
- |
- |
|
District of Columbia |
- |
2 |
11 |
- |
27 |
- |
0 |
2 |
- |
- |
- |
0 |
0 |
- |
- |
|
Florida |
1 |
1 |
6 |
13 |
7 |
3 |
1 |
7 |
28 |
14 |
3 |
1 |
4 |
27 |
22 |
|
Georgia |
- |
0 |
6 |
13 |
- |
- |
1 |
5 |
15 |
10 |
- |
0 |
2 |
6 |
5 |
|
Maryland§ |
1 |
30 |
162 |
270 |
274 |
- |
1 |
7 |
27 |
18 |
- |
0 |
3 |
1 |
4 |
|
North Carolina |
1 |
0 |
6 |
15 |
2 |
1 |
0 |
7 |
14 |
2 |
- |
0 |
3 |
9 |
3 |
|
South Carolina§ |
- |
0 |
2 |
3 |
4 |
- |
0 |
1 |
1 |
1 |
- |
0 |
2 |
5 |
10 |
|
Virginia§ |
2 |
15 |
61 |
80 |
51 |
- |
1 |
3 |
6 |
2 |
- |
0 |
2 |
4 |
11 |
|
West Virginia |
- |
1 |
11 |
9 |
6 |
- |
0 |
1 |
1 |
- |
- |
0 |
1 |
1 |
1 |
|
E.S. Central |
- |
1 |
5 |
4 |
2 |
1 |
0 |
2 |
7 |
2 |
- |
0 |
6 |
8 |
23 |
|
Alabama§ |
- |
0 |
2 |
- |
- |
- |
0 |
1 |
2 |
1 |
- |
0 |
2 |
- |
1 |
|
Kentucky |
- |
0 |
2 |
- |
- |
1 |
0 |
1 |
1 |
1 |
- |
0 |
1 |
2 |
5 |
|
Mississippi |
- |
0 |
1 |
- |
- |
- |
0 |
1 |
- |
- |
- |
0 |
2 |
1 |
6 |
|
Tennessee§ |
- |
0 |
3 |
4 |
2 |
- |
0 |
2 |
4 |
- |
- |
0 |
3 |
5 |
11 |
|
W.S. Central |
- |
2 |
21 |
4 |
10 |
- |
1 |
10 |
4 |
10 |
- |
2 |
10 |
21 |
44 |
|
Arkansas§ |
- |
0 |
0 |
- |
- |
- |
0 |
0 |
- |
- |
- |
0 |
2 |
4 |
5 |
|
Louisiana |
- |
0 |
1 |
- |
- |
- |
0 |
1 |
- |
- |
- |
0 |
3 |
7 |
14 |
|
Oklahoma |
- |
0 |
1 |
- |
- |
- |
0 |
2 |
- |
1 |
- |
0 |
3 |
2 |
6 |
|
Texas§ |
- |
2 |
21 |
4 |
10 |
- |
1 |
10 |
4 |
9 |
- |
1 |
9 |
8 |
19 |
|
Mountain |
- |
1 |
14 |
7 |
5 |
- |
0 |
3 |
2 |
8 |
3 |
1 |
4 |
28 |
23 |
|
Arizona |
- |
0 |
2 |
1 |
2 |
- |
0 |
2 |
- |
2 |
2 |
0 |
2 |
8 |
2 |
|
Colorado |
- |
0 |
1 |
1 |
1 |
- |
0 |
1 |
1 |
3 |
1 |
0 |
2 |
9 |
5 |
|
Idaho§ |
- |
0 |
1 |
2 |
1 |
- |
0 |
1 |
- |
- |
- |
0 |
1 |
4 |
2 |
|
Montana§ |
- |
0 |
14 |
1 |
- |
- |
0 |
0 |
- |
- |
- |
0 |
1 |
2 |
1 |
|
Nevada§ |
- |
0 |
2 |
2 |
- |
- |
0 |
1 |
- |
3 |
- |
0 |
1 |
2 |
5 |
|
New Mexico§ |
- |
0 |
2 |
- |
1 |
- |
0 |
1 |
- |
- |
- |
0 |
1 |
1 |
3 |
|
Utah |
- |
0 |
1 |
- |
- |
- |
0 |
1 |
1 |
- |
- |
0 |
1 |
1 |
4 |
|
Wyoming§ |
- |
0 |
1 |
- |
- |
- |
0 |
0 |
- |
- |
- |
0 |
1 |
1 |
1 |
|
Pacific |
2 |
4 |
19 |
48 |
42 |
2 |
3 |
11 |
32 |
24 |
4 |
4 |
13 |
60 |
112 |
|
Alaska |
- |
0 |
2 |
1 |
- |
- |
0 |
2 |
1 |
- |
- |
0 |
2 |
2 |
- |
|
California |
2 |
3 |
8 |
41 |
36 |
2 |
2 |
8 |
22 |
18 |
4 |
2 |
8 |
32 |
92 |
|
Hawaii |
N |
0 |
0 |
N |
N |
- |
0 |
1 |
1 |
1 |
- |
0 |
1 |
1 |
1 |
|
Oregon§ |
- |
1 |
3 |
6 |
6 |
- |
0 |
2 |
4 |
3 |
- |
1 |
7 |
19 |
10 |
|
Washington |
- |
0 |
12 |
- |
- |
- |
0 |
7 |
4 |
2 |
- |
0 |
5 |
6 |
9 |
|
American Samoa |
N |
0 |
0 |
N |
N |
- |
0 |
0 |
- |
- |
- |
0 |
0 |
- |
- |
|
C.N.M.I. |
- |
- |
- |
- |
- |
- |
- |
- |
- |
- |
- |
- |
- |
- |
- |
|
Guam |
- |
0 |
0 |
- |
- |
- |
0 |
2 |
- |
- |
- |
0 |
0 |
- |
- |
|
Puerto Rico |
N |
0 |
0 |
N |
N |
- |
0 |
1 |
1 |
- |
- |
0 |
1 |
- |
2 |
|
U.S. Virgin Islands |
N |
0 |
0 |
N |
N |
- |
0 |
0 |
- |
- |
- |
0 |
0 |
- |
- |
|
C.N.M.I.: Commonwealth of Northern Mariana Islands. U: Unavailable. -: No reported cases. N: Not notifiable. Cum: Cumulative year-to-date counts. Med: Median. Max: Maximum. * Incidence data for reporting year 2008 and 2009 are provisional. † Data for meningococcal disease, invasive caused by serogroups A, C, Y, and W-135; serogroup B; other serogroup; and unknown serogroup are available in Table I. § Contains data reported through the National Electronic Disease Surveillance System (NEDSS). |
|||||||||||||||
|
TABLE II. (Continued) Provisional cases of selected notifiable diseases, United States, weeks ending April 11, 2009, and April 5, 2008 (14th week)* |
|||||||||||||||
|---|---|---|---|---|---|---|---|---|---|---|---|---|---|---|---|
|
Reporting area |
Pertussis |
Rabies, animal |
Rocky Mountain spotted fever |
||||||||||||
|
Current week |
Previous |
Cum 2009 |
Cum 2008 |
Current week |
Previous |
Cum 2009 |
Cum 2008 |
Current week |
Previous |
Cum 2009 |
Cum 2008 |
||||
|
Med |
Max |
Med |
Max |
Med |
Max |
||||||||||
|
United States |
210 |
217 |
1,495 |
2,624 |
1,915 |
31 |
92 |
162 |
648 |
1,032 |
7 |
40 |
148 |
177 |
65 |
|
New England |
- |
16 |
34 |
128 |
278 |
7 |
8 |
21 |
73 |
72 |
- |
0 |
2 |
1 |
1 |
|
Connecticut |
- |
0 |
4 |
- |
22 |
5 |
3 |
17 |
31 |
37 |
- |
0 |
0 |
- |
- |
|
Maine† |
- |
1 |
7 |
26 |
12 |
- |
1 |
5 |
12 |
10 |
- |
0 |
1 |
1 |
- |
|
Massachusetts |
- |
12 |
30 |
81 |
216 |
- |
0 |
0 |
- |
- |
- |
0 |
1 |
- |
1 |
|
New Hampshire |
- |
1 |
4 |
12 |
8 |
1 |
1 |
8 |
6 |
7 |
- |
0 |
1 |
- |
- |
|
Rhode Island† |
- |
1 |
6 |
3 |
15 |
- |
1 |
3 |
7 |
6 |
- |
0 |
2 |
- |
- |
|
Vermont† |
- |
0 |
2 |
6 |
5 |
1 |
1 |
6 |
17 |
12 |
- |
0 |
0 |
- |
- |
|
Mid. Atlantic |
13 |
22 |
64 |
200 |
238 |
7 |
31 |
67 |
99 |
295 |
- |
2 |
30 |
3 |
16 |
|
New Jersey |
- |
3 |
12 |
17 |
39 |
- |
0 |
0 |
- |
- |
- |
1 |
6 |
- |
8 |
|
New York (Upstate) |
7 |
6 |
41 |
47 |
62 |
7 |
9 |
20 |
79 |
86 |
- |
0 |
29 |
- |
- |
|
New York City |
3 |
0 |
20 |
20 |
29 |
- |
0 |
2 |
- |
7 |
- |
0 |
2 |
3 |
5 |
|
Pennsylvania |
3 |
9 |
34 |
116 |
108 |
- |
21 |
52 |
20 |
202 |
- |
0 |
2 |
- |
3 |
|
E.N. Central |
33 |
36 |
174 |
576 |
481 |
- |
3 |
29 |
7 |
2 |
- |
1 |
15 |
4 |
1 |
|
Illinois |
- |
12 |
45 |
119 |
44 |
- |
1 |
21 |
2 |
1 |
- |
1 |
11 |
1 |
1 |
|
Indiana |
- |
2 |
96 |
35 |
12 |
- |
0 |
2 |
- |
- |
- |
0 |
3 |
- |
- |
|
Michigan |
2 |
8 |
21 |
145 |
48 |
- |
1 |
9 |
5 |
- |
- |
0 |
1 |
1 |
- |
|
Ohio |
31 |
10 |
57 |
269 |
361 |
- |
1 |
7 |
- |
1 |
- |
0 |
4 |
2 |
- |
|
Wisconsin |
- |
2 |
7 |
8 |
16 |
N |
0 |
0 |
N |
N |
- |
0 |
1 |
- |
- |
|
W.N. Central |
114 |
28 |
839 |
576 |
163 |
5 |
5 |
17 |
57 |
34 |
- |
4 |
33 |
8 |
3 |
|
Iowa |
- |
4 |
21 |
34 |
26 |
- |
0 |
5 |
6 |
3 |
- |
0 |
2 |
- |
- |
|
Kansas |
2 |
2 |
12 |
39 |
20 |
3 |
1 |
9 |
30 |
15 |
- |
0 |
0 |
- |
- |
|
Minnesota |
89 |
2 |
781 |
112 |
24 |
2 |
0 |
10 |
7 |
8 |
- |
0 |
0 |
- |
- |
|
Missouri |
22 |
10 |
51 |
330 |
77 |
- |
1 |
8 |
6 |
- |
- |
4 |
32 |
8 |
3 |
|
Nebraska† |
1 |
3 |
32 |
53 |
12 |
- |
0 |
0 |
- |
- |
- |
0 |
4 |
- |
- |
|
North Dakota |
- |
0 |
18 |
2 |
- |
- |
0 |
9 |
3 |
3 |
- |
0 |
0 |
- |
- |
|
South Dakota |
- |
0 |
10 |
6 |
4 |
- |
0 |
2 |
5 |
5 |
- |
0 |
1 |
- |
- |
|
S. Atlantic |
22 |
21 |
71 |
344 |
164 |
4 |
24 |
78 |
321 |
537 |
7 |
16 |
71 |
150 |
28 |
|
Delaware |
- |
0 |
3 |
4 |
2 |
- |
0 |
0 |
- |
- |
- |
0 |
5 |
1 |
1 |
|
District of Columbia |
- |
0 |
1 |
- |
2 |
- |
0 |
0 |
- |
- |
- |
0 |
2 |
- |
- |
|
Florida |
10 |
7 |
20 |
116 |
32 |
- |
0 |
14 |
41 |
138 |
- |
0 |
3 |
1 |
1 |
|
Georgia |
- |
2 |
9 |
6 |
9 |
- |
0 |
47 |
88 |
99 |
- |
1 |
8 |
5 |
4 |
|
Maryland† |
1 |
2 |
9 |
21 |
26 |
- |
7 |
17 |
65 |
119 |
- |
1 |
7 |
10 |
7 |
|
North Carolina |
6 |
0 |
65 |
125 |
40 |
N |
2 |
4 |
N |
N |
6 |
9 |
55 |
119 |
11 |
|
South Carolina† |
5 |
2 |
11 |
38 |
21 |
- |
0 |
0 |
- |
- |
- |
1 |
9 |
4 |
- |
|
Virginia† |
- |
3 |
24 |
31 |
28 |
- |
10 |
24 |
104 |
155 |
1 |
2 |
15 |
9 |
2 |
|
West Virginia |
- |
0 |
2 |
3 |
4 |
4 |
1 |
6 |
23 |
26 |
- |
0 |
1 |
1 |
2 |
|
E.S. Central |
3 |
10 |
33 |
154 |
63 |
2 |
3 |
7 |
19 |
39 |
- |
4 |
23 |
7 |
7 |
|
Alabama† |
2 |
1 |
5 |
29 |
17 |
- |
0 |
0 |
- |
- |
- |
1 |
8 |
4 |
4 |
|
Kentucky |
- |
4 |
15 |
77 |
8 |
2 |
1 |
4 |
19 |
4 |
- |
0 |
1 |
- |
- |
|
Mississippi |
- |
2 |
5 |
17 |
26 |
- |
0 |
1 |
- |
1 |
- |
0 |
3 |
1 |
1 |
|
Tennessee† |
1 |
2 |
14 |
31 |
12 |
- |
2 |
6 |
- |
34 |
- |
2 |
19 |
2 |
2 |
|
W.S. Central |
- |
33 |
276 |
264 |
134 |
5 |
1 |
11 |
11 |
13 |
- |
2 |
41 |
3 |
6 |
|
Arkansas† |
- |
1 |
20 |
15 |
17 |
5 |
0 |
6 |
7 |
11 |
- |
0 |
14 |
1 |
- |
|
Louisiana |
- |
2 |
7 |
20 |
3 |
- |
0 |
0 |
- |
- |
- |
0 |
1 |
- |
2 |
|
Oklahoma |
- |
0 |
29 |
9 |
2 |
- |
0 |
10 |
4 |
1 |
- |
0 |
26 |
1 |
- |
|
Texas† |
- |
28 |
232 |
220 |
112 |
- |
0 |
1 |
- |
1 |
- |
1 |
6 |
1 |
4 |
|
Mountain |
11 |
12 |
29 |
226 |
210 |
- |
2 |
9 |
30 |
12 |
- |
1 |
3 |
1 |
3 |
|
Arizona |
2 |
0 |
4 |
29 |
- |
N |
0 |
0 |
N |
N |
- |
0 |
2 |
- |
1 |
|
Colorado |
4 |
3 |
12 |
69 |
55 |
- |
0 |
0 |
- |
- |
- |
0 |
1 |
- |
- |
|
Idaho† |
5 |
1 |
5 |
22 |
7 |
- |
0 |
0 |
- |
- |
- |
0 |
1 |
- |
- |
|
Montana† |
- |
0 |
4 |
5 |
54 |
- |
0 |
4 |
10 |
- |
- |
0 |
1 |
- |
- |
|
Nevada† |
- |
0 |
7 |
6 |
4 |
- |
0 |
5 |
- |
- |
- |
0 |
2 |
- |
- |
|
New Mexico† |
- |
1 |
10 |
22 |
17 |
- |
0 |
3 |
10 |
10 |
- |
0 |
1 |
- |
1 |
|
Utah |
- |
4 |
19 |
72 |
69 |
- |
0 |
6 |
- |
- |
- |
0 |
1 |
1 |
1 |
|
Wyoming† |
- |
0 |
2 |
1 |
4 |
- |
0 |
4 |
10 |
2 |
- |
0 |
2 |
- |
- |
|
Pacific |
14 |
24 |
81 |
156 |
184 |
1 |
4 |
13 |
31 |
28 |
- |
0 |
1 |
- |
- |
|
Alaska |
1 |
3 |
21 |
25 |
23 |
1 |
0 |
2 |
7 |
10 |
N |
0 |
0 |
N |
N |
|
California |
- |
6 |
23 |
13 |
65 |
- |
3 |
12 |
24 |
18 |
- |
0 |
1 |
- |
- |
|
Hawaii |
- |
0 |
3 |
6 |
4 |
- |
0 |
0 |
- |
- |
N |
0 |
0 |
N |
N |
|
Oregon† |
1 |
3 |
16 |
47 |
40 |
- |
0 |
2 |
- |
- |
- |
0 |
1 |
- |
- |
|
Washington |
12 |
6 |
77 |
65 |
52 |
- |
0 |
0 |
- |
- |
- |
0 |
0 |
- |
- |
|
American Samoa |
- |
0 |
0 |
- |
- |
N |
0 |
0 |
N |
N |
N |
0 |
0 |
N |
N |
|
C.N.M.I. |
- |
- |
- |
- |
- |
- |
- |
- |
- |
- |
- |
- |
- |
- |
- |
|
Guam |
- |
0 |
0 |
- |
- |
- |
0 |
0 |
- |
- |
N |
0 |
0 |
N |
N |
|
Puerto Rico |
- |
0 |
1 |
1 |
- |
- |
1 |
5 |
10 |
14 |
N |
0 |
0 |
N |
N |
|
U.S. Virgin Islands |
- |
0 |
0 |
- |
- |
N |
0 |
0 |
N |
N |
N |
0 |
0 |
N |
N |
|
C.N.M.I.: Commonwealth of Northern Mariana Islands. U: Unavailable. -: No reported cases. N: Not notifiable. Cum: Cumulative year-to-date counts. Med: Median. Max: Maximum. * Incidence data for reporting year 2008 and 2009 are provisional. † Contains data reported through the National Electronic Disease Surveillance System (NEDSS). |
|||||||||||||||
|
TABLE II. (Continued) Provisional cases of selected notifiable diseases, United States, weeks ending April 11, 2009, and April 5, 2008 (14th week)* |
|||||||||||||||
|---|---|---|---|---|---|---|---|---|---|---|---|---|---|---|---|
|
Reporting area |
Salmonellosis |
Shiga toxin-producing E. coli (STEC)† |
Shigellosis |
||||||||||||
|
Current week |
Previous |
Cum 2009 |
Cum 2008 |
Current week |
Previous |
Cum 2009 |
Cum 2008 |
Current week |
Previous |
Cum 2009 |
Cum 2008 |
||||
|
Med |
Max |
Med |
Max |
Med |
Max |
||||||||||
|
United States |
318 |
971 |
2,158 |
7,323 |
7,402 |
16 |
81 |
218 |
564 |
873 |
148 |
432 |
815 |
3,628 |
3,556 |
|
New England |
7 |
31 |
116 |
371 |
764 |
- |
4 |
15 |
38 |
76 |
1 |
3 |
10 |
48 |
74 |
|
Connecticut |
- |
0 |
90 |
90 |
491 |
- |
0 |
15 |
15 |
47 |
- |
0 |
4 |
4 |
40 |
|
Maine§ |
- |
2 |
8 |
21 |
28 |
- |
0 |
3 |
- |
2 |
- |
0 |
6 |
2 |
1 |
|
Massachusetts |
7 |
20 |
51 |
192 |
195 |
- |
2 |
11 |
12 |
18 |
1 |
3 |
9 |
35 |
28 |
|
New Hampshire |
- |
3 |
10 |
31 |
21 |
- |
1 |
3 |
9 |
6 |
- |
0 |
1 |
1 |
1 |
|
Rhode Island§ |
- |
2 |
9 |
25 |
18 |
- |
0 |
3 |
- |
1 |
- |
0 |
1 |
4 |
3 |
|
Vermont§ |
- |
1 |
7 |
12 |
11 |
- |
0 |
6 |
2 |
2 |
- |
0 |
2 |
2 |
1 |
|
Mid. Atlantic |
33 |
105 |
203 |
778 |
903 |
2 |
8 |
27 |
41 |
304 |
19 |
54 |
96 |
643 |
385 |
|
New Jersey |
- |
21 |
55 |
59 |
224 |
- |
2 |
12 |
3 |
31 |
- |
19 |
38 |
197 |
88 |
|
New York (Upstate) |
23 |
29 |
65 |
227 |
187 |
2 |
3 |
12 |
25 |
250 |
4 |
9 |
35 |
47 |
89 |
|
New York City |
1 |
22 |
54 |
191 |
231 |
- |
1 |
5 |
10 |
9 |
- |
12 |
35 |
119 |
176 |
|
Pennsylvania |
9 |
28 |
78 |
301 |
261 |
- |
0 |
8 |
3 |
14 |
15 |
9 |
30 |
280 |
32 |
|
E.N. Central |
19 |
98 |
194 |
854 |
850 |
1 |
11 |
75 |
69 |
91 |
36 |
83 |
128 |
766 |
739 |
|
Illinois |
- |
27 |
72 |
165 |
256 |
- |
1 |
10 |
7 |
17 |
- |
17 |
35 |
117 |
238 |
|
Indiana |
- |
8 |
53 |
49 |
68 |
- |
1 |
14 |
9 |
4 |
- |
6 |
39 |
16 |
218 |
|
Michigan |
8 |
18 |
38 |
194 |
166 |
- |
2 |
43 |
17 |
20 |
2 |
5 |
24 |
82 |
16 |
|
Ohio |
11 |
27 |
65 |
301 |
213 |
1 |
3 |
17 |
20 |
20 |
30 |
42 |
80 |
462 |
189 |
|
Wisconsin |
- |
14 |
50 |
145 |
147 |
- |
3 |
20 |
16 |
30 |
4 |
8 |
33 |
89 |
78 |
|
W.N. Central |
21 |
53 |
148 |
592 |
464 |
3 |
12 |
59 |
70 |
66 |
9 |
14 |
39 |
118 |
211 |
|
Iowa |
4 |
9 |
16 |
74 |
75 |
2 |
2 |
21 |
17 |
17 |
1 |
4 |
12 |
29 |
18 |
|
Kansas |
5 |
7 |
29 |
63 |
45 |
- |
1 |
7 |
5 |
4 |
6 |
2 |
5 |
45 |
2 |
|
Minnesota |
10 |
11 |
69 |
130 |
129 |
- |
2 |
21 |
19 |
10 |
- |
4 |
25 |
15 |
36 |
|
Missouri |
2 |
13 |
48 |
99 |
125 |
- |
2 |
11 |
18 |
26 |
2 |
3 |
14 |
22 |
85 |
|
Nebraska§ |
- |
5 |
41 |
147 |
54 |
1 |
2 |
30 |
10 |
5 |
- |
0 |
3 |
5 |
- |
|
North Dakota |
- |
0 |
10 |
9 |
8 |
- |
0 |
1 |
- |
- |
- |
0 |
3 |
1 |
19 |
|
South Dakota |
- |
3 |
22 |
70 |
28 |
- |
1 |
4 |
1 |
4 |
- |
0 |
5 |
1 |
51 |
|
S. Atlantic |
88 |
250 |
455 |
2,015 |
1,817 |
4 |
13 |
51 |
131 |
130 |
19 |
55 |
100 |
543 |
803 |
|
Delaware |
1 |
2 |
9 |
8 |
25 |
- |
0 |
2 |
2 |
2 |
- |
0 |
1 |
5 |
2 |
|
District of Columbia |
- |
0 |
4 |
- |
13 |
- |
0 |
1 |
- |
3 |
- |
0 |
3 |
- |
5 |
|
Florida |
54 |
97 |
174 |
846 |
911 |
2 |
2 |
10 |
42 |
43 |
10 |
12 |
34 |
120 |
267 |
|
Georgia |
15 |
43 |
86 |
319 |
217 |
1 |
1 |
7 |
10 |
6 |
4 |
17 |
48 |
127 |
307 |
|
Maryland§ |
12 |
14 |
36 |
141 |
119 |
1 |
2 |
9 |
20 |
16 |
4 |
3 |
12 |
82 |
18 |
|
North Carolina |
1 |
28 |
106 |
387 |
188 |
- |
2 |
21 |
41 |
12 |
- |
5 |
27 |
101 |
25 |
|
South Carolina§ |
5 |
18 |
55 |
143 |
165 |
- |
0 |
3 |
3 |
13 |
1 |
7 |
32 |
46 |
156 |
|
Virginia§ |
- |
20 |
89 |
143 |
131 |
- |
3 |
27 |
12 |
27 |
- |
5 |
59 |
57 |
21 |
|
West Virginia |
- |
3 |
8 |
28 |
48 |
- |
0 |
3 |
1 |
8 |
- |
0 |
3 |
5 |
2 |
|
E.S. Central |
11 |
60 |
140 |
415 |
444 |
2 |
5 |
12 |
33 |
49 |
6 |
31 |
67 |
205 |
470 |
|
Alabama§ |
3 |
16 |
49 |
128 |
147 |
- |
1 |
3 |
7 |
25 |
1 |
5 |
18 |
51 |
134 |
|
Kentucky |
2 |
10 |
18 |
90 |
77 |
- |
1 |
7 |
6 |
8 |
- |
3 |
24 |
23 |
46 |
|
Mississippi |
- |
14 |
57 |
76 |
91 |
- |
0 |
2 |
1 |
2 |
- |
2 |
18 |
7 |
142 |
|
Tennessee§ |
6 |
15 |
62 |
121 |
129 |
2 |
2 |
6 |
19 |
14 |
5 |
19 |
48 |
124 |
148 |
|
W.S. Central |
14 |
139 |
1,118 |
474 |
545 |
- |
6 |
54 |
35 |
66 |
33 |
98 |
523 |
747 |
523 |
|
Arkansas§ |
4 |
11 |
40 |
79 |
70 |
- |
1 |
3 |
5 |
9 |
2 |
11 |
27 |
58 |
60 |
|
Louisiana |
- |
17 |
50 |
65 |
99 |
- |
0 |
1 |
- |
1 |
- |
10 |
26 |
42 |
108 |
|
Oklahoma |
9 |
15 |
36 |
99 |
66 |
- |
1 |
19 |
4 |
3 |
2 |
3 |
43 |
35 |
27 |
|
Texas§ |
1 |
93 |
1,057 |
231 |
310 |
- |
5 |
48 |
26 |
53 |
29 |
65 |
463 |
612 |
328 |
|
Mountain |
35 |
60 |
115 |
572 |
640 |
1 |
10 |
37 |
77 |
57 |
11 |
15 |
29 |
264 |
91 |
|
Arizona |
6 |
21 |
44 |
216 |
168 |
- |
0 |
4 |
8 |
- |
11 |
0 |
20 |
189 |
- |
|
Colorado |
20 |
12 |
21 |
133 |
217 |
- |
4 |
18 |
45 |
15 |
- |
2 |
11 |
26 |
19 |
|
Idaho§ |
3 |
3 |
15 |
32 |
31 |
- |
2 |
15 |
6 |
20 |
- |
0 |
2 |
- |
3 |
|
Montana§ |
- |
2 |
8 |
28 |
15 |
- |
0 |
3 |
2 |
7 |
- |
0 |
2 |
2 |
- |
|
Nevada§ |
3 |
3 |
14 |
51 |
56 |
1 |
0 |
3 |
2 |
3 |
- |
3 |
13 |
22 |
50 |
|
New Mexico§ |
1 |
7 |
32 |
37 |
68 |
- |
1 |
6 |
7 |
8 |
- |
2 |
12 |
21 |
13 |
|
Utah |
2 |
6 |
19 |
63 |
68 |
- |
1 |
9 |
6 |
2 |
- |
1 |
3 |
4 |
3 |
|
Wyoming§ |
- |
1 |
4 |
12 |
17 |
- |
0 |
1 |
1 |
2 |
- |
0 |
1 |
- |
3 |
|
Pacific |
90 |
114 |
530 |
1,252 |
975 |
3 |
10 |
60 |
70 |
34 |
14 |
31 |
83 |
294 |
260 |
|
Alaska |
2 |
1 |
4 |
12 |
13 |
- |
0 |
1 |
- |
1 |
- |
0 |
1 |
2 |
- |
|
California |
69 |
84 |
516 |
941 |
764 |
2 |
6 |
39 |
53 |
25 |
13 |
27 |
75 |
236 |
219 |
|
Hawaii |
2 |
5 |
15 |
70 |
49 |
- |
0 |
2 |
1 |
2 |
- |
1 |
3 |
5 |
11 |
|
Oregon§ |
2 |
7 |
20 |
92 |
71 |
- |
1 |
8 |
- |
3 |
- |
1 |
10 |
17 |
14 |
|
Washington |
15 |
13 |
155 |
137 |
78 |
1 |
2 |
44 |
16 |
3 |
1 |
2 |
28 |
34 |
16 |
|
American Samoa |
- |
0 |
1 |
- |
1 |
- |
0 |
0 |
- |
- |
- |
0 |
2 |
3 |
1 |
|
C.N.M.I. |
- |
- |
- |
- |
- |
- |
- |
- |
- |
- |
- |
- |
- |
- |
- |
|
Guam |
- |
0 |
2 |
- |
4 |
- |
0 |
0 |
- |
- |
- |
0 |
3 |
- |
5 |
|
Puerto Rico |
1 |
14 |
40 |
70 |
133 |
- |
0 |
0 |
- |
- |
- |
0 |
4 |
1 |
4 |
|
U.S. Virgin Islands |
- |
0 |
0 |
- |
- |
- |
0 |
0 |
- |
- |
- |
0 |
0 |
- |
- |
|
C.N.M.I.: Commonwealth of Northern Mariana Islands. U: Unavailable. -: No reported cases. N: Not notifiable. Cum: Cumulative year-to-date counts. Med: Median. Max: Maximum. * Incidence data for reporting year 2008 and 2009 are provisional. † Includes E. coli O157:H7; Shiga toxin-positive, serogroup non-O157; and Shiga toxin-positive, not serogrouped. § Contains data reported through the National Electronic Disease Surveillance System (NEDSS). |
|||||||||||||||
|
TABLE II. (Continued) Provisional cases of selected notifiable diseases, United States, weeks ending April 11, 2009, and April 5, 2008 (14th week)* |
||||||||||
|---|---|---|---|---|---|---|---|---|---|---|
|
Reporting area |
Streptococcal diseases, invasive, group A |
Streptococcus pneumoniae, invasive disease, nondrug resistant†Age <5 years |
||||||||
|
Current |
Previous |
Cum |
Cum |
Current |
Previous |
Cum |
Cum |
|||
|
Med |
Max |
Med |
Max |
|||||||
|
United States |
75 |
97 |
208 |
1,711 |
1,857 |
23 |
33 |
90 |
524 |
551 |
|
New England |
5 |
5 |
31 |
102 |
120 |
3 |
1 |
12 |
19 |
32 |
|
Connecticut |
- |
0 |
26 |
23 |
9 |
- |
0 |
11 |
- |
- |
|
Maine§ |
- |
0 |
3 |
6 |
11 |
- |
0 |
1 |
- |
1 |
|
Massachusetts |
3 |
3 |
7 |
45 |
76 |
2 |
1 |
3 |
13 |
26 |
|
New Hampshire |
- |
0 |
4 |
15 |
12 |
1 |
0 |
1 |
4 |
5 |
|
Rhode Island§ |
- |
0 |
8 |
4 |
6 |
- |
0 |
2 |
- |
- |
|
Vermont§ |
2 |
0 |
3 |
9 |
6 |
- |
0 |
1 |
2 |
- |
|
Mid. Atlantic |
11 |
18 |
36 |
304 |
406 |
6 |
4 |
25 |
64 |
70 |
|
New Jersey |
- |
2 |
9 |
2 |
82 |
- |
1 |
4 |
10 |
22 |
|
New York (Upstate) |
9 |
6 |
24 |
112 |
109 |
1 |
2 |
19 |
38 |
29 |
|
New York City |
- |
3 |
12 |
60 |
84 |
5 |
0 |
23 |
16 |
19 |
|
Pennsylvania |
2 |
7 |
17 |
130 |
131 |
N |
0 |
2 |
N |
N |
|
E.N. Central |
12 |
15 |
39 |
309 |
395 |
2 |
6 |
11 |
76 |
112 |
|
Illinois |
- |
3 |
11 |
69 |
119 |
- |
1 |
5 |
9 |
35 |
|
Indiana |
- |
2 |
19 |
42 |
49 |
- |
0 |
5 |
6 |
12 |
|
Michigan |
2 |
3 |
9 |
55 |
72 |
1 |
1 |
5 |
22 |
29 |
|
Ohio |
8 |
4 |
14 |
107 |
99 |
1 |
1 |
5 |
29 |
19 |
|
Wisconsin |
2 |
1 |
10 |
36 |
56 |
- |
0 |
2 |
10 |
17 |
|
W.N. Central |
5 |
5 |
37 |
147 |
147 |
2 |
2 |
11 |
45 |
36 |
|
Iowa |
- |
0 |
0 |
- |
- |
- |
0 |
0 |
- |
- |
|
Kansas |
1 |
0 |
8 |
21 |
20 |
N |
0 |
1 |
N |
N |
|
Minnesota |
- |
0 |
34 |
52 |
55 |
- |
0 |
9 |
15 |
13 |
|
Missouri |
2 |
2 |
8 |
44 |
40 |
2 |
1 |
4 |
21 |
16 |
|
Nebraska§ |
2 |
1 |
3 |
20 |
16 |
- |
0 |
1 |
2 |
2 |
|
North Dakota |
- |
0 |
2 |
2 |
7 |
- |
0 |
3 |
3 |
1 |
|
South Dakota |
- |
0 |
2 |
8 |
9 |
- |
0 |
2 |
4 |
4 |
|
S. Atlantic |
18 |
21 |
45 |
391 |
392 |
6 |
6 |
14 |
107 |
123 |
|
Delaware |
- |
0 |
1 |
6 |
6 |
- |
0 |
0 |
- |
- |
|
District of Columbia |
- |
0 |
4 |
- |
8 |
N |
0 |
0 |
N |
N |
|
Florida |
9 |
6 |
12 |
101 |
86 |
4 |
1 |
3 |
24 |
19 |
|
Georgia |
6 |
5 |
14 |
96 |
79 |
1 |
2 |
6 |
35 |
32 |
|
Maryland§ |
3 |
3 |
10 |
56 |
73 |
1 |
1 |
3 |
22 |
29 |
|
North Carolina |
- |
2 |
13 |
42 |
46 |
N |
0 |
0 |
N |
N |
|
South Carolina§ |
- |
1 |
5 |
27 |
27 |
- |
1 |
6 |
21 |
20 |
|
Virginia§ |
- |
3 |
9 |
52 |
52 |
- |
0 |
3 |
1 |
20 |
|
West Virginia |
- |
0 |
3 |
11 |
15 |
- |
0 |
2 |
4 |
3 |
|
E.S. Central |
1 |
4 |
9 |
79 |
58 |
- |
2 |
6 |
20 |
30 |
|
Alabama§ |
N |
0 |
0 |
N |
N |
N |
0 |
0 |
N |
N |
|
Kentucky |
- |
1 |
5 |
14 |
14 |
N |
0 |
0 |
N |
N |
|
Mississippi |
N |
0 |
0 |
N |
N |
- |
0 |
3 |
- |
7 |
|
Tennessee§ |
1 |
3 |
8 |
65 |
44 |
- |
2 |
6 |
20 |
23 |
|
W.S. Central |
9 |
10 |
58 |
165 |
152 |
3 |
6 |
36 |
95 |
78 |
|
Arkansas§ |
- |
0 |
2 |
6 |
2 |
- |
0 |
3 |
9 |
3 |
|
Louisiana |
- |
0 |
2 |
5 |
8 |
- |
0 |
3 |
12 |
3 |
|
Oklahoma |
5 |
2 |
13 |
64 |
42 |
2 |
1 |
7 |
18 |
28 |
|
Texas§ |
4 |
6 |
45 |
90 |
100 |
1 |
4 |
27 |
56 |
44 |
|
Mountain |
11 |
7 |
16 |
166 |
144 |
1 |
2 |
15 |
87 |
53 |
|
Arizona |
5 |
0 |
5 |
45 |
- |
1 |
0 |
9 |
49 |
- |
|
Colorado |
5 |
3 |
8 |
64 |
60 |
- |
1 |
4 |
19 |
22 |
|
Idaho§ |
- |
0 |
2 |
3 |
8 |
- |
0 |
1 |
2 |
2 |
|
Montana§ |
N |
0 |
0 |
N |
N |
N |
0 |
0 |
N |
N |
|
Nevada§ |
1 |
0 |
1 |
3 |
5 |
- |
0 |
1 |
- |
1 |
|
New Mexico§ |
- |
2 |
6 |
29 |
50 |
- |
0 |
2 |
6 |
11 |
|
Utah |
- |
1 |
6 |
21 |
18 |
- |
0 |
4 |
11 |
17 |
|
Wyoming§ |
- |
0 |
1 |
1 |
3 |
- |
0 |
1 |
- |
- |
|
Pacific |
3 |
3 |
8 |
48 |
43 |
- |
1 |
5 |
11 |
17 |
|
Alaska |
2 |
0 |
4 |
7 |
10 |
- |
0 |
4 |
8 |
10 |
|
California |
N |
0 |
0 |
N |
N |
N |
0 |
0 |
N |
N |
|
Hawaii |
1 |
3 |
8 |
41 |
33 |
- |
0 |
2 |
3 |
7 |
|
Oregon§ |
N |
0 |
0 |
N |
N |
N |
0 |
0 |
N |
N |
|
Washington |
N |
0 |
0 |
N |
N |
N |
0 |
0 |
N |
N |
|
American Samoa |
- |
0 |
8 |
- |
12 |
N |
0 |
0 |
N |
N |
|
C.N.M.I. |
- |
- |
- |
- |
- |
- |
- |
- |
- |
- |
|
Guam |
- |
0 |
0 |
- |
- |
- |
0 |
0 |
- |
- |
|
Puerto Rico |
N |
0 |
0 |
N |
N |
N |
0 |
0 |
N |
N |
|
U.S. Virgin Islands |
- |
0 |
0 |
- |
- |
N |
0 |
0 |
N |
N |
|
C.N.M.I.: Commonwealth of Northern Mariana Islands. U: Unavailable. -: No reported cases. N: Not notifiable. Cum: Cumulative year-to-date counts. Med: Median. Max: Maximum. * Incidence data for reporting year 2008 and 2009 are provisional. † Includes cases of invasive pneumococcal disease, in children aged <5 years, caused by S. pneumoniae, which is susceptible or for which susceptibility testing is not available (NNDSS event code 11717). § Contains data reported through the National Electronic Disease Surveillance System (NEDSS). |
||||||||||
|
TABLE II. (Continued) Provisional cases of selected notifiable diseases, United States, weeks ending April 11, 2009, and April 5, 2008 (14th week)* |
|||||||||||||||
|---|---|---|---|---|---|---|---|---|---|---|---|---|---|---|---|
|
Reporting area |
Streptococcus pneumoniae, invasive disease, drug resistant† |
Syphilis, primary and secondary |
|||||||||||||
|
All ages |
Aged <5 years |
||||||||||||||
|
Current week |
Previous |
Cum 2009 |
Cum 2008 |
Current week |
Previous |
Cum 2009 |
Cum 2008 |
Current week |
Previous |
Cum 2009 |
Cum 2008 |
||||
|
Med |
Max |
Med |
Max |
Med |
Max |
||||||||||
|
United States |
37 |
57 |
108 |
1,035 |
1,172 |
9 |
8 |
22 |
147 |
140 |
74 |
255 |
384 |
3,115 |
3,295 |
|
New England |
1 |
1 |
48 |
19 |
19 |
- |
0 |
5 |
1 |
1 |
3 |
5 |
15 |
92 |
79 |
|
Connecticut |
- |
0 |
48 |
- |
- |
- |
0 |
5 |
- |
- |
- |
1 |
5 |
21 |
3 |
|
Maine§ |
- |
0 |
2 |
3 |
7 |
- |
0 |
1 |
- |
- |
- |
0 |
2 |
1 |
2 |
|
Massachusetts |
- |
0 |
1 |
1 |
- |
- |
0 |
1 |
1 |
- |
3 |
4 |
11 |
59 |
64 |
|
New Hampshire |
- |
0 |
3 |
5 |
- |
- |
0 |
0 |
- |
- |
- |
0 |
2 |
7 |
4 |
|
Rhode Island§ |
- |
0 |
4 |
4 |
7 |
- |
0 |
1 |
- |
- |
- |
0 |
5 |
4 |
3 |
|
Vermont§ |
1 |
0 |
2 |
6 |
5 |
- |
0 |
1 |
- |
1 |
- |
0 |
2 |
- |
3 |
|
Mid. Atlantic |
1 |
4 |
14 |
47 |
113 |
1 |
0 |
3 |
10 |
10 |
30 |
33 |
51 |
490 |
466 |
|
New Jersey |
- |
0 |
0 |
- |
- |
- |
0 |
0 |
- |
- |
- |
4 |
10 |
58 |
68 |
|
New York (Upstate) |
1 |
1 |
8 |
19 |
20 |
1 |
0 |
2 |
6 |
2 |
2 |
2 |
8 |
26 |
29 |
|
New York City |
- |
1 |
5 |
1 |
45 |
- |
0 |
0 |
- |
- |
27 |
23 |
37 |
328 |
281 |
|
Pennsylvania |
- |
1 |
10 |
27 |
48 |
- |
0 |
1 |
4 |
8 |
1 |
5 |
11 |
78 |
88 |
|
E.N. Central |
12 |
9 |
28 |
181 |
262 |
2 |
1 |
6 |
26 |
30 |
7 |
26 |
47 |
229 |
411 |
|
Illinois |
N |
0 |
0 |
N |
N |
N |
0 |
0 |
N |
N |
- |
5 |
14 |
36 |
124 |
|
Indiana |
- |
2 |
19 |
26 |
93 |
- |
0 |
3 |
4 |
11 |
2 |
2 |
10 |
42 |
40 |
|
Michigan |
- |
0 |
3 |
9 |
7 |
- |
0 |
1 |
- |
1 |
5 |
4 |
18 |
67 |
50 |
|
Ohio |
12 |
7 |
18 |
146 |
162 |
2 |
1 |
4 |
22 |
18 |
- |
11 |
27 |
71 |
183 |
|
Wisconsin |
- |
0 |
0 |
- |
- |
- |
0 |
0 |
- |
- |
- |
1 |
4 |
13 |
14 |
|
W.N. Central |
2 |
2 |
8 |
39 |
88 |
1 |
0 |
2 |
10 |
6 |
- |
7 |
14 |
79 |
120 |
|
Iowa |
- |
0 |
0 |
- |
- |
- |
0 |
0 |
- |
- |
- |
0 |
2 |
7 |
4 |
|
Kansas |
1 |
1 |
4 |
13 |
39 |
1 |
0 |
2 |
8 |
2 |
- |
0 |
3 |
3 |
7 |
|
Minnesota |
- |
0 |
0 |
- |
- |
- |
0 |
0 |
- |
- |
- |
2 |
6 |
16 |
30 |
|
Missouri |
1 |
1 |
4 |
22 |
46 |
- |
0 |
1 |
2 |
1 |
- |
3 |
10 |
50 |
75 |
|
Nebraska§ |
- |
0 |
0 |
- |
- |
- |
0 |
0 |
- |
- |
- |
0 |
2 |
3 |
4 |
|
North Dakota |
- |
0 |
2 |
4 |
- |
- |
0 |
0 |
- |
- |
- |
0 |
0 |
- |
- |
|
South Dakota |
- |
0 |
2 |
- |
3 |
- |
0 |
0 |
- |
3 |
- |
0 |
1 |
- |
- |
|
S. Atlantic |
13 |
22 |
51 |
533 |
476 |
2 |
4 |
14 |
68 |
66 |
10 |
59 |
197 |
714 |
571 |
|
Delaware |
- |
0 |
1 |
6 |
1 |
- |
0 |
0 |
- |
- |
- |
0 |
4 |
8 |
1 |
|
District of Columbia |
N |
0 |
0 |
N |
N |
N |
0 |
0 |
N |
N |
- |
3 |
9 |
46 |
29 |
|
Florida |
12 |
14 |
36 |
344 |
251 |
2 |
3 |
13 |
49 |
36 |
6 |
20 |
37 |
279 |
229 |
|
Georgia |
1 |
7 |
23 |
146 |
178 |
- |
1 |
5 |
19 |
25 |
- |
13 |
169 |
78 |
73 |
|
Maryland§ |
- |
0 |
1 |
4 |
4 |
- |
0 |
0 |
- |
1 |
4 |
8 |
16 |
86 |
77 |
|
North Carolina |
N |
0 |
0 |
N |
N |
N |
0 |
0 |
N |
N |
- |
6 |
19 |
122 |
65 |
|
South Carolina§ |
- |
0 |
0 |
- |
- |
- |
0 |
0 |
- |
- |
- |
2 |
6 |
19 |
21 |
|
Virginia§ |
N |
0 |
0 |
N |
N |
N |
0 |
0 |
N |
N |
- |
5 |
16 |
75 |
75 |
|
West Virginia |
- |
1 |
7 |
33 |
42 |
- |
0 |
2 |
- |
4 |
- |
0 |
1 |
1 |
1 |
|
E.S. Central |
3 |
5 |
25 |
133 |
124 |
- |
1 |
4 |
17 |
15 |
7 |
22 |
36 |
305 |
285 |
|
Alabama§ |
N |
0 |
0 |
N |
N |
N |
0 |
0 |
N |
N |
- |
8 |
17 |
110 |
126 |
|
Kentucky |
2 |
1 |
6 |
35 |
28 |
- |
0 |
2 |
4 |
4 |
2 |
1 |
10 |
19 |
20 |
|
Mississippi |
- |
0 |
2 |
- |
- |
- |
0 |
1 |
- |
- |
- |
3 |
18 |
49 |
28 |
|
Tennessee§ |
1 |
3 |
22 |
98 |
96 |
- |
0 |
3 |
13 |
11 |
5 |
8 |
19 |
127 |
111 |
|
W.S. Central |
4 |
2 |
7 |
33 |
43 |
3 |
0 |
1 |
8 |
7 |
6 |
45 |
80 |
629 |
538 |
|
Arkansas§ |
4 |
0 |
5 |
20 |
6 |
3 |
0 |
1 |
5 |
2 |
6 |
4 |
35 |
77 |
24 |
|
Louisiana |
- |
1 |
6 |
13 |
37 |
- |
0 |
1 |
3 |
5 |
- |
11 |
33 |
128 |
119 |
|
Oklahoma |
N |
0 |
0 |
N |
N |
N |
0 |
0 |
N |
N |
- |
1 |
7 |
14 |
23 |
|
Texas§ |
- |
0 |
0 |
- |
- |
- |
0 |
0 |
- |
- |
- |
28 |
40 |
410 |
372 |
|
Mountain |
1 |
3 |
7 |
48 |
46 |
- |
0 |
3 |
7 |
4 |
5 |
10 |
18 |
65 |
150 |
|
Arizona |
- |
0 |
0 |
- |
- |
- |
0 |
0 |
- |
- |
- |
5 |
13 |
19 |
83 |
|
Colorado |
- |
0 |
0 |
- |
- |
- |
0 |
0 |
- |
- |
- |
1 |
5 |
3 |
30 |
|
Idaho§ |
N |
0 |
1 |
N |
N |
N |
0 |
1 |
N |
N |
- |
0 |
2 |
2 |
1 |
|
Montana§ |
- |
0 |
1 |
- |
- |
- |
0 |
0 |
- |
- |
- |
0 |
7 |
- |
- |
|
Nevada§ |
1 |
1 |
4 |
20 |
21 |
- |
0 |
1 |
3 |
1 |
4 |
1 |
7 |
29 |
22 |
|
New Mexico§ |
- |
0 |
1 |
- |
- |
- |
0 |
0 |
- |
- |
1 |
1 |
5 |
12 |
6 |
|
Utah |
- |
1 |
6 |
22 |
25 |
- |
0 |
3 |
4 |
3 |
- |
0 |
2 |
- |
8 |
|
Wyoming§ |
- |
0 |
2 |
6 |
- |
- |
0 |
0 |
- |
- |
- |
0 |
1 |
- |
- |
|
Pacific |
- |
0 |
1 |
2 |
1 |
- |
0 |
1 |
- |
1 |
6 |
45 |
71 |
512 |
675 |
|
Alaska |
- |
0 |
0 |
- |
- |
- |
0 |
0 |
- |
- |
- |
0 |
1 |
- |
- |
|
California |
N |
0 |
0 |
N |
N |
N |
0 |
0 |
N |
N |
4 |
41 |
65 |
453 |
608 |
|
Hawaii |
- |
0 |
1 |
2 |
1 |
- |
0 |
1 |
- |
1 |
- |
0 |
3 |
10 |
8 |
|
Oregon§ |
N |
0 |
0 |
N |
N |
N |
0 |
0 |
N |
N |
- |
0 |
3 |
8 |
5 |
|
Washington |
N |
0 |
0 |
N |
N |
N |
0 |
0 |
N |
N |
2 |
3 |
9 |
41 |
54 |
|
American Samoa |
N |
0 |
0 |
N |
N |
N |
0 |
0 |
N |
N |
- |
0 |
0 |
- |
- |
|
C.N.M.I. |
- |
- |
- |
- |
- |
- |
- |
- |
- |
- |
- |
- |
- |
- |
- |
|
Guam |
- |
0 |
0 |
- |
- |
- |
0 |
0 |
- |
- |
- |
0 |
0 |
- |
- |
|
Puerto Rico |
- |
0 |
0 |
- |
- |
- |
0 |
0 |
- |
- |
4 |
3 |
11 |
47 |
34 |
|
U.S. Virgin Islands |
- |
0 |
0 |
- |
- |
- |
0 |
0 |
- |
- |
- |
0 |
0 |
- |
- |
|
C.N.M.I.: Commonwealth of Northern Mariana Islands. U: Unavailable. -: No reported cases. N: Not notifiable. Cum: Cumulative year-to-date counts. Med: Median. Max: Maximum. * Incidence data for reporting year 2008 and 2009 are provisional. † Includes cases of invasive pneumococcal disease caused by drug-resistant S. pneumoniae (DRSP) (NNDSS event code 11720). § Contains data reported through the National Electronic Disease Surveillance System (NEDSS). |
|||||||||||||||
|
TABLE II. (Continued) Provisional cases of selected notifiable diseases, United States, weeks ending April 11, 2009, and April 5, 2008 (14th week)* |
|||||||||||||||
|---|---|---|---|---|---|---|---|---|---|---|---|---|---|---|---|
|
West Nile virus disease† |
|||||||||||||||
|
Reporting area |
Varicella (chickenpox) |
Neuroinvasive |
Nonneuroinvasive§ |
||||||||||||
|
Current week |
Previous |
Cum 2009 |
Cum 2008 |
Current week |
Previous |
Cum 2009 |
Cum |
Current week |
Previous |
Cum 2009 |
Cum 2008 |
||||
|
Med |
Max |
Med |
Max |
Med |
Max |
||||||||||
|
United States |
217 |
438 |
1,015 |
4,996 |
9,571 |
- |
1 |
75 |
- |
2 |
- |
1 |
77 |
- |
4 |
|
New England |
2 |
13 |
29 |
92 |
288 |
- |
0 |
2 |
- |
- |
- |
0 |
1 |
- |
- |
|
Connecticut |
- |
0 |
0 |
- |
- |
- |
0 |
2 |
- |
- |
- |
0 |
1 |
- |
- |
|
Maine¶ |
- |
2 |
11 |
- |
105 |
- |
0 |
0 |
- |
- |
- |
0 |
0 |
- |
- |
|
Massachusetts |
- |
0 |
1 |
- |
- |
- |
0 |
1 |
- |
- |
- |
0 |
0 |
- |
- |
|
New Hampshire |
2 |
4 |
12 |
64 |
102 |
- |
0 |
0 |
- |
- |
- |
0 |
0 |
- |
- |
|
Rhode Island¶ |
- |
0 |
0 |
- |
- |
- |
0 |
1 |
- |
- |
- |
0 |
0 |
- |
- |
|
Vermont¶ |
- |
4 |
17 |
28 |
81 |
- |
0 |
0 |
- |
- |
- |
0 |
0 |
- |
- |
|
Mid. Atlantic |
31 |
42 |
83 |
498 |
809 |
- |
0 |
8 |
- |
- |
- |
0 |
4 |
- |
- |
|
New Jersey |
N |
0 |
0 |
N |
N |
- |
0 |
2 |
- |
- |
- |
0 |
1 |
- |
- |
|
New York (Upstate) |
N |
0 |
0 |
N |
N |
- |
0 |
5 |
- |
- |
- |
0 |
2 |
- |
- |
|
New York City |
- |
0 |
0 |
- |
- |
- |
0 |
2 |
- |
- |
- |
0 |
2 |
- |
- |
|
Pennsylvania |
31 |
42 |
83 |
498 |
809 |
- |
0 |
2 |
- |
- |
- |
0 |
1 |
- |
- |
|
E.N. Central |
104 |
145 |
312 |
2,209 |
2,115 |
- |
0 |
8 |
- |
- |
- |
0 |
3 |
- |
- |
|
Illinois |
- |
38 |
73 |
535 |
203 |
- |
0 |
4 |
- |
- |
- |
0 |
2 |
- |
- |
|
Indiana |
- |
0 |
7 |
34 |
- |
- |
0 |
1 |
- |
- |
- |
0 |
1 |
- |
- |
|
Michigan |
16 |
56 |
116 |
700 |
934 |
- |
0 |
4 |
- |
- |
- |
0 |
2 |
- |
- |
|
Ohio |
87 |
44 |
106 |
847 |
867 |
- |
0 |
3 |
- |
- |
- |
0 |
1 |
- |
- |
|
Wisconsin |
1 |
5 |
50 |
93 |
111 |
- |
0 |
2 |
- |
- |
- |
0 |
1 |
- |
- |
|
W.N. Central |
24 |
22 |
72 |
429 |
440 |
- |
0 |
6 |
- |
1 |
- |
0 |
21 |
- |
- |
|
Iowa |
N |
0 |
0 |
N |
N |
- |
0 |
2 |
- |
- |
- |
0 |
1 |
- |
- |
|
Kansas |
12 |
5 |
22 |
102 |
223 |
- |
0 |
2 |
- |
1 |
- |
0 |
3 |
- |
- |
|
Minnesota |
- |
0 |
0 |
- |
- |
- |
0 |
2 |
- |
- |
- |
0 |
4 |
- |
- |
|
Missouri |
12 |
12 |
51 |
291 |
197 |
- |
0 |
3 |
- |
- |
- |
0 |
1 |
- |
- |
|
Nebraska¶ |
N |
0 |
0 |
N |
N |
- |
0 |
1 |
- |
- |
- |
0 |
6 |
- |
- |
|
North Dakota |
- |
0 |
39 |
36 |
4 |
- |
0 |
2 |
- |
- |
- |
0 |
11 |
- |
- |
|
South Dakota |
- |
0 |
4 |
- |
16 |
- |
0 |
5 |
- |
- |
- |
0 |
6 |
- |
- |
|
S. Atlantic |
41 |
71 |
163 |
748 |
1,743 |
- |
0 |
4 |
- |
- |
- |
0 |
4 |
- |
- |
|
Delaware |
- |
1 |
5 |
2 |
7 |
- |
0 |
0 |
- |
- |
- |
0 |
1 |
- |
- |
|
District of Columbia |
- |
0 |
3 |
- |
8 |
- |
0 |
2 |
- |
- |
- |
0 |
1 |
- |
- |
|
Florida |
35 |
29 |
68 |
504 |
614 |
- |
0 |
2 |
- |
- |
- |
0 |
0 |
- |
- |
|
Georgia |
N |
0 |
0 |
N |
N |
- |
0 |
1 |
- |
- |
- |
0 |
1 |
- |
- |
|
Maryland¶ |
N |
0 |
0 |
N |
N |
- |
0 |
2 |
- |
- |
- |
0 |
3 |
- |
- |
|
North Carolina |
N |
0 |
0 |
N |
N |
- |
0 |
1 |
- |
- |
- |
0 |
1 |
- |
- |
|
South Carolina¶ |
6 |
9 |
67 |
64 |
303 |
- |
0 |
0 |
- |
- |
- |
0 |
1 |
- |
- |
|
Virginia¶ |
- |
15 |
60 |
28 |
552 |
- |
0 |
0 |
- |
- |
- |
0 |
1 |
- |
- |
|
West Virginia |
- |
11 |
32 |
150 |
259 |
- |
0 |
1 |
- |
- |
- |
0 |
0 |
- |
- |
|
E.S. Central |
- |
11 |
101 |
17 |
369 |
- |
0 |
7 |
- |
- |
- |
0 |
9 |
- |
2 |
|
Alabama¶ |
- |
11 |
101 |
16 |
363 |
- |
0 |
3 |
- |
- |
- |
0 |
2 |
- |
- |
|
Kentucky |
N |
0 |
0 |
N |
N |
- |
0 |
1 |
- |
- |
- |
0 |
0 |
- |
- |
|
Mississippi |
- |
0 |
1 |
1 |
6 |
- |
0 |
4 |
- |
- |
- |
0 |
8 |
- |
1 |
|
Tennessee¶ |
N |
0 |
0 |
N |
N |
- |
0 |
2 |
- |
- |
- |
0 |
3 |
- |
1 |
|
W.S. Central |
- |
87 |
355 |
492 |
2,944 |
- |
0 |
8 |
- |
- |
- |
0 |
7 |
- |
1 |
|
Arkansas¶ |
- |
4 |
61 |
19 |
235 |
- |
0 |
1 |
- |
- |
- |
0 |
1 |
- |
- |
|
Louisiana |
- |
1 |
5 |
15 |
31 |
- |
0 |
3 |
- |
- |
- |
0 |
5 |
- |
- |
|
Oklahoma |
N |
0 |
0 |
N |
N |
- |
0 |
1 |
- |
- |
- |
0 |
1 |
- |
- |
|
Texas¶ |
- |
75 |
345 |
458 |
2,678 |
- |
0 |
6 |
- |
- |
- |
0 |
4 |
- |
1 |
|
Mountain |
15 |
33 |
83 |
470 |
830 |
- |
0 |
12 |
- |
1 |
- |
0 |
22 |
- |
1 |
|
Arizona |
- |
0 |
0 |
- |
- |
- |
0 |
10 |
- |
1 |
- |
0 |
8 |
- |
- |
|
Colorado |
15 |
13 |
44 |
203 |
322 |
- |
0 |
4 |
- |
- |
- |
0 |
10 |
- |
- |
|
Idaho¶ |
N |
0 |
0 |
N |
N |
- |
0 |
1 |
- |
- |
- |
0 |
6 |
- |
1 |
|
Montana¶ |
- |
4 |
27 |
70 |
124 |
- |
0 |
0 |
- |
- |
- |
0 |
2 |
- |
- |
|
Nevada¶ |
N |
0 |
0 |
N |
N |
- |
0 |
2 |
- |
- |
- |
0 |
3 |
- |
- |
|
New Mexico¶ |
- |
3 |
10 |
40 |
92 |
- |
0 |
1 |
- |
- |
- |
0 |
1 |
- |
- |
|
Utah |
- |
12 |
31 |
157 |
284 |
- |
0 |
2 |
- |
- |
- |
0 |
5 |
- |
- |
|
Wyoming¶ |
- |
0 |
1 |
- |
8 |
- |
0 |
0 |
- |
- |
- |
0 |
2 |
- |
- |
|
Pacific |
- |
3 |
8 |
41 |
33 |
- |
0 |
38 |
- |
- |
- |
0 |
23 |
- |
- |
|
Alaska |
- |
1 |
6 |
25 |
12 |
- |
0 |
0 |
- |
- |
- |
0 |
0 |
- |
- |
|
California |
- |
0 |
0 |
- |
- |
- |
0 |
37 |
- |
- |
- |
0 |
20 |
- |
- |
|
Hawaii |
- |
1 |
4 |
16 |
21 |
- |
0 |
0 |
- |
- |
- |
0 |
0 |
- |
- |
|
Oregon¶ |
N |
0 |
0 |
N |
N |
- |
0 |
2 |
- |
- |
- |
0 |
4 |
- |
- |
|
Washington |
N |
0 |
0 |
N |
N |
- |
0 |
1 |
- |
- |
- |
0 |
1 |
- |
- |
|
American Samoa |
N |
0 |
0 |
N |
N |
- |
0 |
0 |
- |
- |
- |
0 |
0 |
- |
- |
|
C.N.M.I. |
- |
- |
- |
- |
- |
- |
- |
- |
- |
- |
- |
- |
- |
- |
- |
|
Guam |
- |
1 |
17 |
- |
21 |
- |
0 |
0 |
- |
- |
- |
0 |
0 |
- |
- |
|
Puerto Rico |
2 |
9 |
29 |
89 |
166 |
- |
0 |
0 |
- |
- |
- |
0 |
0 |
- |
- |
|
U.S. Virgin Islands |
- |
0 |
0 |
- |
- |
- |
0 |
0 |
- |
- |
- |
0 |
0 |
- |
- |
|
C.N.M.I.: Commonwealth of Northern Mariana Islands. U: Unavailable. -: No reported cases. N: Not notifiable. Cum: Cumulative year-to-date counts. Med: Median. Max: Maximum. * Incidence data for reporting year 2008 and 2009 are provisional. † Updated weekly from reports to the Division of Vector-Borne Infectious Diseases, National Center for Zoonotic, Vector-Borne, and Enteric Diseases (ArboNET Surveillance). Data for California serogroup, eastern equine, Powassan, St. Louis, and western equine diseases are available in Table I. § Not notifiable in all states. Data from states where the condition is not notifiable are excluded from this table, except starting in 2007 for the domestic arboviral diseases and influenza-associated pediatric mortality, and in 2003 for SARS-CoV. Reporting exceptions are available at http://www.cdc.gov/epo/dphsi/phs/infdis.htm. ¶ Contains data reported through the National Electronic Disease Surveillance System (NEDSS). |
|||||||||||||||