Skip Navigation LinksSkip Navigation Links
Centers for Disease Control and Prevention
Safer Healthier People
Blue White
Blue White
bottom curve
CDC Home Search Health Topics A-Z spacer spacer
spacer
Blue curve MMWR spacer
spacer
spacer

Persons using assistive technology might not be able to fully access information in this file. For assistance, please send e-mail to: mmwrq@cdc.gov. Type 508 Accommodation and the title of the report in the subject line of e-mail.

Racial Disparities in Total Knee Replacement Among Medicare Enrollees --- United States, 2000--2006

An estimated 45% of U.S. adults might be at risk for developing symptomatic knee osteoarthritis during their lifetimes, with whites and blacks at equal risk for this common disabling condition (1). Total knee replacement (TKR) is an effective method of reducing pain and improving physical function among those with disabling knee osteoarthritis; however, whites have been more likely to undergo the procedure than blacks (2--4). As a result, a Healthy People 2010 objective* calls for eliminating racial disparities in the rate of TKR among persons aged >65 years (5). To monitor progress toward achieving this objective, CDC analyzed national and state TKR rates for Medicare enrollees for the period 2000--2006, stratified by sex, age group, and black or white race. From 2000 to 2006, the TKR rate overall in the United States increased 58%, from 5.5 to 8.7 per 1,000 population, with similar increases among whites (61%) and blacks (56%). However, the TKR rate for blacks was 37% lower than the rate for whites in 2000 (3.6 versus 5.7 per 1,000 population) and 39% lower in 2006 (5.6 versus 9.2 per 1,000 population). Health-care providers and public health agencies might help reduce this disparity by widely distributing TKR information that is tailored to the education and literacy levels and culture of patients with symptomatic knee osteoarthritis. Health-care providers should conduct, as routine practice, thorough discussions regarding knee pain symptoms and loss of physical function with older patients of all races who might be candidates for TKR (2).

National and state TKR rates for Medicare enrollees were calculated using 2000--2006 hospital claims and enrollment record data obtained from the Centers for Medicare and Medicaid Services. Analysis was restricted to U.S. residents in the 50 states and District of Columbia (DC) who were aged >65 years, entitled to Medicare Part A, and not members of managed care organizations. TKR rates were calculated per 1,000 members of this group, using population estimates on July 1 of the given year. Eligible TKR procedures were defined as International Classification of Diseases, Ninth Revision, Clinical Modification code 81.54 (total knee replacement) on hospital claims records from acute care, short-term hospitals. Partial knee replacements were excluded because they represent only 8% of all knee replacement procedures (6). Annual TKR rates and 95% confidence intervals were calculated for adults aged >65 years overall and by age group (65--74, 75--84, and >85 years), sex, black or white race, and state. For this report, estimates by race are presented only for blacks and whites because Medicare race/ethnicity data for other populations (e.g., Asians and Hispanics) are underreported and might produce misleading results (7).

Unadjusted national and state estimates were calculated to describe the actual disparity in each jurisdiction for program planning and resource allocation (8). Age-adjusted national rates using the 2000 projected U.S. population also were calculated to monitor the trend in TKR black/white disparity. Percentage changes in TKR rates from 2000 to 2006 were calculated for blacks and whites, and percentage differences between blacks and whites undergoing TKR were calculated for both years.

In 2000, a total of 26,585,955 Medicare enrollees met the study inclusion criteria; in 2006, the total was 28,382,683. The number of hospitalizations for TKR among Medicare enrollees in the study increased from 145,242 in 2000 to 248,267 in 2006 (Table 1), and the overall TKR rate increased 58% (from 5.5 to 8.7 per 1,000 population). Similar increases were observed by sex, age group, and black or white race (Table 1). In both years, the total number of procedures performed was highest among those aged 65--74 years, but the TKR rate was highest among those aged 75--84 years. TKR rates increased in all states from 2000 to 2006, with the greatest increases in Arkansas (84%), Mississippi (84%), and Delaware (83%), and the lowest increases in Iowa (35%), New Mexico (35%), and Idaho (38%). In 2006, TKR rates ranged from 13.9 in Utah to 4.5 in Hawaii.

TKR rates were 37% lower among blacks than whites (3.6 versus 5.7 per 1,000 population) in 2000, and 39% lower in 2006 (5.6 versus 9.2) (Table 2, Figure). In both years, the black/white disparity was lower among women (23% and 28%) than among men (63% and 60%). In 2006, blacks had a lower TKR rate than whites in all 50 states and DC; the smallest black/white disparities were in DC (11%), Delaware (18%), Massachusetts (18%), and Nevada (18%), and the largest were in Illinois (52%) and Pennsylvania (49%). From 2000 to 2006, the black/white disparity increased across all three age groups, among women (but not among men), and in 19 states (Table 2).

Reported by: MG Cisternas, MA, MGC Data Svcs, Carlsbad, California. L Murphy, PhD, JB Croft, PhD, CG Helmick, MD, Div of Adult and Community Health, National Center for Chronic Disease Prevention and Health Promotion, CDC.

Editorial Note:

Racial disparity in TKR procedures is an important social and public health problem, underscored by adoption of a Healthy People 2010 objective to eliminate racial disparities in TKR procedures. The findings in this report, however, confirm that little or no progress was made toward achieving this objective from 2000 to 2006. Although the numbers and rates of TKR procedures increased among Medicare enrollees in all demographic groups from 2000 to 2006, the disparity in rates between whites and blacks persisted in the nation overall and increased in 19 states.

The findings of an increase in the overall rate of TKR procedures in the United States and the substantial and continuing black/white disparities in TKR are consistent with previous reports. One report examining rates of knee and hip replacement, bypass surgery, and angioplasty from 1997 to 2001 in New York and Pennsylvania Medicare populations found an increase in the white/nonwhite disparity for joint replacements (9). An analysis of 1998--2000 Medicare data also indicated racial disparity in TKR rates (3). Rates in that study differ somewhat from those in this report, likely because of the substantial increase in the number of TKR procedures since 2000, the different geographic areas examined (i.e., nation and state compared with selected hospital referral regions), and restriction of the study population in this report to Medicare enrollees aged >65 years who were not in a managed care organization, instead of the entire Medicare enrollee population.

The precise causes of black/white disparities in TKR are unclear and likely multifactorial. The disparities are not explained by varying risk for knee osteoarthritis (1). Likewise, disparate access to health care probably does not explain the disparities. Several reports have indicated that racial disparity in TKR procedures persists even after adjusting for access to clinical care (2). However, differing knowledge, attitudes, and beliefs regarding TKR might play some role. Lower outcome expectations have been associated with unwillingness to undergo TKR; these lower expectations might result from communication gaps with health-care providers or inaccurate information from peers (2). Also, the likelihood of undergoing a joint replacement increases if a member of the patient's social network has undergone a successful joint replacement (2). Although no evidence has been presented showing racial differences in functional status after undergoing TKR, non-white Medicare beneficiaries are more likely to undergo surgery in hospitals that have fewer TKR procedures and where adverse TKR outcomes are more common (10). Negative TKR outcomes might influence members of social networks not to seek TKR. The likelihood of undergoing TKR increases with increased education (2). One study of U.S. adults found racial disparity in joint replacement use during 1998--2004 among persons aged >65 years but not among persons aged 51--64 years (4), a difference that might be attributable, in part, to a narrower education gap between blacks and whites at younger age levels.

The findings in this report are subject to at least three limitations. First, the study data were collected from Medicare hospital claims and thus depend on the accuracy of physician or administrative reporting and procedure coding. However, these data are the only available national source of hospital procedure information with complete black and white race data for persons aged >65 years. Second, all hospitalizations were analyzed, but access to individual identifiers was prohibited; therefore, some persons might have been counted twice if they underwent TKR surgery on each knee at two separate times in the same year. Finally, the analysis does not include persons in managed care organizations, a standard exception in Medicare analyses, because these organizations do not release specific claims data; in 2004, approximately 17% of all Medicare enrollees were members of managed care organizations.

Racial disparity between blacks and whites persists in TKR procedures, and the precise underlying reasons are unclear. A combined public health and clinical strategy to address racial disparity in TKR might include wider distribution of information in various public settings and equipping health-care providers with resources that enable them to have TKR discussions that are thorough and tailored to the understanding, needs, and concerns of their patients (2).

References

  1. Murphy L, Schwartz TA, Helmick CG, et al. Lifetime risk of symptomatic knee osteoarthritis. Arthritis Rheum 2008;59:1207--13.
  2. Emejuaiwe N, Jones AC, Ibrahim SA, Kwoh CK. Disparities in joint replacement utilization: a quality of care issue. Clin Exp Rheumatol 2007;25(6 Suppl 47):44--9.
  3. Skinner J, Weinstein JN, Sporer SM, Wennberg JE. Racial, ethnic, and geographic disparities in rates of knee arthroplasty among Medicare patients. N Engl J Med 2003;349:1350--9.
  4. Dunlop DD, Manheim LM, Song J, et al. Age and racial/ethnic disparities in arthritis-related hip and knee surgeries. Med Care 2008;46:200--8.
  5. US Department of Health and Human Services. Arthritis, osteoporosis, and chronic back conditions: objective 2-6. In: Healthy people 2010 midcourse review. Washington, DC: US Department of Health and Human Services; 2008. Available at http://www.healthypeople.gov/data/midcourse/pdf/fa02.pdf.
  6. Riddle DL, Jiranek WA, McGlynn FJ. Yearly incidence of unicompartmental knee arthroplasty in the United States. J Arthroplasty 2008;23:408--12.
  7. McBean AM. Improving Medicare's data on race and ethnicity. Medicare Brief 2006;(15):1--7.
  8. Fleiss JL. Reasons for and warnings against standardization. Statistical methods for rates and proportions. 2nd ed. New York, NY: John Wiley; 1981:239.
  9. Basu J, Mobley LR. Trends in racial disparities among the elderly for selected procedures. Med Care Res Rev 2008;65:617--37.
  10. Losina E, Wright EA, Kessler CL, et al. Neighborhoods matter: use of hospitals with worse outcomes following total knee replacement by patients from vulnerable populations. Arch Intern Med 2007;167:182--7.

* The initial Healthy People objective was developmental and lacked a baseline and target to enable measurement of progress. That objective read, "Eliminate racial disparities in the rate of total knee replacements." In 2006, the objective was revised to read, "Eliminate racial disparities in the rate of total knee replacements among persons aged 65 years and older. Target: 0 percent."

Additional information available at http://www.cdc.gov/nchs/data/statnt/statnt20.pdf.

Table 1
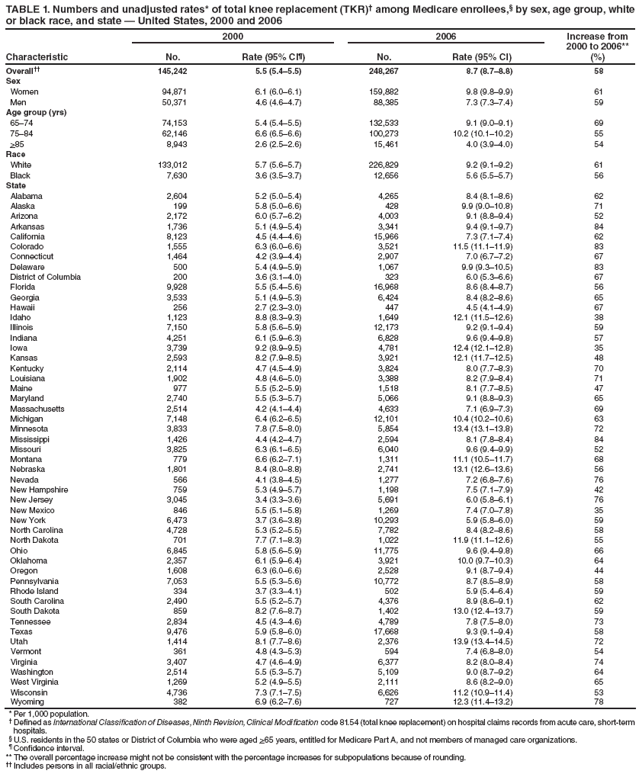
TABLE 1. Numbers and unadjusted rates* of total knee replacement (TKR)† among Medicare enrollees,§ by sex, age group, white or black race, and state — United States, 2000 and 2006
Characteristic
2000
2006
Increase from 2000 to 2006**
(%)
No.
Rate (95% CIΆ)
No.
Rate (95% CI)
Overall††
145,242
5.5 (5.4–5.5)
248,267
8.7 (8.7–8.8)
58
Sex
Women
94,871
6.1 (6.0–6.1)
159,882
9.8 (9.8–9.9)
61
Men
50,371
4.6 (4.6–4.7)
88,385
7.3 (7.3–7.4)
59
Age group (yrs)
65–74
74,153
5.4 (5.4–5.5)
132,533
9.1 (9.0–9.1)
69
75–84
62,146
6.6 (6.5–6.6)
100,273
10.2 (10.1–10.2)
55
>85
8,943
2.6 (2.5–2.6)
15,461
4.0 (3.9–4.0)
54
Race
White
133,012
5.7 (5.6–5.7)
226,829
9.2 (9.1–9.2)
61
Black
7,630
3.6 (3.5–3.7)
12,656
5.6 (5.5–5.7)
56
State
Alabama
2,604
5.2 (5.0–5.4)
4,265
8.4 (8.1–8.6)
62
Alaska
199
5.8 (5.0–6.6)
428
9.9 (9.0–10.8)
71
Arizona
2,172
6.0 (5.7–6.2)
4,003
9.1 (8.8–9.4)
52
Arkansas
1,736
5.1 (4.9–5.4)
3,341
9.4 (9.1–9.7)
84
California
8,123
4.5 (4.4–4.6)
15,966
7.3 (7.1–7.4)
62
Colorado
1,555
6.3 (6.0–6.6)
3,521
11.5 (11.1–11.9)
83
Connecticut
1,464
4.2 (3.9–4.4)
2,907
7.0 (6.7–7.2)
67
Delaware
500
5.4 (4.9–5.9)
1,067
9.9 (9.3–10.5)
83
District of Columbia
200
3.6 (3.1–4.0)
323
6.0 (5.3–6.6)
67
Florida
9,928
5.5 (5.4–5.6)
16,968
8.6 (8.4–8.7)
56
Georgia
3,533
5.1 (4.9–5.3)
6,424
8.4 (8.2–8.6)
65
Hawaii
256
2.7 (2.3–3.0)
447
4.5 (4.1–4.9)
67
Idaho
1,123
8.8 (8.3–9.3)
1,649
12.1 (11.5–12.6)
38
Illinois
7,150
5.8 (5.6–5.9)
12,173
9.2 (9.1–9.4)
59
Indiana
4,251
6.1 (5.9–6.3)
6,828
9.6 (9.4–9.8)
57
Iowa
3,739
9.2 (8.9–9.5)
4,781
12.4 (12.1–12.8)
35
Kansas
2,593
8.2 (7.9–8.5)
3,921
12.1 (11.7–12.5)
48
Kentucky
2,114
4.7 (4.5–4.9)
3,824
8.0 (7.7–8.3)
70
Louisiana
1,902
4.8 (4.6–5.0)
3,388
8.2 (7.9–8.4)
71
Maine
977
5.5 (5.2–5.9)
1,518
8.1 (7.7–8.5)
47
Maryland
2,740
5.5 (5.3–5.7)
5,066
9.1 (8.8–9.3)
65
Massachusetts
2,514
4.2 (4.1–4.4)
4,633
7.1 (6.9–7.3)
69
Michigan
7,148
6.4 (6.2–6.5)
12,101
10.4 (10.2–10.6)
63
Minnesota
3,833
7.8 (7.5–8.0)
5,854
13.4 (13.1–13.8)
72
Mississippi
1,426
4.4 (4.2–4.7)
2,594
8.1 (7.8–8.4)
84
Missouri
3,825
6.3 (6.1–6.5)
6,040
9.6 (9.4–9.9)
52
Montana
779
6.6 (6.2–7.1)
1,311
11.1 (10.5–11.7)
68
Nebraska
1,801
8.4 (8.0–8.8)
2,741
13.1 (12.6–13.6)
56
Nevada
566
4.1 (3.8–4.5)
1,277
7.2 (6.8–7.6)
76
New Hampshire
759
5.3 (4.9–5.7)
1,198
7.5 (7.1–7.9)
42
New Jersey
3,045
3.4 (3.3–3.6)
5,691
6.0 (5.8–6.1)
76
New Mexico
846
5.5 (5.1–5.8)
1,269
7.4 (7.0–7.8)
35
New York
6,473
3.7 (3.6–3.8)
10,293
5.9 (5.8–6.0)
59
North Carolina
4,728
5.3 (5.2–5.5)
7,782
8.4 (8.2–8.6)
58
North Dakota
701
7.7 (7.1–8.3)
1,022
11.9 (11.1–12.6)
55
Ohio
6,845
5.8 (5.6–5.9)
11,775
9.6 (9.4–9.8)
66
Oklahoma
2,357
6.1 (5.9–6.4)
3,921
10.0 (9.7–10.3)
64
Oregon
1,608
6.3 (6.0–6.6)
2,528
9.1 (8.7–9.4)
44
Pennsylvania
7,053
5.5 (5.3–5.6)
10,772
8.7 (8.5–8.9)
58
Rhode Island
334
3.7 (3.3–4.1)
502
5.9 (5.4–6.4)
59
South Carolina
2,490
5.5 (5.2–5.7)
4,376
8.9 (8.6–9.1)
62
South Dakota
859
8.2 (7.6–8.7)
1,402
13.0 (12.4–13.7)
59
Tennessee
2,834
4.5 (4.3–4.6)
4,789
7.8 (7.5–8.0)
73
Texas
9,476
5.9 (5.8–6.0)
17,668
9.3 (9.1–9.4)
58
Utah
1,414
8.1 (7.7–8.6)
2,376
13.9 (13.4–14.5)
72
Vermont
361
4.8 (4.3–5.3)
594
7.4 (6.8–8.0)
54
Virginia
3,407
4.7 (4.6–4.9)
6,377
8.2 (8.0–8.4)
74
Washington
2,514
5.5 (5.3–5.7)
5,109
9.0 (8.7–9.2)
64
West Virginia
1,269
5.2 (4.9–5.5)
2,111
8.6 (8.2–9.0)
65
Wisconsin
4,736
7.3 (7.1–7.5)
6,626
11.2 (10.9–11.4)
53
Wyoming
382
6.9 (6.2–7.6)
727
12.3 (11.4–13.2)
78
* Per 1,000 population.
† Defined as International Classification of Diseases, Ninth Revision, Clinical Modification code 81.54 (total knee replacement) on hospital claims records from acute care, short-term hospitals.
§ U.S. residents in the 50 states or District of Columbia who were aged >65 years, entitled for Medicare Part A, and not members of managed care organizations.
Ά Confidence interval.
** The overall percentage increase might not be consistent with the percentage increases for subpopulations because of rounding.
†† Includes persons in all racial/ethnic groups.
Return to top.
Table 2

TABLE 2. Comparison of numbers and unadjusted rates* of total knee replacement (TKR)† among Medicare enrollees§ of black or white race, by sex, age group, and state — United States, 2000 and 2006
Characteristic
2000
2006
Difference between black and white**
(%)
Difference between black and white**
(%)
Black
White
Black
White
No.
Rate
(95% CIΆ)
No.
Rate
(95% CI)
No.
Rate
(95% CI)
No.
Rate
(95% CI)
Overall
7,630
3.6 (3.5–3.7)
133,012
5.7 (5.6–5.7)
-37
12,656
5.6 (5.5–5.7)
226,829
9.2 (9.1–9.2)
-39
Sex
Women
6,211
4.8 (4.7–4.9)
85,484
6.2 (6.2–6.2)
-23
9,953
7.3 (7.2–7.5)
143,904
10.2 (10.1–10.2)
-28
Men
1,419
1.8 (1.7–1.9)
47,528
4.9 (4.9–5.0)
-63
2,703
3.1 (2.9–3.2)
82,925
7.8 (7.8–7.9)
-60
Age group (yrs)
65–74
4,352
3.8 (3.7–3.9)
67,071
5.6 (5.6–5.7)
-32
7,859
6.2 (6.0–6.3)
119,617
9.5 (9.5–9.6)
-35
75–84
2,848
4.2 (4.1–4.4)
57,646
6.8 (6.7–6.9)
-38
4,270
6.2 (6.0–6.4)
92,623
10.6 (10.6–10.7)
-42
>85
430
1.6 (1.4–1.7)
8,295
2.7 (2.6–2.8)
-41
527
1.9 (1.7–2.1)
14,589
4.2 (4.1–4.3)
-55
State
Alabama
324
3.8 (3.4–4.2)
2,248
5.5 (5.2–5.7)
-31
471
6.1 (5.6–6.7)
3,742
8.7 (8.4–9.0)
-30
Alaska
—††
—
165
6.1 (5.2–7.0)
—
—
—
348
10.6 (9.5–11.7)
—
Arizona
—
—
2,052
6.1 (5.8–6.4)
—
—
—
3,800
9.4 (9.1–9.7)
—
Arkansas
130
3.8 (3.2–4.5)
1,589
5.2 (5.0–5.5)
-27
193
6.1 (5.3–7.0)
3,094
9.7 (9.3–10.0)
-37
California
335
3.7 (3.3–4.1)
6,891
4.8 (4.7–4.9)
-23
579
5.3 (4.9–5.7)
13,431
8.0 (7.9–8.2)
-34
Colorado
—
—
1,485
6.5 (6.1–6.8)
—
51
6.4 (4.6–8.1)
3,344
11.7 (11.3–12.1)
-45
Connecticut
59
3.8 (2.8–4.8)
1,379
4.2 (4.0–4.4)
-10
117
5.4 (4.4–6.4)
2,725
7.1 (6.8–7.4)
-24
Delaware
52
5.2 (3.8–6.6)
441
5.5 (5.0–6.0)
-5
106
8.3 (6.7–9.9)
937
10.1 (9.5–10.8)
-18
District of Columbia
128
3.4 (2.8–4.0)
66
3.9 (3.0–4.9)
-13
199
5.8 (5.0–6.6)
112
6.5 (5.3–7.7)
-11
Florida
413
4.2 (3.8–4.6)
9,213
5.7 (5.6–5.8)
-26
661
5.5 (5.1–5.9)
15,697
8.9 (8.8–9.1)
-38
Georgia
541
4.2 (3.8–4.5)
2,931
5.3 (5.1–5.5)
-21
814
5.8 (5.4–6.1)
5,497
9.0 (8.7–9.2)
-36
Hawaii
—
—
78
3.3 (2.5–4.0)
—
—
—
171
6.2 (5.3–7.2)
—
Idaho
—
—
1,088
8.7 (8.2–9.2)
—
—
—
1,598
12.0 (11.4–12.6)
—
Illinois
265
2.6 (2.3–2.9)
6,724
6.1 (5.9–6.2)
-57
589
4.7 (4.3–5.0)
11,224
9.8 (9.6–10.0)
-52
Indiana
145
4.0 (3.3–4.6)
4,042
6.2 (6.0–6.4)
-35
249
6.3 (5.5–7.1)
6,498
9.8 (9.5–10.0)
-36
Iowa
—
—
3,665
9.1 (8.8–9.4)
—
—
—
4,709
12.5 (12.1–12.8)
—
Kansas
62
6.6 (5.0–8.3)
2,472
8.2 (7.9–8.5)
-20
75
7.4 (5.7–9.1)
3,753
12.2 (11.9–12.6)
-39
Kentucky
98
4.5 (3.6–5.4)
1,988
4.7 (4.4–4.9)
-4
126
5.8 (4.8–6.8)
3,652
8.1 (7.8–8.3)
-28
Louisiana
303
3.4 (3.0–3.7)
1,575
5.2 (5.0–5.5)
-35
468
5.2 (4.7–5.7)
2,886
9.0 (8.7–9.4)
-42
Maine
—
—
960
5.5 (5.1–5.8)
—
—
—
1,501
8.1 (7.7–8.5)
—
Maryland
316
3.7 (3.3–4.1)
2,366
5.9 (5.7–6.2)
-37
723
6.9 (6.4–7.4)
4,162
9.7 (9.4–9.9)
-29
Massachusetts
57
3.1 (2.3–4.0)
2,391
4.3 (4.1–4.4)
-28
133
5.9 (4.9–6.9)
4,358
7.2 (7.0–7.4)
-18
Michigan
364
3.5 (3.1–3.9)
6,672
6.7 (6.5–6.8)
-48
724
6.6 (6.1–7.1)
11,128
10.8 (10.6–11.0)
-39
Minnesota
—
—
3,756
7.8 (7.6–8.1)
—
—
—
5,703
13.4 (13.1–13.8)
—
Mississippi
235
2.9 (2.5–3.3)
1,171
4.9 (4.6–5.2)
-41
381
5.2 (4.7–5.7)
2,181
9.0 (8.6–9.3)
-42
Missouri
118
3.2 (2.6–3.8)
3,663
6.5 (6.3–6.7)
-51
203
5.1 (4.4–5.8)
5,755
9.9 (9.6–10.1)
-48
Montana
—
—
748
6.5 (6.1–7.0)
—
—
—
1,254
11.1 (10.4–11.7)
—
Nebraska
—
—
1,751
8.4 (8.0–8.8)
—
—
—
2,654
13.1 (12.6–13.6)
—
Nevada
—
—
534
4.3 (3.9–4.7)
—
56
6.2 (4.6–7.8)
1,152
7.6 (7.1–8.0)
-18
New Hampshire
—
—
755
5.3 (4.9–5.7)
—
—
—
1,182
7.6 (7.1–8.0)
—
New Jersey
170
2.3 (1.9–2.6)
2,789
3.6 (3.4–3.7)
-36
404
4.6 (4.2–5.1)
5,076
6.2 (6.0–6.4)
-26
New Mexico
—
—
717
5.5 (5.1–5.9)
—
—
—
1,106
7.7 (7.2–8.1)
—
New York
404
2.6 (2.3–2.9)
5,846
3.9 (3.8–4.0)
-33
639
3.9 (3.6–4.2)
9,156
6.3 (6.2–6.4)
-38
North Carolina
638
4.4 (4.1–4.8)
3,970
5.4 (5.2–5.6)
-19
860
6.2 (5.8–6.6)
6,783
8.8 (8.6–9.0)
-30
North Dakota
—
—
689
7.7 (7.1–8.3)
—
—
—
990
11.8 (11.1–12.5)
—
Ohio
344
4.0 (3.5–4.4)
6,402
5.9 (5.7–6.0)
-32
641
6.9 (6.3–7.4)
10,956
9.8 (9.6–9.9)
-30
Oklahoma
77
4.6 (3.5–5.6)
2,210
6.2 (5.9–6.4)
-26
122
7.6 (6.3–9.0)
3,525
10.2 (9.9–10.6)
-25
Oregon
—
—
1,574
6.4 (6.0–6.7)
—
—
—
2,455
9.2 (8.8–9.5)
—
Pennsylvania
260
3.6 (3.2–4.0)
6,690
5.6 (5.4–5.7)
-36
294
4.6 (4.0–5.1)
10,339
9.0 (8.8–9.1)
-49
Rhode Island
—
—
322
3.7 (3.3–4.1)
—
—
—
478
5.9 (5.4–6.5)
—
South Carolina
404
4.3 (3.9–4.7)
2,049
5.7 (5.5–6.0)
-25
620
6.6 (6.1–7.1)
3,711
9.4 (9.1–9.7)
-30
South Dakota
—
—
837
8.2 (7.6–8.7)
—
—
—
1,367
13.2 (12.5–13.9)
—
Tennessee
235
3.5 (3.0–3.9)
2,573
4.6 (4.4–4.8)
-24
310
5.3 (4.7–5.9)
4,412
8.0 (7.7–8.2)
-34
Texas
440
3.4 (3.1–3.7)
8,208
6.1 (6.0–6.3)
-44
820
5.4 (5.0–5.7)
15,740
9.8 (9.6–9.9)
-45
Utah
—
—
1,385
8.2 (7.8–8.7)
—
—
—
2,308
14.1 (13.5–14.6)
—
Vermont
—
—
357
4.8 (4.3–5.3)
—
—
—
588
7.4 (6.8–8.0)
—
Virginia
412
3.7 (3.4–4.1)
2,929
4.9 (4.8–5.1)
-24
643
5.8 (5.3–6.2)
5,550
8.7 (8.5–8.9)
-33
Washington
—
—
2,416
5.6 (5.3–5.8)
—
—
—
4,861
9.3 (9.0–9.6)
—
West Virginia
—
—
1,218
5.1 (4.8–5.4)
—
—
—
2,039
8.5 (8.2–8.9)
—
Wisconsin
67
5.1 (3.9–6.4)
4,599
7.4 (7.1–7.6)
-31
98
7.1 (5.7–8.5)
6,433
11.3 (11.0–11.6)
-37
Wyoming
—
—
373
6.9 (6.2–7.7)
—
—
—
708
12.3 (11.4–13.2)
—
* Per 1,000 population.
† Defined as International Classification of Diseases, Ninth Revision, Clinical Modification code 81.54 (total knee replacement) on hospital claims records from acute care, short-term hospitals.
§ U.S. residents in the 50 states or District of Columbia who were aged >65 years, entitled for Medicare Part A, and not members of managed care organizations.
Ά Confidence interval.
** The overall percentage difference might not be consistent with the percentage differences for subpopulations because of rounding.
†† Number is less than 50, making rate estimate potentially unreliable.
Return to top.
Figure

FIGURE. Age-adjusted rates* of total knee replacement† among Medicare enrollees,§ by white or black race — United States, 2000–2006
Return to top.

Use of trade names and commercial sources is for identification only and does not imply endorsement by the U.S. Department of Health and Human Services.


References to non-CDC sites on the Internet are provided as a service to MMWR readers and do not constitute or imply endorsement of these organizations or their programs by CDC or the U.S. Department of Health and Human Services. CDC is not responsible for the content of pages found at these sites. URL addresses listed in MMWR were current as of the date of publication.

All MMWR HTML versions of articles are electronic conversions from typeset documents. This conversion might result in character translation or format errors in the HTML version. Users are referred to the electronic PDF version (http://www.cdc.gov/mmwr) and/or the original MMWR paper copy for printable versions of official text, figures, and tables. An original paper copy of this issue can be obtained from the Superintendent of Documents, U.S. Government Printing Office (GPO), Washington, DC 20402-9371; telephone: (202) 512-1800. Contact GPO for current prices.

**Questions or messages regarding errors in formatting should be addressed to mmwrq@cdc.gov.

Date last reviewed: 2/19/2009

HOME  |  ABOUT MMWR  |  MMWR SEARCH  |  DOWNLOADS  |  RSSCONTACT
POLICY  |  DISCLAIMER  |  ACCESSIBILITY

Safer, Healthier People

Morbidity and Mortality Weekly Report
Centers for Disease Control and Prevention
1600 Clifton Rd, MailStop E-90, Atlanta, GA 30333, U.S.A

USA.GovDHHS

Department of Health
and Human Services