|
|
|
|
|
|
|
| ||||||||||
|
|
|
|
|
|
|
||||
| ||||||||||
|
|
|
|
|
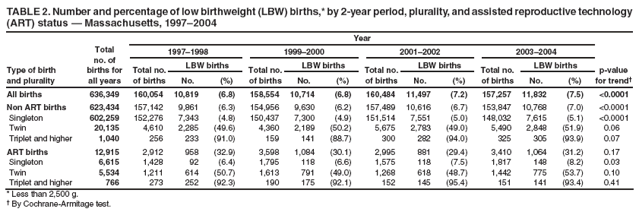
Persons using assistive technology might not be able to fully access information in this file. For assistance, please send e-mail to: mmwrq@cdc.gov. Type 508 Accommodation and the title of the report in the subject line of e-mail. Assisted Reproductive Technology and Trends in Low Birthweight --- Massachusetts, 1997--2004Low birthweight (LBW) (<2,500 g) is an important cause of infant morbidity and mortality (1). The rate of LBW has been steadily increasing in the United States. In 2005, the most recent year for which data are available, LBW represented 8.2% of all births, the highest level reported in the past 4 decades (2). The use of assisted reproductive technology (ART)* has been associated with LBW (3,4). Research in 1999 indicated that, in Massachusetts during 1989--1996, the rate of LBW increased, paralleling the national trend, and an increasing percentage of LBW infants were born to mothers aged >35 years and to mothers with more education.† These findings suggested that a proportion of LBW births might be attributable to infertility treatment; however, at that time, no information was available from birth certificate records to examine whether ART was associated with the increasing rates of LBW. To investigate the role of ART, the Massachusetts Department of Public Health (MDPH) and CDC linked birth certificate records to ART records for the years 1997--2004 (the most recent data available). This report summarizes the results of that analysis, which indicated that, on average, 2% of births during the period resulted from ART; however, 7% of LBW births resulted from ART. The rate of LBW increased during this period among non-ART singletons (from 4.8% to 5.1%), accounting for an additional 407 LBW infants, and among ART singletons (from 6.4% to 8.2%), accounting for an additional 59 LBW infants. Although ART contributes disproportionately to LBW, only a small percentage of the excess LBW births in Massachusetts are explained by ART; therefore, other causes for the increase in LBW should be examined. The analysis was conducted by merging birth certificate records and ART records for 1997--2004. After all births in Massachusetts, information for birth certificate records is abstracted by hospital staff and sent to the Massachusetts Registry of Vital Records and Statistics. All clinics that perform ART report standardized data without personal identifiers for every ART procedure to CDC, as mandated by the Federal Fertility Clinic Success Rate and Certification Act.§ For this analysis, investigators linked birth certificate records with live-birth ART records in 2-year intervals (5). Birth certificate records and ART records were included based on mother's residence in Massachusetts. A deterministic linkage was performed using maternal and infant dates of birth and plurality. Questions regarding duplicate matches were resolved using postal code of residence. A total of 13,025 ART records were linked to a birth certificate record, representing 83% of eligible ART births. These were defined as Massachusetts ART births. ART records not linked to birth certificate records (n = 2,684 [17% of eligible ART births]) were excluded. During 1997--2004, a total of 713 births (0.1% of birth records) occurred in which use of ART was recorded on the birth certificate but the births were not linked to a Massachusetts live-birth ART record. These births were excluded because whether they reflected mothers who had undergone ART procedures in another state or were simply missed by the linkage could not be established. All other births were defined as non-ART births. Gestational age at birth was obtained from the clinical estimate in weeks recorded on the birth certificate record. Births were excluded if the gestational age was not deemed realistic or not consistent with viability (i.e., <24 weeks [n = 1,329 (0.2%)] or >43 weeks [n = 5,229 (0.8%)]). Birthweight was obtained from the birth certificate record. Birthweight was missing for 203 infants (0.03%). Therefore, for the study period, a total of 636,349 births (98.8% of all birth certificate records) were included in the analysis, 623,434 non-ART (98%) and 12,915 ART (2%) births. LBW percentages were calculated for births overall and by ART status and plurality. The population attributable risk percentage (PAR%) for LBW resulting from ART was calculated for each 2-year period. The Cochrane-Armitage test for trend was used to test for changes over time. During 1997--2004 in Massachusetts, the percentage of births resulting from ART ranged from 1.8% to 2.3% (Table 1). During this period, 7.0% of all LBW births were attributable to ART (PAR% range: 5.9%--8.1%). From 1997--1998 to 2003--2004, the percentage of LBW among all infants increased from 6.8% to 7.5% (p-value for trend <0.0001) (Table 2). The percentage of LBW births increased among non-ART births overall (from 6.3% to 7.0%; p-value for trend <0.0001) and among non-ART singleton births (from 4.8% to 5.1%; p-value for trend <0.0001). Among ART singleton births, the percentage of LBW births also increased (from 6.4% to 8.2%; p-value for trend = 0.03). After adjusting for the change in the distribution of births by plurality from 1997 to 2004, 407 additional LBW non-ART singleton births and 59 additional LBW ART singleton births occurred during 2003--2004 compared with 1997--1998. The percentage of LBW births did not increase among twin births or among triplet and higher order multiple births. Reported by: BB Cohen, PhD, Z Zhang, MD, A Nannini, PhD, Massachusetts Dept of Public Health. SL Farr, PhD, JE Anderson, PhD, DJ Jamieson, MD, M Macaluso, MD, Div of Reproductive Health, National Center for Chronic Disease Prevention and Health Promotion; NK Tepper, MD, EIS Officer, CDC. Editorial Note:In 1996, Massachusetts introduced a question on its birth certificate form regarding the use of fertility assistance; however, this item has only 30% sensitivity for ART treatment.¶ Linking birth certificate records with ART records provides a more sensitive measure of use of ART than birth certificate records alone. Using linked records, the analysis in this report determined that, during 1997--2004 in Massachusetts, although ART accounted for 2% of all births, approximately 7% of LBW births were attributable to ART. However, LBW in Massachusetts increased among both ART and non-ART singletons, and only a small part of the increase in LBW might be explained by ART. Despite substantial improvements in the United States in infant survival and outcomes, a steady increase in the rate of LBW has occurred. During 1984--2005, the rate of LBW in the United States increased 22%, from 6.7% to 8.2% of all births (2). The rate of LBW among all singletons also increased 7% since 2000, from 6.0% to 6.4% (2). Although the contribution of ART to national rates of LBW is not known, these results from one state are important to consider in the context of increasing rates of LBW nationwide. Certain factors increase the risk for LBW, such as prematurity, congenital abnormalities, maternal hypertension and diabetes, maternal smoking and drug use, infections, placental abnormalities, socioeconomic factors, and multiple gestations (6,7). LBW also has been associated with ART, but a large part of the elevated risk for LBW among ART births has been attributed to an increased incidence of multiple gestations (3). ART also has been associated with LBW among singleton births. However, for those births, the etiology is less clear; studies have shown potential effects stemming from the treatment itself and from underlying infertility (3). Other factors might be contributing to the increase among non-ART births, such as an increase in delayed childbearing (7) or iatrogenic preterm delivery (8). The findings in this report are subject to at least four limitations. First, ART births might have been misclassified as non-ART births if they were not linked to an ART record. However, given the 83% linkage rate of ART records, potential underestimation of ART births would not substantially affect results. Second, some births might have been misclassified as Massachusetts ART births if they were missing residency information but involved mothers who underwent ART in Massachusetts and delivered in one of three neighboring states. Third, the reliability of information from birth records is variable. However, birthweight from birth certificate records has been shown to have high accuracy when compared with medical records (9). Finally, births occurring at <24 weeks' gestation, the conventional limit of infant viability, were not included in the analysis. Although these births tend to be LBW, they represented only 0.2% of eligible birth records. The excess LBW births in Massachusetts during 1997--2004 is largely not explained by ART, although ART disproportionately contributed to the overall prevalence of LBW. Future LBW research and prevention efforts are needed and should include 1) determining the risk factors that contribute to increasing rates of LBW among non-ART births, and 2) investigating additional risk factors and etiologies for LBW among ART singleton births. Additionally, further reducing rates of multiple gestation resulting from ART, as recommended by the Society for Assisted Reproductive Technology and the American Society for Reproductive Medicine (10), and making clinicians more aware of the elevated risk for LBW among ART births also might reduce this outcome among ART births. Acknowledgments The findings in this report are based, in part, on contributions by the Society for Assisted Reproductive Technology. References
* ART includes infertility treatments in which both eggs and sperm are handled in a laboratory for the purpose of establishing a pregnancy. Procedures include in vitro fertilization, gamete intrafallopian transfer, zygote intrafallopian transfer, embryo cryopreservation, and surrogate birth. † Additional information available at http://www.cdc.gov/mmwr/preview/mmwrhtml/00056908.htm. § Fertility Clinic Success Rate and Certification Act of 1992 (FCSRCA), Public Law 102--493, October 24, 1992. Additional information available at http://www.popline.org/docs/1270/087273.html and http://wwwn.cdc.gov/dls/art/fcsrca.aspx. ¶ Zhang Z, Schieve L, Macaluso M, Cohen B, Nannini A, Wright V. Evaluation of assisted reproductive technology reporting on the Massachusetts birth certificates. Presented at the 12th Annual Maternal and Child Health Epidemiology Conference, December 6--8, 2006, Atlanta, GA. Table 1
All MMWR HTML versions of articles are electronic conversions from typeset documents. This conversion might result in character translation or format errors in the HTML version. Users are referred to the electronic PDF version (http://www.cdc.gov/mmwr) and/or the original MMWR paper copy for printable versions of official text, figures, and tables. An original paper copy of this issue can be obtained from the Superintendent of Documents, U.S. Government Printing Office (GPO), Washington, DC 20402-9371; telephone: (202) 512-1800. Contact GPO for current prices. **Questions or messages regarding errors in formatting should be addressed to mmwrq@cdc.gov.Date last reviewed: 1/28/2009 |
|||||||||
|
![TABLE 1. Percentage of all births resulting from assisted reproductive technology (ART) and population attributable risk percentage (PAR%) of low birthweight (LBW)* attributable to ART,† by 2-year period — Massachusetts, 1997–2004
Year
1997–1998
1999–2000
2001–2002
2003–2004
Total
Births from ART (%)
1.8
2.3
1.9
2.2
2.0
PAR% LBW attributable to ART
7.1
8.1
5.9
6.9
7.0
* Less than 2,500 g.
† PAR% = [(Incidence LBWTotal - Incidence LBWNon-ART) / Incidence LBWTotal] x 100. For example, during 1997–1998, PAR% = [(6.76 – 6.28) / 6.76] x 100 = 7.10](figures/m803a1t1.gif)