|
|
|
|
|
|
|
| ||||||||||
|
|
|
|
|
|
|
||||
| ||||||||||
|
|
|
|
|
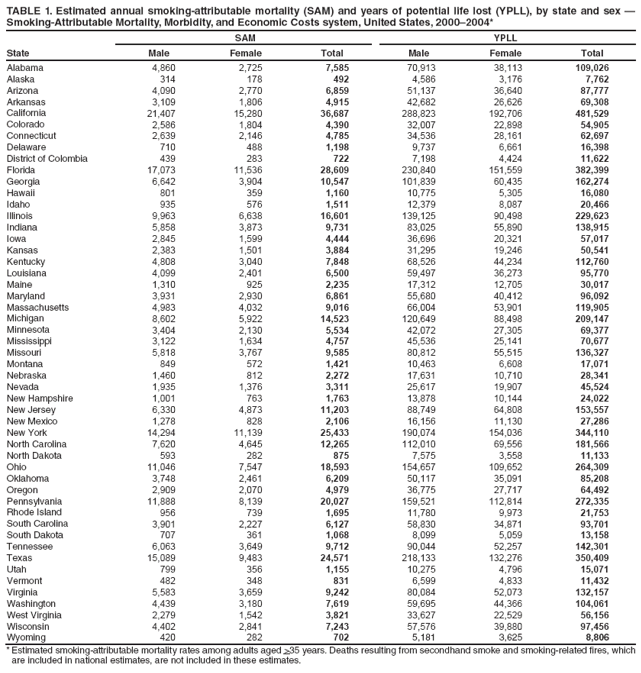
Persons using assistive technology might not be able to fully access information in this file. For assistance, please send e-mail to: mmwrq@cdc.gov. Type 508 Accommodation and the title of the report in the subject line of e-mail. State-Specific Smoking-Attributable Mortality and Years of Potential Life Lost --- United States, 2000--2004Please note: An erratum has been published for this article. To view the erratum, please click here. Smoking can cause lung and other cancers, coronary heart disease, stroke, chronic respiratory disease, and other diseases (1). In 2008, CDC reported that cigarette smoking and exposure to secondhand smoke resulted in an estimated 443,000 deaths and 5.1 million years of potential life lost (YPLL) annually in the United States during 2000--2004 (2). This report presents state-specific average annual smoking-attributable mortality (SAM) and YPLL estimates for the same period among adults aged >35 years. The report also compares 2000--2004 average annual SAM rates per 100,000 population with rates for 1996--1999. The analysis was based on data from CDC's Smoking-Attributable Mortality, Morbidity, and Economic Costs (SAMMEC) system.* Substantial variation in average annual number of deaths attributed to smoking during 2000--2004 occurred among the states (range: 492 [Alaska] to 36,687 [California]). From 1996--1999 to 2000--2004, declines in SAM rates occurred in 49 states and the District of Columbia (DC), reflecting progress made in lowering smoking prevalence in the United States during the past 40 years. Rates declined in men in 49 states and DC, but declined in women in only 32 states. To reduce SAM rates further, comprehensive evidence-based approaches for preventing smoking initiation and increasing cessation need to be implemented fully, and states should fund tobacco control activities at the level recommended by CDC (3,4). State-specific SAM and YPLL from smoking were estimated by using SAMMEC. Sex- and age-specific SAMs were calculated by multiplying the total number of deaths among adults aged >35 years from 19 diseases caused by cigarette smoking (1) by estimates of the smoking-attributable fraction (SAF)† of preventable deaths for each disease. The attributable fractions provide estimates of the public health burden of each risk factor and the relative importance of risk factors for multifactorial diseases (2). SAFs were derived using sex-specific relative risk (RR) estimates for current and former smokers for each cause of death from the American Cancer Society's Cancer Prevention Study-II (CPS-II) for the period 1982--1988. For ischemic heart disease and cerebrovascular disease mortality, RR estimates were stratified by age (35--64 years and >65 years). Sex- and age-specific (35--64 years and >65 years) current and former cigarette smoking prevalence estimates from the Behavioral Risk Factor Surveillance System (BRFSS) were used to calculate the SAFs. Smoking-attributable YPLL were estimated by multiplying sex- and age-specific SAM by remaining life expectancy at the time of death. State-specific SAM rates per 100,000 population by sex for a given year were calculated using state SAM estimates for the year and population estimates from the U.S. Census Bureau. International Classification of Diseases, Ninth Revision (ICD-9) codes were used for cause of death in 1996--1998, whereas International Classification of Diseases, Tenth Revision (ICD-10) codes were used for 1999--2004 data. Comparability ratios (5) from ICD-9 to ICD-10 were applied to 1996--1998 data to enable comparisons with 2000--2004 data. Data for the years 2000--2004 were used in this report because they correspond to the years available to states in the SAMMEC system to calculate their state-specific SAM estimates. Infant deaths caused by smoking during pregnancy, deaths from exposure to secondhand smoke, and smoking-related fire deaths (2) were not included in the state-specific estimates. During 2000--2004, the state-specific median estimate of the average annual number of smoking-attributable deaths among adults aged >35 years was 5,534 (range: 492 [Alaska] to 36,687 [California]). SAM estimates for males ranged from 314 (Alaska) to 21,407 (California) and the SAM estimates for females ranged from 178 (Alaska) to 15,280 (California). For every state, the annual number of smoking-related deaths was higher among males than females (Table 1). The average annual YPLL estimates ranged from 7,762 (Alaska) to 481,529 (California). The YPLL estimates ranged from 4,586 (Alaska) to 288,823 (California) for males and from 3,176 (Alaska) to 192,706 (California) for females (Table 1). During 2000--2004, overall average annual SAM rates per 100,000 population were lowest in Utah (138.3), Hawaii (167.6), and Minnesota (215.1), and highest in Kentucky (370.6), West Virginia (344.3), and Nevada (343.7) (Table 2). Median SAM rates per 100,000 population overall were 288.1 for 1996--1999 and 263.3 for 2000--2004 (Table 2). Changes in smoking-attributable deaths per 100,000 population during these two periods varied among states; SAM rates among adults declined the most in Nevada (-44.4 deaths per 100,000 population), California (-37.8), and Virginia (-33.4). Average annual overall SAM rates decreased from 1996--1999 to 2000--2004 in all states except Oklahoma, which experienced an increase of 26.9 deaths per 100,000. Compared with 1996--1999, average annual SAM rates declined in 2000--2004 among men in all states except Oklahoma, but increased among women in several states (Alabama, Arizona, Arkansas, Georgia, Indiana, Kansas, Kentucky, Louisiana, Mississippi, Michigan, North Carolina, Ohio, Oklahoma, South Carolina, South Dakota, Tennessee, Texas) and DC (Table 2). Reported by: B Adhikari, PhD, J Kahende, PhD, A Malarcher, PhD, C Husten, MD, K Asman, MSPH, National Center for Chronic Disease Prevention and Health Promotion, CDC. Editorial Note:During 2000--2004, substantial variation occurred in the estimated absolute number of deaths caused by cigarette smoking across the 50 states and DC. Such variations have been observed previously and are the result of differences across states in total population size, demographic characteristics of state populations, and in smoking prevalence (6,7). Estimates of absolute SAM within states do not appear to have decreased from 1990 to 2004 (7) despite declines in smoking prevalence in the majority of states.§ The lack of change in absolute SAM over time is likely attributable to long-term population increases and the inclusion of additional smoking-related diseases in the SAM calculation as recent scientific studies have identified additional diseases caused by smoking (1). The analysis in this report used the latest SAMMEC methodology to retrospectively calculate SAM rates in 1996--1999 and compare those with SAM rates in 2000--2004.¶ The results showed that SAM rates decreased in 49 states and DC, but declined in women in only 32 states. This overall progress in decreasing SAM rates in the United States reflects the growth and effectiveness of tobacco control programs and progress in decreasing SAM rates. However, the results also indicate that more progress was made in reducing SAM rates in men than in women and that further efforts are needed to reduce SAM rates among both sexes. The findings in this report are subject to at least five limitations. First, the estimates understate deaths attributable to all tobacco use because estimates of deaths attributable to cigar smoking, pipe smoking, and smokeless tobacco use were not included. Second, RRs were based on deaths during 1982--1988 among birth cohorts who might have had different smoking histories than current or former smokers in 2000--2004 (e.g., age of initiation and duration of smoking before quitting). CDC is continuing to monitor whether the RRs for smoking are changing over time. CDC is considering whether to use updated RRs for future SAMMEC estimates, particularly for females, because more recent cohorts of female smokers took up smoking at younger ages than did earlier cohorts (8). Third, RRs from CPS-II were adjusted for the effects of age but not for other possible confounders (e.g., alcohol use and education level). However, research suggests that alcohol and other confounders had little effect on SAM estimates for lung cancer, chronic obstructive pulmonary disease, ischemic heart disease, and cerebrovascular disease (2). Fourth, BRFSS does not survey persons in households without landline telephones, raising concerns about the representativeness of landline telephone surveys. However, persons without landlines are more likely to be younger than age 35 years (9) and therefore less likely to be included in these estimates. Finally, some states have low response rates for BRFSS. Lower response rates indicate a potential for response bias; however, BRFSS estimates for current cigarette smoking are comparable to smoking estimates from other surveys with higher response rates (10). SAM is one measure that is used to monitor the public health burden of cigarette smoking in the United States (2) and in each state. These most recent SAM estimates indicate that in recent years cigarette smoking continued to impose a substantial health burden on U.S. adults in all states. Changes in SAM rates across time quantify the potential gain that can be realized from effective tobacco control programs that decrease smoking initiation and increase smoking cessation (3).** The Institute of Medicine has called for aggressive action to end the tobacco epidemic (4). Fully implementing effective state comprehensive tobacco control programs, as recommended by CDC (3), can further reduce smoking prevalence and deaths caused by cigarette smoking in all states and increase life expectancy. References
* SAMMEC estimates state-specific SAM and YPLL based on data from the Behavioral Risk Factor Surveillance System and death certificate data from the National Center for Health Statistics. The computations also use other data elements; available at http://apps.nccd.cdc.gov/sammec. † SAFs for each disease are calculated using the following equation: SAF = [(p1(RR1 -- 1) + p2(RR2 -- 1)] / [p1(RR1 -- 1) + p2(RR2 -- 1) + 1], where p1 = percentage of current smokers (persons who have smoked >100 cigarettes and now smoke every day or some days), p2 = percentage of former smokers (persons who have smoked >100 cigarettes and do not currently smoke), RR1 = relative risk for current smokers relative to never smokers, and RR2 = relative risk for former smokers relative to never smokers. § State-level data on tobacco use prevention and control are available through the State Tobacco Activities and Evaluation (STATE) System at http://apps.nccd.cdc.gov/statesystem. ¶ Data on cigarette smoking prevalence used to calculate the state-specific SAM estimates are from BRFSS, which uses a multistage sampling design primarily to generate state estimates. When aggregated, these state SAM estimates are comparable to the national estimate (2), which was calculated using cigarette smoking prevalence data from the National Health Interview Survey (after excluding infant deaths caused by smoking during pregnancy, deaths from exposure to secondhand smoke, and smoking-related fire deaths). ** Additional information on effective tobacco-control programs is available from CDC's Guide to Community Preventive Services at http://www.thecommunityguide.org/tobacco. Table 1
All MMWR HTML versions of articles are electronic conversions from typeset documents. This conversion might result in character translation or format errors in the HTML version. Users are referred to the electronic PDF version (http://www.cdc.gov/mmwr) and/or the original MMWR paper copy for printable versions of official text, figures, and tables. An original paper copy of this issue can be obtained from the Superintendent of Documents, U.S. Government Printing Office (GPO), Washington, DC 20402-9371; telephone: (202) 512-1800. Contact GPO for current prices. **Questions or messages regarding errors in formatting should be addressed to mmwrq@cdc.gov.Date last reviewed: 1/22/2009 |
|||||||||
|