|
|
|
|
|
|
|
| ||||||||||
|
|
|
|
|
|
|
||||
| ||||||||||
|
|
|
|
|
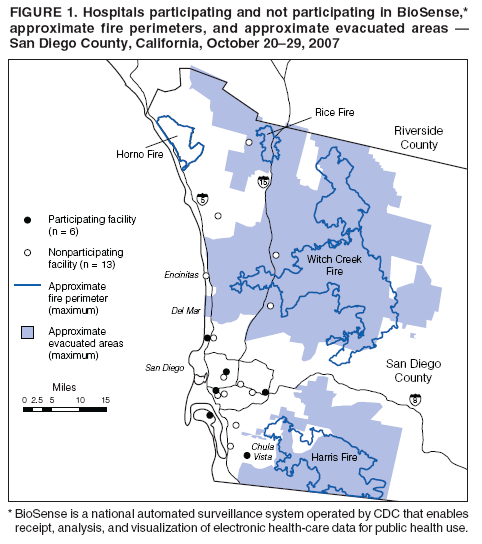
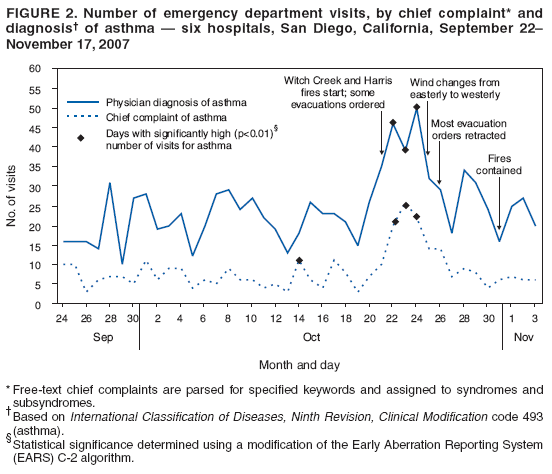
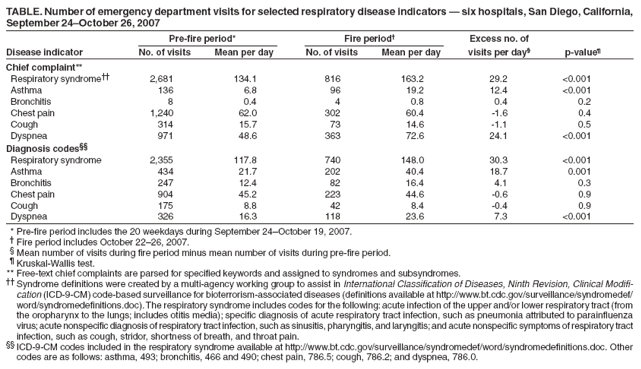
Persons using assistive technology might not be able to fully access information in this file. For assistance, please send e-mail to: mmwrq@cdc.gov. Type 508 Accommodation and the title of the report in the subject line of e-mail. Monitoring Health Effects of Wildfires Using the BioSense System --- San Diego County, California, October 2007During October 21--26, 2007, wildfires consumed hundreds of thousands of acres and forced the evacuation of more than 300,000 persons in San Diego County, California (1). During large-scale emergencies, data are needed to assess health effects, plan response, and evaluate response adequacy (2). This report describes some of the health effects of the wildfires based on data from the CDC BioSense system, which receives emergency department (ED) patient chief complaint information and physician diagnosis codes from six hospitals in San Diego County. Analysis of these data indicated that ED visits for respiratory disease, especially those associated with dyspnea and asthma, increased during a 5-day fire period compared with the preceding 20 weekdays. For the six hospitals combined, visits for dyspnea increased from 48.6 to 72.6 per day, and visits with diagnoses of asthma increased from 21.7 to 40.4 per day. Local, state, and federal public health personnel should continue collaborative efforts to expand and monitor automated surveillance systems so that timely information is available during emergencies. BioSense is a national system that enables receipt, analysis, and visualization of electronic health-care data for public health use (3). Data are available simultaneously to local, state, and federal public health officials and hospital personnel through BioSense, which can be accessed through the CDC Secure Data Network. Hospitals are included in the system based on their ability to supply appropriate electronic data and their willingness to participate. In October 2007, data were being received from EDs at 413 nonfederal hospitals in the United States, including six of the 19 hospitals in San Diego County. These six hospitals were located near but outside the fire and evacuation areas (Figure 1). Data received by BioSense included age, sex, free-text patient-reported chief complaints, and diagnosis codes (usually International Classification of Diseases, Ninth Revision, Clinical Modification [ICD-9-CM] codes). As part of standard procedure, diagnoses are assigned to one or more disease indicators, including 11 general syndromes (e.g., respiratory* and gastrointestinal) and 78 more specific subsyndromes (e.g., asthma and dyspnea), on the basis of reference tables (4,5). Free-text chief complaints are parsed automatically for specified keywords and assigned to these syndromes and subsyndromes. Median times from patient visit to receipt of ED data at CDC are 8 hours (interquartile range [IQR] = 0.8--20.8 hours) for chief complaints and 5 days (IQR = 1.5--8.5 days) for diagnosis codes. Once received at CDC, these data are processed and made available in BioSense within 2--3 hours. The daily count of visits meeting the criteria for each disease indicator is displayed on time-series graphs and compared with the number expected based on a 7-day moving average. A modification of the Early Aberration Reporting System (EARS) C-2 algorithm (5,6) is used to determine statistical significance, which is expressed as a recurrence interval (i.e., the number of expected days between counts as high as those observed). For this report, single-day visit counts with a recurrence interval of >100 days (analogous to p<0.01) were considered statistically significant. During October 22--30, 2007, CDC personnel monitored BioSense for evidence of health effects possibly related to the wildfires in San Diego County. These data were provided to applicable federal, state, and local public health officials and emergency managers each day. CDC personnel monitored for increases in respiratory disease, gastrointestinal diseases (multiple boil-water orders had been issued), burns, and cardiac dysrhythmias (which have been associated with carbon monoxide and cyanide toxicity from smoke inhalation). Because increased activity was found primarily for respiratory diseases, data in this report are limited to the respiratory syndrome and five respiratory subsyndromes (asthma, bronchitis, chest pain, cough, and dyspnea). The fire period was defined as October 22--26, 2007. First, BioSense was examined for evidence of single-day increases in the daily count of visits with selected disease indicators among ED patients during the fire period. Next, pooled visit counts from the 5-day fire period were compared with a 20-day pre-fire period. Because the fire period included only weekdays, and because the average number of ED visits differed on weekdays compared with weekends, the 20 weekdays during September 24--October 19 were used as the pre-fire period. For the pooled data, the number of visits for a given indicator per hospital per day (normalized by dividing by the mean number of visits for the indicator per day for the hospital during both periods combined) in the pre-fire versus fire period were compared by using the nonparametric Kruskal-Wallis test. Visits for and diagnoses of asthma increased on October 22, the day after the wildfire started, were significantly high for 3 days (October 22--24), and declined on October 25 after a change in wind speed and direction improved conditions (Figure 2). Asthma chief complaints also were significantly high on 1 day (October 14) during the pre-fire period. Peak asthma chief complaint and diagnosis visit counts were higher during the fire period than they had been in >6 months. Data from individual hospitals indicated that asthma chief complaints and diagnosis visit counts were each high on at least 1 day during the fire period at four of the six hospitals. Analysis of pooled chief complaint visit counts indicated that the mean number of ED visits per day was 653.0 during the pre-fire period, compared with 680.8 during the fire period (p=0.2). Comparison of chief complaint visit counts in the pre-fire versus fire periods showed significant increases for the respiratory syndrome (from 134.1 to 163.2 mean visits per day; 29.2 excess visits per day), asthma (12.4 excess visits per day), and dyspnea (24.1 excess visits per day) (Table). Comparison of diagnosis codes during the pre-fire versus fire periods showed increases in visits for the respiratory syndrome, asthma, and dyspnea, with 30.3, 18.7, and 7.3 excess visits per day, respectively. Reported by: M Ginsberg, J Johnson, San Diego County Health and Human Svcs Agency. J Tokars, C Martin, R English, G Rainisch, W Lei, P Hicks, J Burkholder, M Miller, K Crosby, K Akaka, Div of Emergency Preparedness and Response, National Center for Public Health Informatics; A Stock, Div of Environmental Hazards and Health Effects, National Center for Environmental Health; D Sugerman, EIS Officer, CDC. Editorial Note:Community smoke exposures resulting from wildfires have been associated with increased ED and hospital admissions for chronic obstructive pulmonary disease, bronchitis, asthma, and chest pain (7--9). Therefore, CDC recommends that persons with asthma take precautions to minimize exposure to wildfire smoke (10). In the San Diego County wildfires of October 2007, substantial numbers of adverse health effects likely were avoided by timely evacuation orders (implemented with an emergency telephone notification system and follow-up visits by law enforcement personnel to ensure compliance), school closures, health communications, and other measures implemented by local authorities. On October 25, a decrease in wind speed allowed containment of the fires, and a change in wind direction blew smoke away from populated areas. Nevertheless, this analysis indicated increased ED visits for respiratory indicators, especially asthma, in a subset of San Diego hospitals. Postdisaster health surveillance often is implemented on an ad hoc basis, sometimes employing inconsistent methods and event definitions (2). If available in the affected area, existing electronic biosurveillance systems can provide data immediately (i.e., without the delay experienced when an ad hoc system is initiated) and provide data from the predisaster period for comparison. The findings in this report are subject to at least two limitations. First, whether the six nonfederal San Diego County hospitals that participate in BioSense are representative of other area hospitals is uncertain. Second, misclassifications might have occurred because of limitations of patient-reported chief complaints, which are subjective, and diagnosis codes, which have well-recognized limitations. Moreover, the same patient might have made more than one visit on different days, and the same visit might have been classified as showing more than one disease indicator (e.g., a visit with a chief complaint of "asthma and shortness of breath" would have been included in both the asthma and dyspnea categories, but counts from these two categories were analyzed separately and not added together). BioSense is undergoing several changes that will expand its population coverage, provide greater access to additional data types (e.g., microbiology laboratory data), increase capabilities for collaboration with state and local health departments, and upgrade its technical capabilities. A current strength is the ability to provide simple measures of illnesses, such as asthma associated with wildfires, which can be derived from chief complaints or diagnoses and affect large populations. The same data streams can be used to monitor infections, injuries, and chronic diseases; conduct routine surveillance (e.g., for seasonal influenza); and monitor adverse health effects during large gatherings (e.g., the World Series) and during disasters. These systems can be valuable to state and local officials who are primarily responsible for emergency response and disaster management. Especially when an incident involves multiple jurisdictions, having an aggregate, centralized view of real-time data analyzed and presented with consistent methods can be useful to assess health effects, evaluate response adequacy, and determine whether additional action is required. References
* Syndrome definitions were created by a multi-agency working group to assist in ICD-9-CM code-based surveillance for bioterrorism-associated diseases (definitions available at http://www.bt.cdc.gov/surveillance/syndromedef/word/syndromedefinitions.doc). The respiratory syndrome includes codes for the following: acute infection of the upper and/or lower respiratory tract (from the oropharynx to the lungs; includes otitis media); specific diagnosis of acute respiratory tract infection, such as pneumonia attributed to parainfluenza virus; acute nonspecific diagnosis of respiratory tract infection, such as sinusitis, pharyngitis, and laryngitis; and acute nonspecific symptoms of respiratory tract infection, such as cough, stridor, shortness of breath, and throat pain.
Figure 1
All MMWR HTML versions of articles are electronic conversions from typeset documents. This conversion might result in character translation or format errors in the HTML version. Users are referred to the electronic PDF version (http://www.cdc.gov/mmwr) and/or the original MMWR paper copy for printable versions of official text, figures, and tables. An original paper copy of this issue can be obtained from the Superintendent of Documents, U.S. Government Printing Office (GPO), Washington, DC 20402-9371; telephone: (202) 512-1800. Contact GPO for current prices. **Questions or messages regarding errors in formatting should be addressed to mmwrq@cdc.gov.Date last reviewed: 7/9/2008 |
|||||||||
|