 |
|
|
|
|
|
|
| ||||||||||
|
|
|
|
|
|
|
||||
| ||||||||||
|
|
|
|
|
Persons using assistive technology might not be able to fully access information in this file. For assistance, please send e-mail to: mmwrq@cdc.gov. Type 508 Accommodation and the title of the report in the subject line of e-mail. Tobacco Use Among Students Aged 13--15 Years --- Sri Lanka, 1999--2007Tobacco use is one of the major preventable causes of premature death and disease in the world (1). The World Health Organization (WHO) attributes approximately 5 million deaths per year to tobacco use, a number expected to exceed 8 million per year by 2030 (2). In 1999, the Global Youth Tobacco Survey (GYTS) was initiated by WHO, CDC, and the Canadian Public Health Association to monitor tobacco use, attitudes about tobacco use, and exposure to secondhand smoke (SHS) among students aged 13--15 years. Since 1999, the survey has been completed by approximately 2 million students in 151 countries (3). A key goal of GYTS is for countries to repeat the survey every 4 years. This report summarizes results from GYTS conducted in Sri Lanka in 1999, 2003, and 2007. The findings indicated that during 1999--2007, the percentage of students aged 13--15 years who reported current cigarette smoking decreased, from 4.0% in 1999 to 1.2% in 2007. During this period, the percentage of never smokers in this age group likely to initiate smoking also decreased, from 5.1% in 1999 to 3.7% in 2007. Future declines in tobacco use in Sri Lanka will be enhanced through development and implementation of new tobacco-control measures and strengthening of existing measures that encourage smokers to quit, eliminate exposure to SHS, and encourage persons not to initiate tobacco use. GYTS is a school-based survey that collects data on students aged 13--15 years using a standardized methodology for constructing the sample frame, selecting schools and classes, and processing data. The Sri Lanka GYTS uses a two-stage cluster sample design that produces representative samples of students in grades 8--10, which are associated with ages 13--15 years (3). At the first sampling stage, school selection was proportional to the number of students enrolled in grades 8--10. At the second stage, classes within the selected schools were randomly selected. All students attending school in the selected classes on the day the survey was administered were eligible to participate. A weighting factor was applied to each student record to adjust for nonresponse (by school, class, and student) and probability of selection at the school and class levels (3). A final adjustment sums the weights by grade and sex to the population of school children in the selected grades in each sample site (3). In 1999, a total of 2,896 students completed GYTS; 1,845 did so in 2003, and 1,764 did so in 2007. The school response rate was 85.7% in 1999, 100% in 2003, and 100% in 2007. The class response rate was 100% in all survey years. The student response rate was 89.0% in 1999, 79.1% in 2003, and 85.0% in 2007. The overall response rate was 76.3% in 1999, 79.1% in 2003, and 85.0% in 2007.* This report describes changes during 1999--2007 in several important tobacco-use indicators, including 1) lifetime cigarette smoking†; 2) current cigarette smoking§; 3) current use of other tobacco products¶; 4) likely initiation of smoking in the next year among never smokers (i.e., susceptibility) (4)**; 5) exposure to SHS in public places††; 6) exposure to pro-tobacco advertising and promotion, either direct (e.g., exposure to billboards, newspapers, and magazines) or indirect (having been offered a free cigarette by a cigarette company representative or having an object with a cigarette logo on it)§§; 7) cessation efforts (among current smokers)¶¶; and 8) tobacco education.*** Statistical differences were determined by comparing 95% confidence intervals; nonoverlapping confidence intervals were considered statistically significant. Data are based on at least 35 respondents for each denominator. The percentage of students aged 13--15 years in Sri Lanka who reported lifetime cigarette smoking declined from 1999 (12.1%) to 2003 (6.3%); the percentage in 2007 (5.1%) was not significantly different from 2003 (Table 1). Boys were more likely than girls to have ever smoked cigarettes in 1999 and 2003, but no significant difference was observed in 2007. For boys, current cigarette smoking decreased from 1999 (6.2%) to 2007 (1.6%); for girls the percentage did not change significantly. Boys were more likely than girls to smoke cigarettes in 1999, but no significant difference was observed in 2003 and 2007. Current use of other tobacco products remained unchanged from 1999 and 2007, both overall and for both sexes. Boys were more likely than girls to use other tobacco products in 1999, but no significant difference was observed in 2003 and 2007. Current use of other tobacco products was higher than cigarette smoking overall in 1999, 2003, and 2007; for boys in 2003 and 2007; and for girls in 1999 and 2003. The percentage of never smokers who were susceptible to initiation of smoking did not change significantly from 1999 to 2007, both overall and for both sexes. Susceptibility was higher for boys than girls in 1999, but no significant difference was observed in 2003 and 2007. The percentage of students who reported that their parents smoke decreased from 50.8% in 1999 to 41.2% in 2003 to 29.9% in 2007; however, exposure to SHS in public places remained unchanged over time (67.9% in 1999 and 65.9% in 2007) (Table 2). Support for a ban on smoking in public places did not change from 1999 (91.4%) to 2007 (87.9%). Exposure to cigarette advertising and promotion decreased from 1999 to 2007. The percentage of students who saw pro-cigarette advertisements on billboards did not change from 1999 to 2003 but decreased from 2003 (79.3%) to 2007 (67.4%). The percentage of students who saw pro-cigarette advertisements in newspapers or magazines decreased from 1999 to 2007 (83.4% in 1999, 78.4% in 2003, and 68.4% in 2007). The percentage of students who owned an item with a cigarette brand logo on it did not change from 1999 to 2003 but decreased from 2003 (11.0%) to 2007 (5.7%). The percentage of students who reported receiving free cigarettes from a cigarette company representative decreased from 1999 (6.4%) to 2007 (3.0%). In 2007, 76.5% of current smokers indicated that they would like to stop smoking; this percentage was not significantly different from 1999 to 2007. The percentage of students who reported having been taught in school during the past school year about the dangers of tobacco use increased from 1999 (62.7%) to 2003 (79.8%) but remained unchanged from 2003 to 2007 (72.8%). Reported by: PW Gunasekara, Ministry of Education, Sri Lanka. K Rahman, PhD, DN Sinha, MD, South-East Asia Regional Office, World Health Organization, New Delhi, India. CW Warren, PhD, J Lee, MPH, V Lea, MPH, S Asma, DDS, CDC. Editorial Note:The findings in this report indicate that, among students aged 13--15 years in Sri Lanka, cigarette smoking and the likely initiation of smoking by never smokers decreased from 1999 to 2007, whereas other tobacco use remained unchanged over time. During 1999--2007, other tobacco use was consistently higher than cigarette smoking. Some of the changes in tobacco use reflected in this analysis can be attributed to various tobacco-control policies implemented by the government of Sri Lanka (2). In 2003, Sri Lanka ratified the WHO Framework Convention on Tobacco Control (WHO FCTC) (5). In 2006, the Parliament of Sri Lanka enacted the National Authority on Tobacco and Alcohol Act (NATAA) (6). NATAA includes 1) a ban on smoking in health-care, education, and government facilities and in universities, indoor offices, and other indoor workplaces; 2) prohibition of pro-tobacco advertisements on national television and radio, in local magazines and newspapers, on billboards, at point of sale, and on the Internet; and 3) a ban on tobacco-product promotions, such as free distribution, promotional discounts, and sponsored events. In concordance with NATAA, Sri Lanka has enacted strong enforcement policies (2). Exposure to pro-cigarette advertising and promotion declined from 1999 to 2007, but exposure to SHS in public places did not decrease. One reason for this might be that the NATAA ban on SHS exposure does not include smoking in restaurants, pubs, or bars; thus, the overall impact of the ban might be limited. To protect the health of all persons from the harmful effects of SHS, WHO recommends that countries enact and enforce legislation requiring all indoor workplaces and public places to be 100% smoke-free (7). GYTS has been shown to be useful for monitoring the impact of NATAA provisions (3), and it will be a useful data source for monitoring the impact of the WHO FCTC. The findings in this report are subject to at least three limitations. First, because the sample surveyed was limited to youths attending school, it is not representative of all Sri Lanka youths aged 13--15 years. Second, the findings apply only to youths who were in school on the day the survey was administered and who completed the survey. However, student response was high (89% in 1999, 79% in 2003, and 85% in 2007), suggesting that bias attributed to absence or nonresponse was limited. Finally, data are based on self-reports of students, who might have underreported or overreported their tobacco use or that of their parents. The extent of this bias cannot be determined; however, responses to tobacco-related questions on surveys similar to GYTS have shown good test-retest reliability (8). Comprehensive tobacco-control programs are the most effective means to reduce tobacco use (1). Such programs include demand-reduction measures (primarily those that increase the price of tobacco) and other interventions, such as restrictions on smoking in public places and work places, a complete ban on advertising and promotion by tobacco companies, dissemination of information on the health consequences of smoking through various media (e.g., prominent warning labels on cigarette packets and counter-marketing campaigns), and development and implementation of school-based educational programs in combination with community-based activities. Although current cigarette smoking is low among students aged 13--15 years in Sri Lanka (1.2% in 2007), future declines in the use of other tobacco products will depend on development of new measures aimed at those products. References
* The overall response rate is calculated as the school response rate × the class response rate × the student response rate. † Based on a positive response to the question, "Have you ever tried or experimented with cigarette smoking, even one or two puffs?" § Based on a response of "1 or more days" to the question, "During the past 30 days (1 month), on how many days did you smoke cigarettes?" ¶ Based on positive responses to either of the following questions: "During the past 30 days (1 month), did you use any form of smoked tobacco products other than cigarettes (e.g., cigars, water pipe, cigarillos, little cigars, or pipes)?" and "During the past 30 days (1 month), did you use any form of smokeless tobacco products (e.g., chewing tobacco, snuff, or dip)?" ** Based on a responses of anything but "definitely no" to the questions, "If your best friend offered you a cigarette, would you smoke it?" and "Do you think you will try smoking a cigarette in the next year?" †† Based on a response of "1 or more days" to the question, "During the past 7 days, on how many days have people smoked in your presence, in places other than your home?" §§ Based on 1) a response of "a lot" or "a few" to the question, "During the past 30 days (1 month), how many advertisements for cigarettes have you seen on billboards?" 2) a response of "a lot" or "a few" to the question, "During the past 30 days (1 month), how many advertisements or promotions for cigarettes have you seen in newspapers or magazines?" 3) a positive response to the question, "Do you have something (t-shirt, pen, backpack, etc.) with a cigarette brand logo on it?" and 4) a positive response to the question, "Has a cigarette company representative ever offered you a free cigarette? ¶¶ Based on a response of "1 or more days" to the question, "During the past 30 days (1 month), on how many days did you smoke cigarettes?" and a positive response to the question, "Do you want to stop smoking now?" *** Based on a positive response to the question, "During this school year, were you taught in any of your classes about the dangers of smoking?"
Table 1 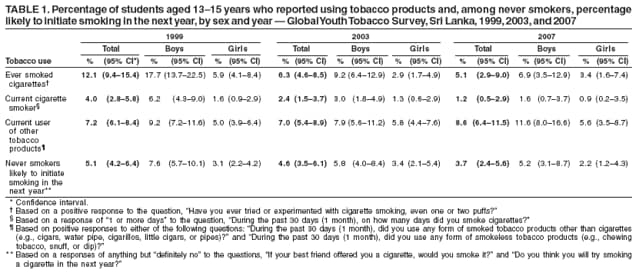 Return to top. Table 2 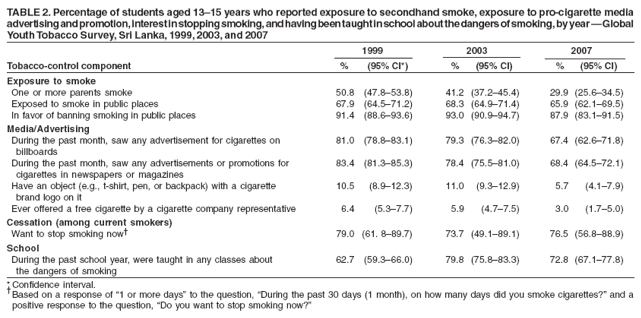 Return to top.
All MMWR HTML versions of articles are electronic conversions from typeset documents. This conversion might result in character translation or format errors in the HTML version. Users are referred to the electronic PDF version (http://www.cdc.gov/mmwr) and/or the original MMWR paper copy for printable versions of official text, figures, and tables. An original paper copy of this issue can be obtained from the Superintendent of Documents, U.S. Government Printing Office (GPO), Washington, DC 20402-9371; telephone: (202) 512-1800. Contact GPO for current prices. **Questions or messages regarding errors in formatting should be addressed to mmwrq@cdc.gov.Date last reviewed: 5/21/2008 |
|||||||||
|