|
|
|
|
|
|
|
| ||||||||||
|
|
|
|
|
|
|
||||
| ||||||||||
|
|
|
|
|
|
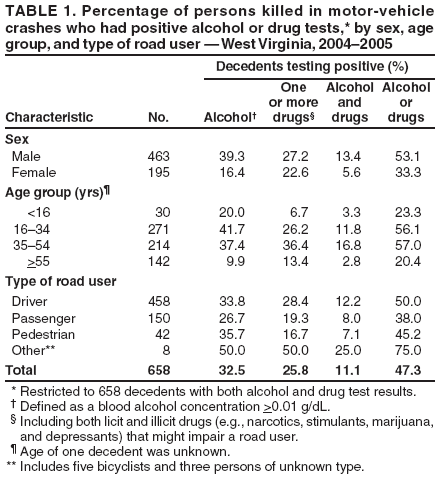
Persons using assistive technology might not be able to fully access information in this file. For assistance, please send e-mail to: mmwrq@cdc.gov. Type 508 Accommodation and the title of the report in the subject line of e-mail. Alcohol and Other Drug Use Among Victims of Motor-Vehicle Crashes --- West Virginia, 2004--2005Alcohol use is a well-established risk factor for motor-vehicle crashes (1). In 2005, approximately 39% of all traffic fatalities in the United States were alcohol related (2). Evidence of driver impairment from use of drugs other than alcohol is less definitive. In 2005, an estimated 4.3% of persons in the United States reported driving under the influence of a drug used recreationally during the preceding year, and an unknown percentage drove while impaired by drugs being used for medical reasons (3). To measure the prevalence of alcohol and drug use among persons killed in motor-vehicle crashes in West Virginia (where test results were available for >80% of fatalities), CDC analyzed 2004 and 2005 data reported by the West Virginia Office of the Chief Medical Examiner (OCME) to the Fatality Analysis Reporting System (FARS) of the National Highway Traffic Safety Administration (NHTSA). This report summarizes the results of that analysis, which determined that the prevalence of drug use (25.8%) was similar to the prevalence of a blood alcohol concentration (BAC) >0.08 g/dL (27.7%) among persons killed in motor-vehicle crashes. These results suggest that drug use contributes substantially to driver impairment in West Virginia. Measuring the magnitude of this problem nationally will require better surveillance data. Both surveillance and the development of prevention measures are hampered by difficulties in quantifying and defining drug impairment. FARS is an active, nationwide, population-based surveillance system for motor-vehicle crashes that occur on public roadways and result in the death of a road user (e.g., driver, passenger, pedestrian, or bicyclist) within 30 days (4). FARS draws on law enforcement records, which include the results of alcohol and drug tests performed on persons killed in these crashes. In 2005, drug test results were available for fewer than half of all fatalities in FARS. However, in West Virginia, OCME routinely screens all victims of motor-vehicle fatalities for evidence of impairment from alcohol and licit and illicit drugs, including narcotics (e.g., heroin and opioid analgesics), marijuana, stimulants (e.g., cocaine and amphetamines), depressants (e.g., benzodiazepines and barbiturates), and other licit drugs (e.g., antidepressants and antihistamines) that might impair a road user. OCME confirms positive screening tests with gas chromatography/mass spectrometry testing. If multiple drugs are reported, FARS records up to three drugs based on the following priority order: 1) narcotics, 2) depressants, 3) stimulants, 4) marijuana, and 5) other licit drugs. Drugs administered to decedents by emergency medical service providers are not included. Results of hospital toxicology screenings performed on specimens before death are not included in FARS data from West Virginia unless no other valid postmortem specimen is available. In 2004 and 2005, a total of 784 motor-vehicle fatalities resulted from crashes on public roads in West Virginia. Of these, 663 (84.6%) had alcohol test results, 660 (84.2%) had drug test results, and 658 (83.9%) had both. Those not tested were typically persons who did not have a valid antemortem sample available and survived too long after the crash for valid postmortem toxicologic testing. Among all drug tests, 78.6% were conducted on blood or both blood and urine. Nearly all of the remaining tests were urine tests only. OCME detected alcohol in 32.5% of decedents tested for both alcohol and drugs (Table 1). Illegal BACs (>0.08 g/dL) were detected in 27.7% of decedents, and BACs ranging from 0.01 to 0.07 g/dL were detected in 4.9%. The prevalence of detectable blood alcohol was higher in males and highest among persons aged 16--34 years. Drivers were more likely to have detectable blood alcohol levels than passengers. Detectable levels of at least one drug were reported for 170 (25.8%) decedents. Of these, 149 (87.6%) had positive blood tests, and 21 (12.4%) had positive urine tests. The prevalence of detectable drug levels was higher in males and highest among persons aged 35--54 years. Drivers were more likely to have detectable drug levels than passengers. Among women and persons aged >55 years, drugs were more prevalent than alcohol. Nearly half (47.3%) of all decedents had alcohol or drugs in their bodies; 11.1% had both. Among decedents with detectable blood alcohol levels, 34.1% tested positive for drugs. Among decedents with no detectable blood alcohol levels, 21.8% tested positive for drugs. Opioid analgesics and depressants were each found in 7.3% of tested decedents (Table 2). The three most common opioid analgesics were hydrocodone, oxycodone, and methadone. The depressants reported were sedatives and muscle relaxants, of which benzodiazepines accounted for 83.3%. The most common benzodiazepines were diazepam and alprazolam. Methamphetamines were involved in four of the five amphetamine reports. Overall, 7.6% of decedents and 9.0% of drivers had two or more of the five different types of drugs in their bodies. Reported by: J Kaplan, MD, J Kraner, PhD, West Virginia Office of the Chief Medical Examiner. L Paulozzi, MD, Div of Unintentional Injury Prevention, National Center for Injury Prevention and Control, CDC. Editorial Note:The effects of drugs other than alcohol on drivers have been studied by laboratory testing of volunteers and epidemiologic studies comparing drug-positive and drug-negative drivers after crashes (5--8). Results vary by type of drug. Laboratory studies suggest marijuana and benzodiazepines impair driving performance, but the results of studies of crashes are inconsistent. Persons who are new users of opioid analgesics likely have impaired driving skills, but the low prevalence of opioids among drivers in previous crash studies has made their association with crash responsibility difficult to study. Evidence that stimulants impair driving performance is inconsistent. New users, occasional users, and persons who have increased their doses of drugs generally are more impaired than persons who have become tolerant of drugs through steady use, such as persons taking drugs daily as prescribed. Both combining alcohol with drugs and use of multiple drugs increase the risk for crashes. The percentage of drug-positive drivers typically is lower than the percentage of alcohol-positive drivers in U.S. studies of motor-vehicle crashes (6). Recent reviews indicate that 5%--25% of drivers involved in motor-vehicle crashes have positive drug tests (5--7). An NHTSA study of U.S. motor-vehicle crashes during 1990--1991 determined that drugs were involved in 17.8% of driver fatalities (9). Marijuana has been the most common drug found in such studies of fatally injured drivers in North America, followed by cocaine, benzodiazepines, and amphetamines (6). This report differs from previous reports in terms of the relatively high prevalence of drugs among drivers in West Virginia and the finding that prescription drugs (e.g., opioid analgesics and depressants) were more prevalent than illicit drugs. In certain demographic groups of decedents, drugs were more prevalent than alcohol. The findings in West Virginia cannot be extrapolated to the entire United States because of possible local differences in alcohol or drug use patterns. However, these results might reflect recent nationwide growth in the volume of prescriptions for opioid analgesics and other potentially impairing medications. Such drugs are at times taken in combination or with alcohol. In an average week, at least 25% of U.S. adults take five or more prescription or over-the-counter drugs, and 7% take five or more prescription drugs (10). These results might also reflect a recent increase in abuse of prescription drugs; the number of U.S. persons who started recreational use of opioid analgesics, sedatives, and tranquilizers in the previous year increased substantially from 1990 to 2003 (3). The findings in this report are subject to at least four limitations. First, FARS drug data lack detail; they do not describe the degree of intoxication, the type of use (medical or recreational), or the decedent's familiarity with the drug. Second, detection of a drug in a urine test might reflect previous drug use rather than use at the time of the crash. Third, the involvement of some types of drugs might have been underestimated because FARS captures data on only three drugs. Finally, this study can only estimate the contribution of drug and alcohol impairment to motor-vehicle crash mortality because some impaired drivers who died might not have been responsible for their crashes and because impaired drivers who survived crashes that killed other road users were not included. Enforcement has been the primary approach to drug-impaired driving. However, enforcement has been hampered by technical challenges to performing sophisticated forensic testing in the field, difficulties obtaining laboratory results in time for legal proceedings, and lack of consensus on which levels or combinations of drugs constitute impairment. In addition, most states do not apply additional penalties for using drugs in combination with alcohol, so limited incentive exists to pay for drug tests in alcohol-impaired drivers (6). These problems also explain the incomplete data on drug use in FARS and the difficulties of performing epidemiologic studies of the crash risks from drugs. Given the changing patterns of drug use in the United States, especially the increased use and abuse of prescription drugs, annual testing of a representative sample of U.S. traffic fatalities for drug use should be considered. This sample might provide the basis for additional studies of the crash risk associated with specific types of drugs. References
|
Use of trade names and commercial sources is for identification only and does not imply endorsement by the U.S. Department of
Health and Human Services. |
Disclaimer All MMWR HTML versions of articles are electronic conversions from ASCII text into HTML. This conversion may have resulted in character translation or format errors in the HTML version. Users should not rely on this HTML document, but are referred to the electronic PDF version and/or the original MMWR paper copy for the official text, figures, and tables. An original paper copy of this issue can be obtained from the Superintendent of Documents, U.S. Government Printing Office (GPO), Washington, DC 20402-9371; telephone: (202) 512-1800. Contact GPO for current prices.
**Questions or messages regarding errors in formatting should be addressed to mmwrq@cdc.gov.Date last reviewed: 12/6/2006
|
|
|||||
|
HOME |
ABOUT MMWR |
MMWR SEARCH |
DOWNLOADS |
RSS
|
CONTACT
|
|||||
|
|
|||||
|