|
|
|
|
|
|
|
| ||||||||||
|
|
|
|
|
|
|
||||
| ||||||||||
|
|
|
|
|
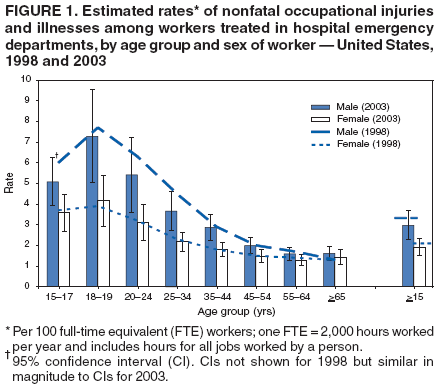
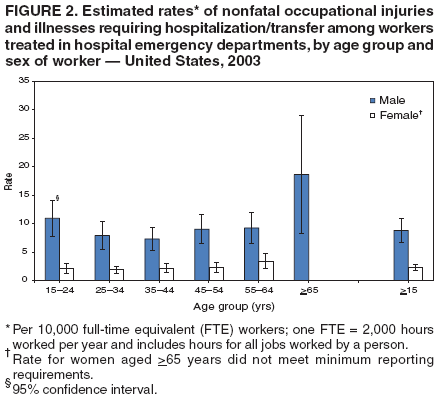
Persons using assistive technology might not be able to fully access information in this file. For assistance, please send e-mail to: mmwrq@cdc.gov. Type 508 Accommodation and the title of the report in the subject line of e-mail. Nonfatal Occupational Injuries and Illnesses Among Workers Treated in Hospital Emergency Departments --- United States, 2003CDC's National Institute for Occupational Safety and Health (NIOSH) collects data on nonfatal occupational injuries and illnesses through the National Electronic Injury Surveillance System (NEISS), an emergency department (ED)-based surveillance system. This report summarizes data for 2003. The overall number and rate of occupational injuries and illnesses did not change substantially during the 5-year period since data were last reported in 1998 (1). In 2003, age-, sex-, and diagnosis-related patterns of injury and illness among workers treated in EDs (ED-treated injuries/illnesses) were similar to those reported in 1998. To achieve substantial decreases in these injuries and illnesses, prevention efforts must focus on effective, targeted workplace-safety interventions for diverse occupations. The Consumer Product Safety Commission (CPSC) administers NEISS, a national stratified probability sample of U.S. hospitals with 24-hour EDs that tracks product-related injuries/illnesses that are not work related. In addition, CPSC collaborates with CDC to collect data for two adjunct programs: the NIOSH work-related injuries/illnesses program (NEISS-Work) (1,2) and the NEISS All-Injury Program (NEISS-AIP) (3). NEISS-Work tracks nonfatal work-related injuries and illnesses by using the CPSC ED surveillance system. These cases are in addition to the CPSC product-related cases, and the cases are mutually exclusive. NEISS-AIP collects data on all injuries, regardless of consumer-product involvement or work relatedness (i.e., it tracks all other types of injuries in addition). The case-capture criteria are similar but not identical for the two adjunct programs (e.g., NEISS-Work includes illnesses whereas NEISS-AIP does not). This report presents data solely from NEISS-Work, which tracks cases reported at 67* of the 101 hospitals in the CPSC NEISS sample. Work-related injuries/illnesses were identified from ED chart review. A case was defined as work related if the injury or illness was sustained by a civilian noninstitutionalized worker while working for pay or other compensation, working on a farm, or volunteering for an organization (e.g., volunteer fire department), without regard to self-employment and full- or part-time work (2). Common illnesses (e.g., colds or other viral infections) or revisits to the same ED for a previously treated injury or illness were excluded. Cases were assigned statistical weights based on a sampling frame of national hospital ED visits in 2002 (SMG Marketing Group, Chicago, Illinois). The weights were summed to provide national estimates of the number of work-related ED-treated injuries/illnesses. Rates for ED-treated injuries and illnesses were calculated using 2003 Current Population Survey (CPS) employment estimates of full-time equivalent (FTE) workers on the basis of total hours worked (i.e., one FTE = 2,000 hours worked per year and includes hours for all jobs worked by a person) (4). CPS is a monthly household survey of the U.S. civilian noninstitutionalized population aged >15 years that includes wage and salary workers, self-employed workers, part-time workers, and unpaid workers in family-operated enterprises; volunteers for organizations are excluded (4). The rate numerator and denominator populations are the same except that the NEISS-Work injury/illness estimates include volunteers. National injury/illness estimates are reported for all ages; rates are reported for workers aged >15 years. The total number of injuries/illnesses reported for 2003 (3,402,200 [95% confidence interval (CI) = ±772,500] for all ages) and rate (2.5 [CI = ±0.6] per 100 FTE workers aged >15 years) did not change significantly (p>0.05) from the 1998 estimates (3,600,000 [CI = ±600,000]; rate: 2.9 [CI = ±0.5]) (1). Similarly, the injury/illness rate distribution by age and sex demonstrated the same trends (i.e., generally decreasing with increasing age). Although young males had higher rates than young females, rates by sex converged with increasing age (Figure 1). The distribution of injury/illness diagnoses also was similar in 2003, compared with 1998. In 2003, a total of 2,702,100 (CI = ±609,100) injuries/illnesses (79%) occurred in five diagnostic categories: sprains and strains (27%); lacerations, punctures, amputations, and avulsions (24%); contusions, abrasions, and hematomas (18%); dislocations and fractures (7%); and burns (3%). The cases in these five diagnostic categories were primarily among workers aged 15--24 years (22%) and those aged 25--54 years (70%). Although workers aged 25--54 years had almost three fourths of the injuries/illnesses, the injury/illness rate of 3.7 (CI = ±1.1) per 100 FTE workers for workers aged 15--24 years was twice that for workers aged 25--54 years (1.9 [CI = ±0.4]) and three times that for workers aged >55 years (1.2 [CI = ±0.2]). Age-specific rates in the diagnostic categories decreased with increasing age, with the exception of dislocations/fractures, for which rates were similar across age groups (aged 15--24 years: 0.23 per 100 FTE workers [CI = ±0.05]; aged 25--54 years: 0.17 [CI = ±0.04]; and aged >55 years: 0.19 [CI = ±0.04]). For NEISS, the injury/illness disposition (i.e., treated and released versus treated and hospitalized) is an indicator of severity. In 2003, nearly 97% of injured/ill workers were treated and released. Approximately 2% (81,600 [CI = ±18,100]) of the ED-treated cases resulted in the worker being hospitalized or transferred to another hospital (e.g., a higher-level trauma center or burn hospital) in which the injured/ill worker was presumed to have been hospitalized. Among all hospitalized workers, fractures/dislocations were the most common diagnoses (35%). For patients requiring hospitalization, injury/illness rates were similar for males with increasing age, except for male workers aged >65 years (Figure 2). These oldest workers (6% of hospitalized males) had an apparent, although not statistically significant, hospitalization rate twice that of any younger male age group. Fractures were the predominant injury in hospitalized males aged >65 years (47%). The age-specific rates for ED-treated injuries/illnesses among females requiring hospitalization increased with age. Across age groups, males had hospitalization rates three to five times higher than females. Reported by: SM Marsh, SJ Derk, LL Jackson, Div of Safety Research, National Institute for Occupational Safety and Health, CDC. Editorial Note:The findings in this report describe work-related nonfatal injuries and illnesses treated in U.S. hospital EDs. The findings from 2003 are comparable to earlier results from 1998 (1,2) and 1996 (5). These findings suggest that the ED-treated injury/illness numbers and rates, along with demographic and diagnosis trends, have remained nearly unchanged in recent years. Younger workers, particularly males, continue to have the highest overall rates of injury/illness. Hospitalization rates were more uniform across age groups (except for the oldest workers), and male workers had substantially higher hospitalization rates than females. Sprains/strains and tissue damage resulting from lacerations, punctures, amputations, avulsions, contusions, abrasions, and hematomas continued to represent the majority of ED-treated injuries/illnesses, which often required immediate medical attention but might have varied in severity. The annual Survey of Occupational Injuries and Illnesses, conducted by the U.S. Bureau of Labor Statistics (BLS), provides another estimate of injury/illness burden. BLS reports the number and rate of work-related, nonfatal injuries and illnesses that private industry employers record under U.S. Department of Labor reporting rules. Although NEISS-Work uses these reporting rules as guidelines for identifying work-related injuries and illnesses, the two programs measure different aspects of the occupational injury/illness burden: the BLS survey is based on employer reports, and NEISS-Work is based on information provided by injured/ill workers at the time of ED treatment. Moreover, the BLS survey excludes self-employed persons, persons working for private households, government workers, and workers on farms with fewer than 11 employees. NEISS-Work includes all of these categories of workers. The BLS survey records injuries/illnesses treated in all medical venues, not only EDs. For each year during 2002--2004, BLS reported decreasing numbers and rates of nonfatal injuries and illnesses in private industry (4.7, 4.4, and 4.3 million cases [rates: 5.3, 5.0, and 4.8 cases per 100 FTE workers], respectively) (6). Similarly, during the years 1997--2001, before the Occupational Safety and Health Administration (OSHA) revised recordkeeping requirements in 2002 (resulting in a break in the series), general nonfatal injury and illness trends decreased among private industry employers (7). In contrast, findings from the NEISS-Work program indicate that ED-treated injuries/illnesses among all workers did not change significantly in 2003, compared with 1998. The findings in this report are subject to at least four limitations. First, the small NEISS sample of 67 hospitals contributes to large standard errors (e.g., 10%--15%); thus, detecting statistically significant trends is difficult, compared with the BLS survey, which collects data from nearly 180,000 employers with mandatory reporting requirements (6). The percent relative standard errors for the BLS estimates were reported to be 1%, suggesting that some of the differences observed in the BLS data are statistically significant (8). Second, the large CIs in NEISS-Work estimates might obscure an actual decrease in ED-treated injuries/illnesses from 3.6 million in 1998 to 3.4 million in 2003. Third, NEISS captures only those injuries/illnesses among workers treated in hospital EDs. Data from 1988 suggest that only one third of all medically treated occupational injuries/illnesses among workers were treated in EDs (1). Recent trends in ED usage by workers are unknown and might have shifted, obscuring actual fluctuations in time-based trends. Finally, both the BLS survey and NEISS are subject to potential underreporting by employers and injured/ill workers. The BLS survey is based on OSHA logs maintained by employers. Through NEISS, work relatedness is determined by chart review; neither a workers' compensation claim nor employer confirmation is required to indicate work relatedness. Thus, omission of work-related injury/illness details in the chart would result in underreporting that might or might not have varied during the 5-year period. NEISS-Work is used to track progress toward Healthy People 2010 objectives, which target a 30% reduction in the rate of ED-treated injuries/illnesses among workers aged 15--17 years from a 1998 baseline of 4.9 per 100 FTE workers to a target of 3.5 by the end of the current decade (9). The findings in this report suggest that young workers continue to be at high risk for occupational injuries and illnesses. NEISS-Work data did not indicate overall downward trends in injuries/illnesses as reported to BLS by private industry employers. Strategies to address age-specific safety (e.g., among young workers) (10) and general workplace safety concerns must continue to be developed and improved to effectively reduce injuries and illnesses. References
* Because of hospital closures and other nonparticipation/nonresponse factors, the number of reporting hospitals can vary.
Figure 1
Disclaimer All MMWR HTML versions of articles are electronic conversions from ASCII text into HTML. This conversion may have resulted in character translation or format errors in the HTML version. Users should not rely on this HTML document, but are referred to the electronic PDF version and/or the original MMWR paper copy for the official text, figures, and tables. An original paper copy of this issue can be obtained from the Superintendent of Documents, U.S. Government Printing Office (GPO), Washington, DC 20402-9371; telephone: (202) 512-1800. Contact GPO for current prices. **Questions or messages regarding errors in formatting should be addressed to mmwrq@cdc.gov.Date last reviewed: 4/27/2006 |
|||||||||
|