 |
|
|
|
|
|
|
| ||||||||||
|
|
|
|
|
|
|
||||
| ||||||||||
|
|
|
|
|
Persons using assistive technology might not be able to fully access information in this file. For assistance, please send e-mail to: mmwrq@cdc.gov. Type 508 Accommodation and the title of the report in the subject line of e-mail. Increase in Poisoning Deaths Caused by Non-Illicit Drugs --- Utah, 1991--2003Deaths caused by drug poisoning of unintentional and undetermined intent are an increasing problem in Utah and elsewhere in the United States (1). To characterize the trend in drug-poisoning deaths in Utah, CDC and the Utah Department of Health analyzed medical examiner (ME) data for 1991--1998 and 1999--2003. This report summarizes the results of that analysis, which determined that, during 1991--2003, the number of Utah residents dying from all drug poisoning increased nearly fivefold, from 79 deaths in 1991 (rate: 4.4 per 100,000 population) to 391 deaths in 2003 (rate: 16.6). This increase has been largely the result of the tripling of the rate (from 1.5 during 1991--1998 to 4.4 during 1999--2003) in poisoning deaths of unintentional or undetermined intent caused by non-illicit drugs (i.e., medications that can be legally prescribed) (Figure). Further study is needed to understand these trends and to develop strategies to prevent deaths of unintentional or undetermined intent from non-illicit drug poisoning. Utah has a centralized statewide ME system with statute-specified jurisdiction that includes drug-related deaths. The ME database used for these analyses contains decedent demographics; data on the circumstances, causes, and manner of death; examination results; and laboratory findings (2). A drug-poisoning death was defined as the death of a Utah resident with drug poisoning listed as cause of death. Deaths were identified by searching the ME database for a drug-poisoning--related keyword (e.g., drug, overdose, poisoning, toxicity, or intoxication). Deaths identified by that search were each reviewed to verify that they met the case definition. Each death was classified as related to illicit drugs only, to non-illicit drugs only, or to both illicit and non-illicit drugs. Each death was also classified as 1) intentional (i.e., suicide or homicide) or 2) unintentional (e.g., nonsuicidal, nonhomicidal, or natural deaths) or undetermined (i.e., cause unknown). Decedent characteristics, annual numbers and rates of drug-poisoning deaths, and trends in drug-poisoning deaths were analyzed. Death rates were calculated by using denominators from the Utah Population Estimate Query System (3). To examine a possible association between overweight or obesity and drug-poisoning death, which had been noted anecdotally by Utah MEs, decedents were categorized based on body mass index (BMI) (4). For analysis of this association, population estimates were based on results from the Utah Behavioral Risk Factor Surveillance System (Unpublished data, 2003). To examine the effect of urban versus rural residence, rates were calculated separately for four urban counties (Davis, Weber, Salt Lake, and Utah counties) that contain approximately 75% of the Utah population, and for the remaining counties in the state, which were classified as rural (3). During 1991--2003, a total of 2,396 drug-poisoning deaths were identified, of which 947 were caused by illicit drugs only, 1,277 by non-illicit drugs only, and 172 by a combination of illicit and non-illicit drugs. Alcohol was also implicated in 22% of drug-poisoning deaths; however, alcohol was not considered a drug for these analyses. The largest increase in annual drug-poisoning deaths (from 55 in 1991 to 237 in 2003) was attributed to non-illicit drugs. Illicit drug-poisoning deaths increased each year during 1991--1998 and then decreased to 92 deaths in 2003. Deaths resulting from a combination of illicit and non-illicit drugs increased gradually during 1991--2002, then increased substantially, from 15 in 2002 to 35 in 2003. Among deaths attributed to non-illicit drugs, during 1991--2003, a total of 733 were classified as of unintentional or undetermined intent; because these deaths had increased substantially since 1999, they were examined for the periods 1991--1998 and 1999--2003. Further analyses focused on possible associations of selected characteristics of the decedents and the drug types involved in their deaths. Death rates varied by age group and were highest for adults aged 25--54 years. Comparing cumulative 1991--1998 data with those for 1999--2003, the greatest numeric increase in deaths (from 42 to 142) occurred among adults aged 45--54 years (Table 1). Death rates per 100,000 population were higher for men than women during both periods (men: 1.86 and 4.90; women: 1.08 and 3.90), but the percentage increase in rates from 1991--1998 to 1999--2003 was greater for women than men (261% versus 163%). More deaths occurred in urban areas than rural areas during both periods (186 versus 45, during 1991--1998; 362 versus 140, during 1999--2003); however, the increase in death rate from 1991--1998 to 1999--2003 was greater in rural areas than urban areas (317% versus 171%). In addition, although substantial increases in death rates occurred from 1991--1998 to 1999--2003 in each BMI category, rates were substantially higher during 1999--2003 among persons who were overweight (5.26 per 100,000 population) or obese (14.25), compared with persons who were not overweight or obese (3.61) (Table 1). Methadone and other prescription narcotics accounted for most of the increase from 1991--1998 to 1999--2003 in non-illicit drug-poisoning deaths of unintentional or undetermined intent. Comparing these periods, deaths attributable to methadone increased from two to 33 per year, and deaths attributable to other prescription narcotics (principally oxycodone and hydrocodone) increased from 10 to 48 per year (Table 2). From 1991--1998 to 1999--2003, the proportions of these deaths that involved alcohol or antidepressants decreased from 32.9% and 14.7%, respectively, to 19.9% and 6.6% (Table 2). Reported by: EM Caravati, MD, Utah Poison Control Center, Salt Lake City; T Grey, MD, B Nangle, PhD, RT Rolfs, MD, Utah Dept of Health. CA Peterson-Porucznik, PhD, EIS Officer, CDC. Editorial Note:The findings in this report indicate that deaths attributed to drug poisoning have increased in Utah for more than a decade; however, the characteristics of these deaths have changed since 1999, when deaths caused by non-illicit drugs began to increase substantially. In 2003, the typical drug-poisoning decedent in Utah was overweight or obese, aged 25--54 years, had died from the effects of non-illicit drugs, and was less likely than previously to be male and to live in an urban area. The findings in this report are subject to at least three limitations. First, analysis was limited to deaths investigated by the Utah State Office of the Medical Examiner. Although this office has jurisdiction over all deaths thought to be drug-related, some drug-poisoning deaths might not have been properly reported and, therefore, might have been excluded from analysis. Second, BMI values for the decedents were based on measurements made by the ME. The measured body weight at postmortem examination might have been less than the decedent's usual body weight when alive. In addition, the denominator used for death rate calculations was based on self-reported data from a telephone survey in which respondents might underreport weight. The combined effects of these two potential biases are uncertain. Finally, whether being overweight or obese is a risk factor for fatal drug poisoning or the result of greater use of these drugs by overweight persons cannot be determined from the data. The Drug Enforcement Administration collects information regarding the movement of controlled substances from manufacture through commercial distribution channels by using the Automation of Reports and Consolidated Orders System (ARCOS) (5). From 1997 to 2002, the amount of drugs distributed to Utah and the United States (in grams per 100,000 population) increased substantially for several of the prescription drugs described in this report, including methadone (Utah: from 269 g to 1,703 g; United States: 194 g to 954 g), oxycodone (Utah: 1,848 g to 9,804 g; United States: 1,668 g to 8,056 g), and hydrocodone (Utah: 4,754 g to 8,122 g; United States: 3,249 g to 6,777 g). The numbers of drug-poisoning deaths attributed to each of these drugs increased at a greater rate than the supplies of the drugs in Utah. In addition, from 1997 to 2002, the codeine supply declined (Utah: from 7,746 g to 5,179 g; United States: 9,396 g to 8,149 g), possibly suggesting a prescription preference for newer pain-relieving drugs. The sixfold increase in the methadone supply in Utah and fivefold increase in the United States were not the result of expansion of addiction treatment programs; ARCOS does not track drugs distributed through such programs. Methadone is also used to control pain and can be prescribed by physicians for pain management. Review of ME investigations into methadone deaths during 1996--2000 revealed previous methadone prescriptions for 48% (17 of 35) of decedents. A valid methadone prescription at time of death was found for 40% (14 of 35) of decedents. Of those with a valid prescription, seven (50%) were taking methadone for the first time (range: zero to 17 previous prescriptions) when they died. Sources of decedents' drugs cannot always be determined from ME data. The narcotics associated with a drug-poisoning death might have been prescribed for pain, acquired illegally, or (in the case of methadone) obtained from an addiction treatment program. Further research is needed to investigate the proportion of deaths that occurred among legitimate users of prescription medications, and to identify risk factors that might increase the likelihood of drug-poisoning deaths for patients using prescription medications. Other state health departments that track drug-poisoning deaths should conduct their own analyses of unintentional or undetermined drug-poisoning deaths caused by non-illicit drugs. Steps should be taken to ensure safe use of non-illicit, pain-relieving medications while more information regarding factors contributing to deaths is collected. Such steps should include increased education for both health-care providers and their patients. References
Table 1  Return to top. Table 2  Return to top. Figure 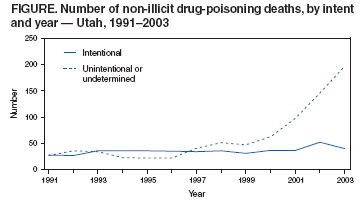 Return to top.
Disclaimer All MMWR HTML versions of articles are electronic conversions from ASCII text into HTML. This conversion may have resulted in character translation or format errors in the HTML version. Users should not rely on this HTML document, but are referred to the electronic PDF version and/or the original MMWR paper copy for the official text, figures, and tables. An original paper copy of this issue can be obtained from the Superintendent of Documents, U.S. Government Printing Office (GPO), Washington, DC 20402-9371; telephone: (202) 512-1800. Contact GPO for current prices. **Questions or messages regarding errors in formatting should be addressed to mmwrq@cdc.gov.Page converted: 1/20/2005 |
|||||||||
This page last reviewed 1/20/2005
|