 |
|
|
|
|
|
|
| ||||||||||
|
|
|
|
|
|
|
||||
| ||||||||||
|
|
|
|
|
Persons using assistive technology might not be able to fully access information in this file. For assistance, please send e-mail to: mmwrq@cdc.gov. Type 508 Accommodation and the title of the report in the subject line of e-mail. Prevalence of Diabetes Among Hispanics --- Selected Areas, 1998--2002Diabetes disproportionately affects Hispanics in the United States (1). However, the Hispanic population is composed of culturally distinct subpopulations that tend to be regionally concentrated (2), and the prevalence of diabetes can differ in these subpopulations (3). CDC analyzed data from Behavioral Risk Factor Surveillance System (BRFSS) surveys to estimate the prevalence of diabetes among Hispanic and non-Hispanic white adults residing in six states and among Hispanics in Puerto Rico, assessing disparities by geographic location. This report summarizes the findings of that analysis, which indicated that Hispanics continued to have a higher prevalence of diabetes than non-Hispanic whites and that disparities in diabetes between these two populations varied by area of residence. These findings underscore the need to target Hispanics and other populations with higher prevalence of diabetes to eliminate racial/ethnic disparities. BRFSS conducts state-based, random-digit--dialed telephone surveys of the U.S. civilian, noninstitutionalized population aged >18 years in all 50 states, the District of Columbia, Puerto Rico, and other U.S. territories. Respondents were considered to have diabetes if they answered "yes" to the question, "Has a doctor ever told you that you have diabetes?" Women who were told that they had diabetes, but only during pregnancy, were classified as not having diabetes. All respondents who reported being of Hispanic origin were considered to be Hispanic, regardless of race; all respondents who reported being white, but not of Hispanic origin, were considered to be non-Hispanic white. Because of the limited number of Hispanics in the annual BRFSS surveys, data were aggregated for 1998--2002 for the six geographic areas with the greatest proportions of Hispanics: California, Florida, Illinois, New York/New Jersey (neighboring states combined for a larger sample), Texas, and Puerto Rico. Data were weighted to reflect the age, sex, and racial/ethnic distribution of the noninstitutionalized population of those six areas. The interviews were conducted in English and Spanish; however, data were not collected regarding the language used. All differences were statistically significant (p<0.05) unless otherwise noted. The prevalence of diabetes was estimated for Hispanics and non-Hispanic whites in each area by age, sex, education level, body mass index from respondents' self-reported weight and height (BMI = kg/m2), health insurance coverage, and participation in physical activity outside of work during the previous month. Respondents were classified as overweight if their BMI was 25.0--29.9 and obese if their BMI was >30.0. Data were age- and sex-adjusted by the direct method using the 2000 U.S. standard population, and 95% confidence intervals (CIs) were calculated; a t-test was conducted to determine whether differences in diabetes prevalence between populations in each area were statistically significant. The prevalences of Hispanics and non-Hispanic whites in Puerto Rico were not compared because of the limited sample of non-Hispanic whites. The median response rate for the six areas was 52.2% in 1998 (range: 32.5%--76.7%), 45.0% in 1999 (range: 36.2%--69.5%), 41.5% in 2000 (range: 28.8%--65.3%), 39.7% in 2001 (range: 33.3%--81.5%), and 45.2% in 2002 (range: 42.2%--75.2%). Overall, 7.4% of Hispanics in the six areas had been told by a doctor that they had diabetes; prevalence ranged from 6.2% in Illinois and New York/New Jersey to 9.3% in Puerto Rico (Table 1). Among both Hispanics and non-Hispanic whites, diabetes prevalence increased with age (p<0.001; t-test for trend). The overall and age-specific diabetes prevalence was significantly higher among Hispanics than among non-Hispanic whites in California (7.8% versus 5.1%) and Texas (7.1% versus 5.7%) (Table 1). In other areas, diabetes prevalence was significantly higher among Hispanics only for those aged 45--54 years in Illinois (15.9% versus 4.6%), for those aged 45--64 years in New York/New Jersey (10.5% versus 4.4% for those aged 45--54 years and 15.9% versus 9.8% for those aged 55--64 years), and for those aged >65 years in Florida (20.6% versus 12.2%) (Table 1). Among Hispanics in Puerto Rico, the overall and age-specific diabetes prevalence was significantly higher than that among non-Hispanic whites in the other five areas (9.3% versus 5.1% in California, 5.6% in New York/New Jersey, 5.7% in Texas, 6.0% in Illinois, and 6.6% in Florida) (Table 1). Overall, the age-adjusted diabetes prevalence among Hispanics was approximately twice that among non-Hispanic whites (9.8% versus 5.0%) (Table 2). Among Hispanics, the prevalence for men and women was similar (9.7% versus 9.9%), but among non-Hispanic whites, the prevalence was significantly higher for men than women (5.5% versus 4.5%) (Table 2). Across all other characteristics examined, the age- and sex-adjusted prevalence was significantly higher among Hispanics. For both Hispanics and non-Hispanic whites, the age- and sex-adjusted prevalence decreased with education level and increased with BMI (p<0.001; t-test for trend); prevalence was significantly lower among those who had participated in physical activity during the previous month but was not significantly associated with health insurance coverage (Table 2). Reported by: NR Burrows, MPH, R Valdez, PhD, LS Geiss, MA, ME Engelgau, MD, Div of Diabetes Translation, National Center for Chronic Disease Prevention and Health Promotion, CDC. Editorial Note:Diabetes, which is associated with severe morbidity and premature death, continues to disproportionately affect Hispanic adults in the United States and Puerto Rico. Similar to previous findings (1,3,4), the results of this analysis indicated that the age-adjusted prevalence of diabetes among Hispanics was twice that among non-Hispanic whites and that the age-adjusted prevalence among Hispanics was lowest in Florida and higher in California, Texas, and Puerto Rico. The differences in diabetes prevalence by geographic location suggest that differences among Hispanic subpopulations in access to quality health care, social and cultural factors, or genetic factors might at least partially explain disparities in diabetes prevalence (3,5). However, diabetes prevalence was not associated with health insurance coverage. The results of this analysis might help programs target their diabetes-prevention and -control efforts more effectively by identifying disparities in diabetes prevalence between Hispanics and non-Hispanic whites for each geographic location. In addition, these results identified groups in particular need of intervention to prevent and control diabetes, such as persons with less than a high school education. Overweight and obesity contribute to racial/ethnic disparities in diabetes prevalence (6). However, at each BMI level, Hispanics had a higher prevalence of diabetes than non-Hispanic whites. The reasons for this disparity remain unclear. Nutrition factors (e.g., diets low in fiber and high in calories) might increase risk for diabetes; however, these factors were not evaluated in the study. The findings in this report are subject to at least six limitations. First, prevalence estimates obtained from telephone surveys likely are lower than the actual prevalence in a geographic location because diabetes prevalence is higher among persons without telephones (7). Second, total prevalence is underestimated because some persons have undiagnosed diabetes. Results of the National Health and Nutrition Examination Survey from 1999--2000 indicated that for every two persons with diagnosed diabetes, one person had undiagnosed diabetes (4). Third, small samples might have restricted the ability to detect differences in certain geographic locations. Fourth, the median BRFSS response rates for the six states and Puerto Rico ranged from 39.7% to 52.2% during the years of study; however, BRFSS data have minimal bias compared with census data. Fifth, the analysis included data from only six states and Puerto Rico and therefore is not representative of all Hispanics in the United States. However, the Hispanic population in these areas includes 84% of all U.S. Hispanics (2). Finally, data on the preferred language of interview for Hispanics were not available. To eliminate racial/ethnic disparities in diabetes prevalence, CDC is targeting those populations at greatest risk. An estimated 41 million persons in the United States are at high risk for diabetes (8). However, studies suggest that, among those at high risk, diabetes can be prevented or delayed with sustained lifestyle changes such as a 7% weight loss and moderate-intensity physical activity (e.g., walking for 30 minutes, 5 days a week) (9). The National Diabetes Education Program, sponsored by CDC and the National Institutes of Health, has implemented a national multicultural diabetes prevention campaign, Small Steps. Big Rewards. Prevent Type 2 Diabetes*, to motivate persons at high risk to make these lifestyle changes. This campaign, which includes motivational tip sheets and public service ads, specifically targets older adults, Hispanics, blacks, American Indians/Alaska Natives, Asians, and Pacific Islanders. Education materials and prevention tools for health-care providers, the public, and businesses are also available†. As part of its prevention initiative, Steps to a HealthierUS, the U.S. Department of Health and Human Services (DHHS) awarded approximately $37.5 million to support efforts by 40 communities to prevent diabetes, obesity, and asthma. Because serious diabetes-related health problems can be delayed or even prevented with early diagnosis and proper treatment (10), CDC is also leading implementation of the DHHS Diabetes Detection Initiative, a national program§ to help find and enter into care an estimated 5 million U.S. residents who have type 2 diabetes but do not know it. References
* Available at http://www.ndep.nih.gov/campaigns/smallsteps/smallsteps_index.htm. † Available at http://www.diabetesatwork.org. § Available at http://www.ndep.nih.gov/ddi/index.htm.
Table 1 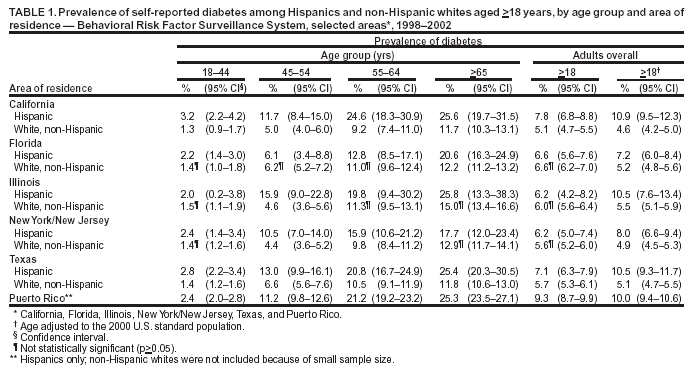 Return to top. Table 2 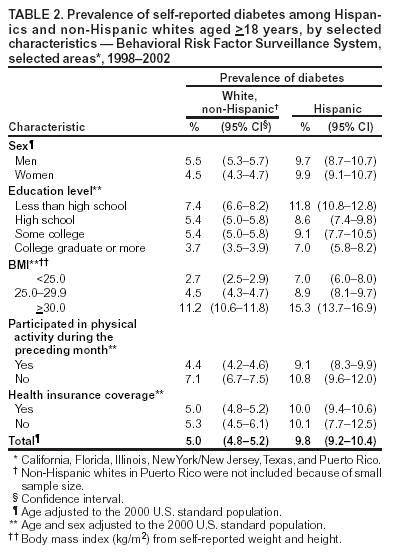 Return to top.
Disclaimer All MMWR HTML versions of articles are electronic conversions from ASCII text into HTML. This conversion may have resulted in character translation or format errors in the HTML version. Users should not rely on this HTML document, but are referred to the electronic PDF version and/or the original MMWR paper copy for the official text, figures, and tables. An original paper copy of this issue can be obtained from the Superintendent of Documents, U.S. Government Printing Office (GPO), Washington, DC 20402-9371; telephone: (202) 512-1800. Contact GPO for current prices. **Questions or messages regarding errors in formatting should be addressed to mmwrq@cdc.gov.Page converted: 10/14/2004 |
|||||||||
This page last reviewed 10/14/2004
|