 |
|
|
|
|
|
|
| ||||||||||
|
|
|
|
|
|
|
||||
| ||||||||||
|
|
|
|
|
Persons using assistive technology might not be able to fully access information in this file. For assistance, please send e-mail to: mmwrq@cdc.gov. Type 508 Accommodation and the title of the report in the subject line of e-mail. Work-Related Roadway Crashes --- United States, 1992--2002The risk for roadway crashes associated with driving or riding in a motor vehicle at work affects millions of persons in the United States. In 2001, approximately 4.2 million U.S. workers were classified as motor-vehicle operators (Bureau of Labor Statistics [BLS], unpublished data, 2001). Workers who use motor vehicles to perform their jobs include those who operate vehicles owned or leased by their employers and those who drive personal vehicles for work purposes. To characterize fatal occupational roadway crashes and identify workers at highest risk for fatality, CDC analyzed data for 1992--2002 from the Fatality Analysis Reporting System (FARS) of the National Highway Traffic Safety Administration and the Census of Fatal Occupational Injuries (CFOI) of BLS. This report summarizes the results of that analysis, which indicated that roadway crashes were the leading cause of occupational fatalities and that workers in transportation-related occupations were at highest risk. Effective strategies to prevent motor-vehicle--related crashes in the general public also can reduce work-related crashes. Employers should promote safe driving through vehicle selection and company policy. FARS is a census of all police-reported traffic crashes resulting in a fatality within 30 days of a crash and relies on death certificates to ascertain work relationship. CFOI is a multisource surveillance system for occupational fatalities and provides a more complete count of work-related crashes. Unlike FARS, CFOI includes information on the occupation and industry of the fatally injured worker; however, FARS provides more detailed information on crash circumstances and contributing factors. National death rates were calculated by using employment data from the BLS Current Population Survey, a household-sample survey of the civilian, noninstitutional population. Rates were calculated for persons aged >15 years. During 1992--2001, a total of 13,337 civilians died in work-related roadway crashes in the United States (CFOI, unpublished data, 1992--2001). Rates remained stable during the decade, averaging approximately one fatality per 100,000 full-time equivalent (FTE) workers. Of the 13,337 fatalities, 11,931 (89%) were males, whose fatality rate was six times that of females (1.7 per 100,000 FTE workers versus 0.3). Rates increased markedly beginning at age 55 years: 1.6 deaths per 100,000 FTE among workers aged 55--64 years (n = 1,875), 3.8 among those aged 65--74 years (n = 749), and 6.4 among those aged >75 years (n = 241). During 1992--2001, fatal work-related roadway crashes most often involved collisions of vehicles (6,593 [49%]), followed by single-vehicle incidents that did not involve a collision with another vehicle or with a pedestrian (e.g., rollovers) (3,492 [26%]), and collisions between a vehicle and a stationary object (2,369 [18%]). Vehicles most commonly occupied by fatally injured workers were semi-trucks (3,780 [28%]), cars (3,140 [24%]), other and unspecified trucks (2,359 [18%]), and pickup trucks (1,607 [12%]). The annual number of deaths of pickup truck occupants increased 96%, and deaths of semi-truck occupants increased 49%. Deaths of car occupants decreased 33% (Figure). The transportation, communications, and public utilities industries, which include commercial trucking, had the largest number and rate of roadway deaths (4,358 deaths; 4.6 per 100,000 FTE workers) (Table 1). The services industry accounted for the second highest number of deaths (1,884) but had a low fatality rate (0.5). The construction; public administration; wholesale trade; agriculture, forestry, and fishing; and mining industries all had higher death rates than the overall rate for workers (1.1), ranging from 1.7 to 3.4 (Table 1). Occupations in which the largest numbers of roadway deaths occurred were transportation and material moving (6,212 deaths; 11.1 per 100,000 FTE workers). These occupations accounted for 47% of all work-related roadway fatalities (Table 2). Truck drivers, who are classified within transportation and material-moving occupations, accounted for 5,375 deaths (17.6), the highest number and rate for any single occupation. During 1997--2002, of 5,798 workers who died in work-related roadway crashes in 5,626 vehicles identified by FARS, 1,595 (28%) used safety belts, and 3,224 (56%) did not use safety belts or had none available; safety-belt use was unknown for 16% of fatalities. A total of 3,479 (62%) worker-occupied vehicles were registered to a business or government, 967 (17%) were registered to the driver, and 679 (12%) were registered to a person other than the driver. Factors associated with workers' vehicles that contributed to fatal crashes included running off the road or failing to stay in the proper lane (2,599 [46%]), driving over the speed limit or too fast for conditions (1,284 [23%]), driver inattention (609 [11%]), and driver drowsiness (373 [7%]). In 470 (8%) crashes in which a worker was fatally injured, the driver of the worker's vehicle was determined to have been drinking (FARS, unpublished data, 1997--2002). During 1992--2001, persons who died in crashes involving large trucks (gross vehicle weight rating: >10,000 pounds) were seven times as likely to be occupants of other vehicles as truck occupants. An average of 4,425 occupants of other vehicles involved in collisions with large trucks died each year, compared with 681 occupants of large trucks (1). Reported by: S Pratt, Div of Safety Research, National Institute for Occupational Safety and Health, CDC. Editorial Note:During 1992--2001, roadway crashes were the leading cause of occupational fatalities in the United States, accounting for an average of 1,300 civilian worker deaths each year (22% of all worker deaths). Despite overall declines in the number and rate of occupational fatalities from all causes, annual numbers of work-related roadway deaths increased during the decade, and rates showed little change. Because occupational drivers operate vehicles in various work settings, they are not subject to uniform levels of oversight. Commercial vehicles that carry freight or passengers in interstate commerce are covered by the Federal Motor Carrier Safety Regulations, which address nearly all aspects of vehicle operation, including driver qualification and fitness for duty, vehicle inspection, periodic checks of driving records, use of retroreflective sheeting to make trailers more visible, securing of cargo, and hours of service of drivers (2). No equivalent body of regulations is applicable to workers who drive other types of company-owned or personal vehicles for work purposes. For those drivers, the content, implementation, and enforcement of workplace driver--safety policies is left primarily to the employer. To reduce work-related roadway deaths, employers of workers who drive company or personal vehicles on the job should adhere to applicable safety regulations. Workplace driver--safety policies should be communicated, implemented, and enforced (Box). For worker drivers not covered by regulations, employers have an especially important role. Employers can demonstrate their commitment to occupational road safety by implementing company driver--safety policies and selecting safe vehicles. Effective strategies to prevent roadway crashes among the general population also can reduce work-related roadway crashes. Information regarding effective community-based interventions to increase safety-belt use and reduce impaired driving is available from the Task Force on Community Preventive Services at http://www.thecommunityguide.org. Health-care and safety professionals can 1) support collection and analysis of data on fatal and nonfatal crashes, 2) foster partnerships among diverse groups with interests in road safety, 3) evaluate the effectiveness of safety interventions (5), 4) promote safe driving practices among workers, and 5) educate the public about occupational road safety. References
Table 1 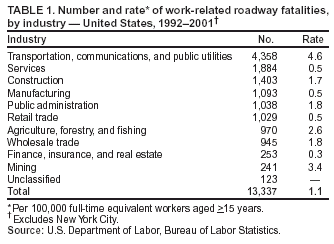 Return to top. Table 2 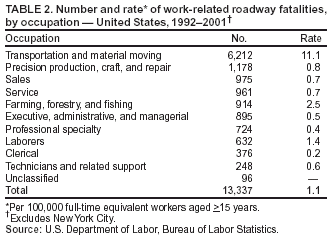 Return to top. Figure 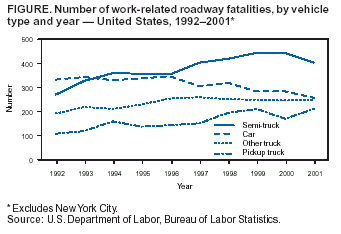 Return to top. Box 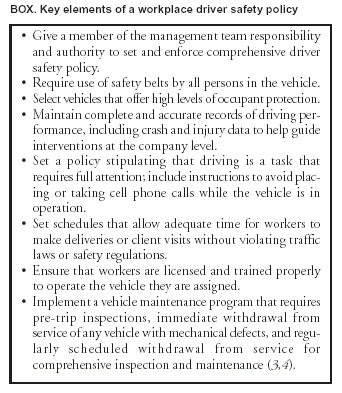 Return to top.
Disclaimer All MMWR HTML versions of articles are electronic conversions from ASCII text into HTML. This conversion may have resulted in character translation or format errors in the HTML version. Users should not rely on this HTML document, but are referred to the electronic PDF version and/or the original MMWR paper copy for the official text, figures, and tables. An original paper copy of this issue can be obtained from the Superintendent of Documents, U.S. Government Printing Office (GPO), Washington, DC 20402-9371; telephone: (202) 512-1800. Contact GPO for current prices. **Questions or messages regarding errors in formatting should be addressed to mmwrq@cdc.gov.Page converted: 4/1/2004 |
|||||||||
This page last reviewed 4/1/2004
|